0083
Comparison of inhomogeneous Magnetization Transfer (ihMT), R1 and MPF for myelin specific imaging1Aix Marseille Univ, CNRS, CRMBM, Marseille, France, 2APHM, Hôpital Universitaire Timone, CEMEREM, Marseille, France, 3Aix Marseille Univ, CNRS, IBDM, Marseille, France, 4Division of MR Research, Radiology, Beth Israel Deaconess Medical Center, Harvard Medical School, Boston, MA, United States
Synopsis
We conducted a comparative study of ihMT metrics variably weighted in T1D, with R1 (1/T1) and MPF (macromolecular proton fraction) for myelin specific imaging. These MRI methods were compared with histology by fluorescence microscopy using transgenic plp-GFP (proteolipid protein-Green Fluorescent Protein) mice.
Introduction
MR imaging specific to myelinated tissues is an essential tool in the detection and monitoring of demyelinating pathologies. Inhomogeneous magnetization transfer (ihMT) is an MT-based imaging technique weighted by T1D, the dipolar relaxation time1. Interestingly, varying the alternation rate between the positive and negative frequency-offsets for dual frequency RF irradiation, allows us to probe the tissue-intrinsic T1D values that make up the ihMT signal. This strategy, called T1D-filtering2, recently provided mouse brain ihMT images with high sensitivity to myelin3 and its alterations4.In this work we propose a comparative study of distinct T1D-filtered ihMT metrics with other quantitative metrics, which have shown sensitivity to myelin, including R1 (1/T1, longitudinal relaxation time) and MPF (macromolecular proton fraction). These methods were compared with the histological reference of fluorescence microscopy for myelin.
Methods
Five genetically modified plp-GFP5 control mice were scanned in vivo at 7T (Bruker PharmaScan, equipped with a 4-channel receive-only cryoprobe) with an ihMT/qMT/R1 protocol (resolution 100x100x750 µm3).IhMT: ihMT-RAGE 3D sequences6 with various values of Δt, the time between the switching offset in the dual frequency preparations (Figure 1), were used to acquire ihMT images with different T1D-filtering strengths. Other saturation parameters included: Hann shaped pulses, duration pw = 0.5 ms; peak pulse power B1peak = 42.4 µT; frequency-offset f = 10 kHz; number of pulses per burst Np = 8; burst repetition time BTR = 60 ms; MT pulse duty cycle DC = 6.7%; total saturation time τ = 900 ms and saturation power calculated over BTR, B1RMS = 6.7 µT.
Quantitative MT(qMT): 3D SPGR-based protocols were considered for single-point MPF mapping7, comprising acquisitions of MT-weighted and reference images, R1 (Variable Flip Angle8) and B1 maps (Actual Flip Angle9,10).
In addition, high-resolution T2-weighted structural images were acquired using a 2D multi-slice RARE sequence (78x78x300 µm3). Acquisition times for each sequence are reported in Table 1.
Post-processing: Template-based analyses were performed to quantitatively assess, in seven different brain structures, the values of R1, MPF, ihMTR (defined as ihMT/M0, where M0 is an image with zero power saturation) and ihMTsat (ihMT metric corrected for B1 inhomogeneities and T1 relaxation effects derived from a forward model of the ihMT-RAGE sequence11) for all T1D-filtering configurations.
R1, MPF, ihMTR and ihMTsat maps were registered onto a T2w template built upon the high-resolution RARE images, using Advanced Normalization Tool (ANTs, v.2.1.0)12. Quantitative values were evaluated structure-wise and mouse-wise at three levels with respect to the bregma (+0.7 mm; -1 mm; -3.2 mm) in ROIs (Figure 2) semi-automatically segmented with the Dorr atlas13.
Following MRI experiments, mouse brains were fixed by intracardiac perfusion (PFA 4%), extracted and sectioned into 20 µm thick slices for fluorescence microscopy analyses, to probe the same brain structures and slices as the MRI analyses.
Results and discussion
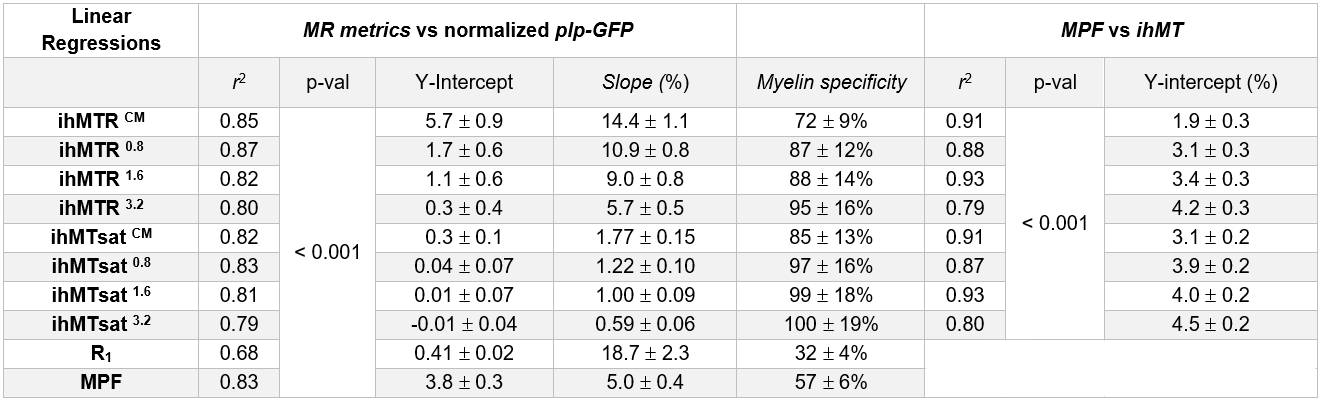
Representative slices of the 3D ihMTR, ihMTsat, MPF and R1 templates along with plp-GFP fluorescence microscopy images are shown in Figure 2. R1 maps showed relatively weak WM/GM contrast, when compared to MT-based techniques, while MPF images had higher Signal-to-Noise-Ratio (SNR) than ihMT images. Increasing the T1D-filtering strength led to a signal attenuation from increasingly longer T1D components, and to higher WM/GM contrast and lower signal intensity. Of particular interest, for all T1D-filtering conditions, the T1 and B1 corrected ihMTsat images presented higher WM/GM contrast than their ihMTR counterparts.Pearson’s correlation coefficients (r) and linear regression analyses were used to assess the relationship between all techniques (Figure 3, Table 2). The correlation matrix (Figure 3a) highlights strong associations (r2 > 0.79, p < 0.001) between GFP and MT-based techniques and a much lower association between R1 and GFP (r2 = 0.68, p < 0.001). Slopes and Y-intercepts of the linear regressions between MR techniques and GFP were used to assess the specificity to myelin (= slope/(slope + Y-intercept))3 for each technique (Table 2).
R1 showed the lowest specificity to myelin (32 ± 4%) by far. As a general trend, increasing the filtering strength resulted in a loss in sensitivity (evaluated from the slopes of the linear regressions) but in a gain in specificity for ihMTR/ihMTsat. This indicates that non-myelin macromolecules are associated with T1D values shorter than that of myelin. IhMTsat images, corrected for T1 and B1 effects, have increased specificity compared to their ihMTR counterparts, reaching values close to 100% for T1D-filtered ihMTsat (i.e. quasi-linear relationship between myelin content and ihMTsat, Figure 3b). MPF showed lower specificity (57 ± 6%) than any of the T1D-filtered ihMTR/ihMTsat images. The contribution of macromolecules other than myelin to MPF could explain this relatively low specificity to myelin. This is confirmed by the linear regression between MPF and ihMTsat (Figure 3c), which shows a decrease in the Y-intercept with decreasing T1D filtering (i.e. for greater contribution from non-myelin, short T1D components).
Conclusion
IhMT data filtered from short-T1D components and corrected for T1/B1 effects (ihMTsat) offers the highest specificity to myelinated tissues. The loss in sensitivity associated to T1D-filtering should however be considered. IhMTsat with weak/intermediary (Δt = 0.8/1.6 ms) T1D-filtering may represent a good sensitivity/specificity tradeoff for myelin imaging.Acknowledgements
This work was performed by a laboratory member of France Life Imaging network (grant ANR‐17‐ CE18‐0030, VERISMO project).References
1. Varma, G. et al. Interpretation of magnetization transfer from inhomogeneously broadened lines (ihMT) in tissues as a dipolar order effect within motion restricted molecules. J. Magn. Reson. 260, 67–76 (2015).
2. Prevost, V. H. et al. Optimization of inhomogeneous magnetization transfer (ihMT) MRI contrast for preclinical studies using dipolar relaxation time (T1D) filtering. NMR Biomed. 30, e3706 (2017).
3. Duhamel, G. et al. Validating the sensitivity of inhomogeneous magnetization transfer (ihMT) MRI to myelin with fluorescence microscopy. NeuroImage 199, 289–303 (2019).
4. Carvalho, V. N. D. et al. MRI assessment of multiple dipolar relaxation time (T 1 D ) components in biological tissues interpreted with a generalized inhomogeneous magnetization transfer (ihMT) model. J. Magn. Reson. 106668 (2019) doi: 10.1016/j.jmr.2019.106668.
5. Spassky, N. et al. The Early Steps of Oligodendrogenesis: Insights from the Study of the plp Lineage in the Brain of Chicks and Rodents. Dev. Neurosci. 23, 318–326 (2001).
6. Varma, G. et al. Three‐dimensional inhomogeneous magnetization transfer with rapid gradient‐echo (3D ihMTRAGE) imaging. Magn. Reson. Med. (2020) doi :10.1002/mrm.28324.
7. Soustelle, L., Antal, M. C., Lamy, J., Harsan, L. & Loureiro de Sousa, P. Determination of optimal parameters for 3D single‐point macromolecular proton fraction mapping at 7T in healthy and demyelinated mouse brain. Magn. Reson. Med. (2020) doi :10.1002/mrm.28397.
8. Chang, L.-C., Koay, C. G., Basser, P. J. & Pierpaoli, C. Linear least-squares method for unbiased estimation of T 1 from SPGR signals. Magn. Reson. Med. 60, 496–501 (2008).
9. Yarnykh, V. L. Actual flip-angle imaging in the pulsed steady state: A method for rapid three-dimensional mapping of the transmitted radiofrequency field. Magn. Reson. Med. 57, 192–200 (2007).
10. Nehrke, K. On the steady-state properties of actual flip angle imaging (AFI): Steady-State Properties of AFI. Magn. Reson. Med. 61, 84–92 (2009).
11. Munsch, F. et al. Characterization of the cortical myeloarchitecture with inhomogeneous magnetization transfer imaging (ihMT). NeuroImage 225, 117442 (2021).
12. Avants, B. B., Tustison, N. & Song, G. Advanced Normalization Tools (ANTS). 35.
13. Dorr, A. E., Lerch, J. P., Spring, S., Kabani, N. & Henkelman, R. M. High resolution three-dimensional brain atlas using an average magnetic resonance image of 40 adult C57Bl/6J mice. NeuroImage 42, 60–69 (2008).
Figures
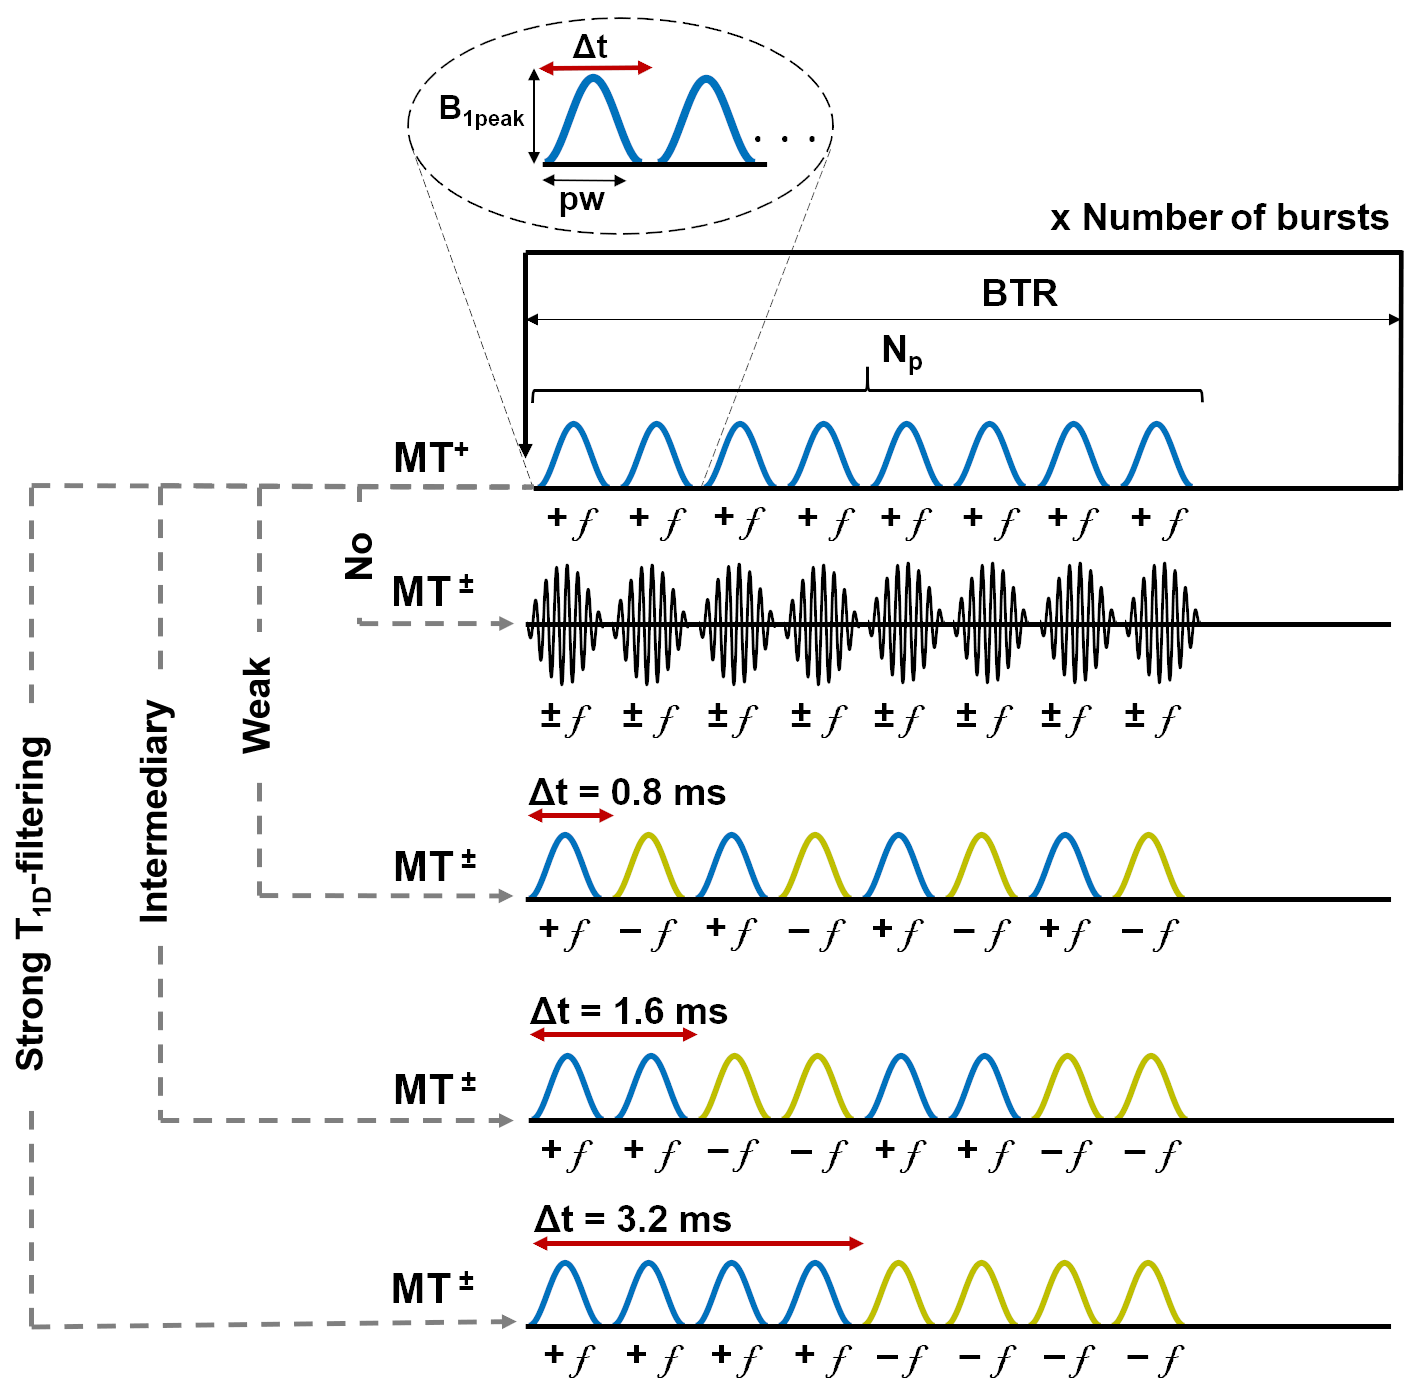
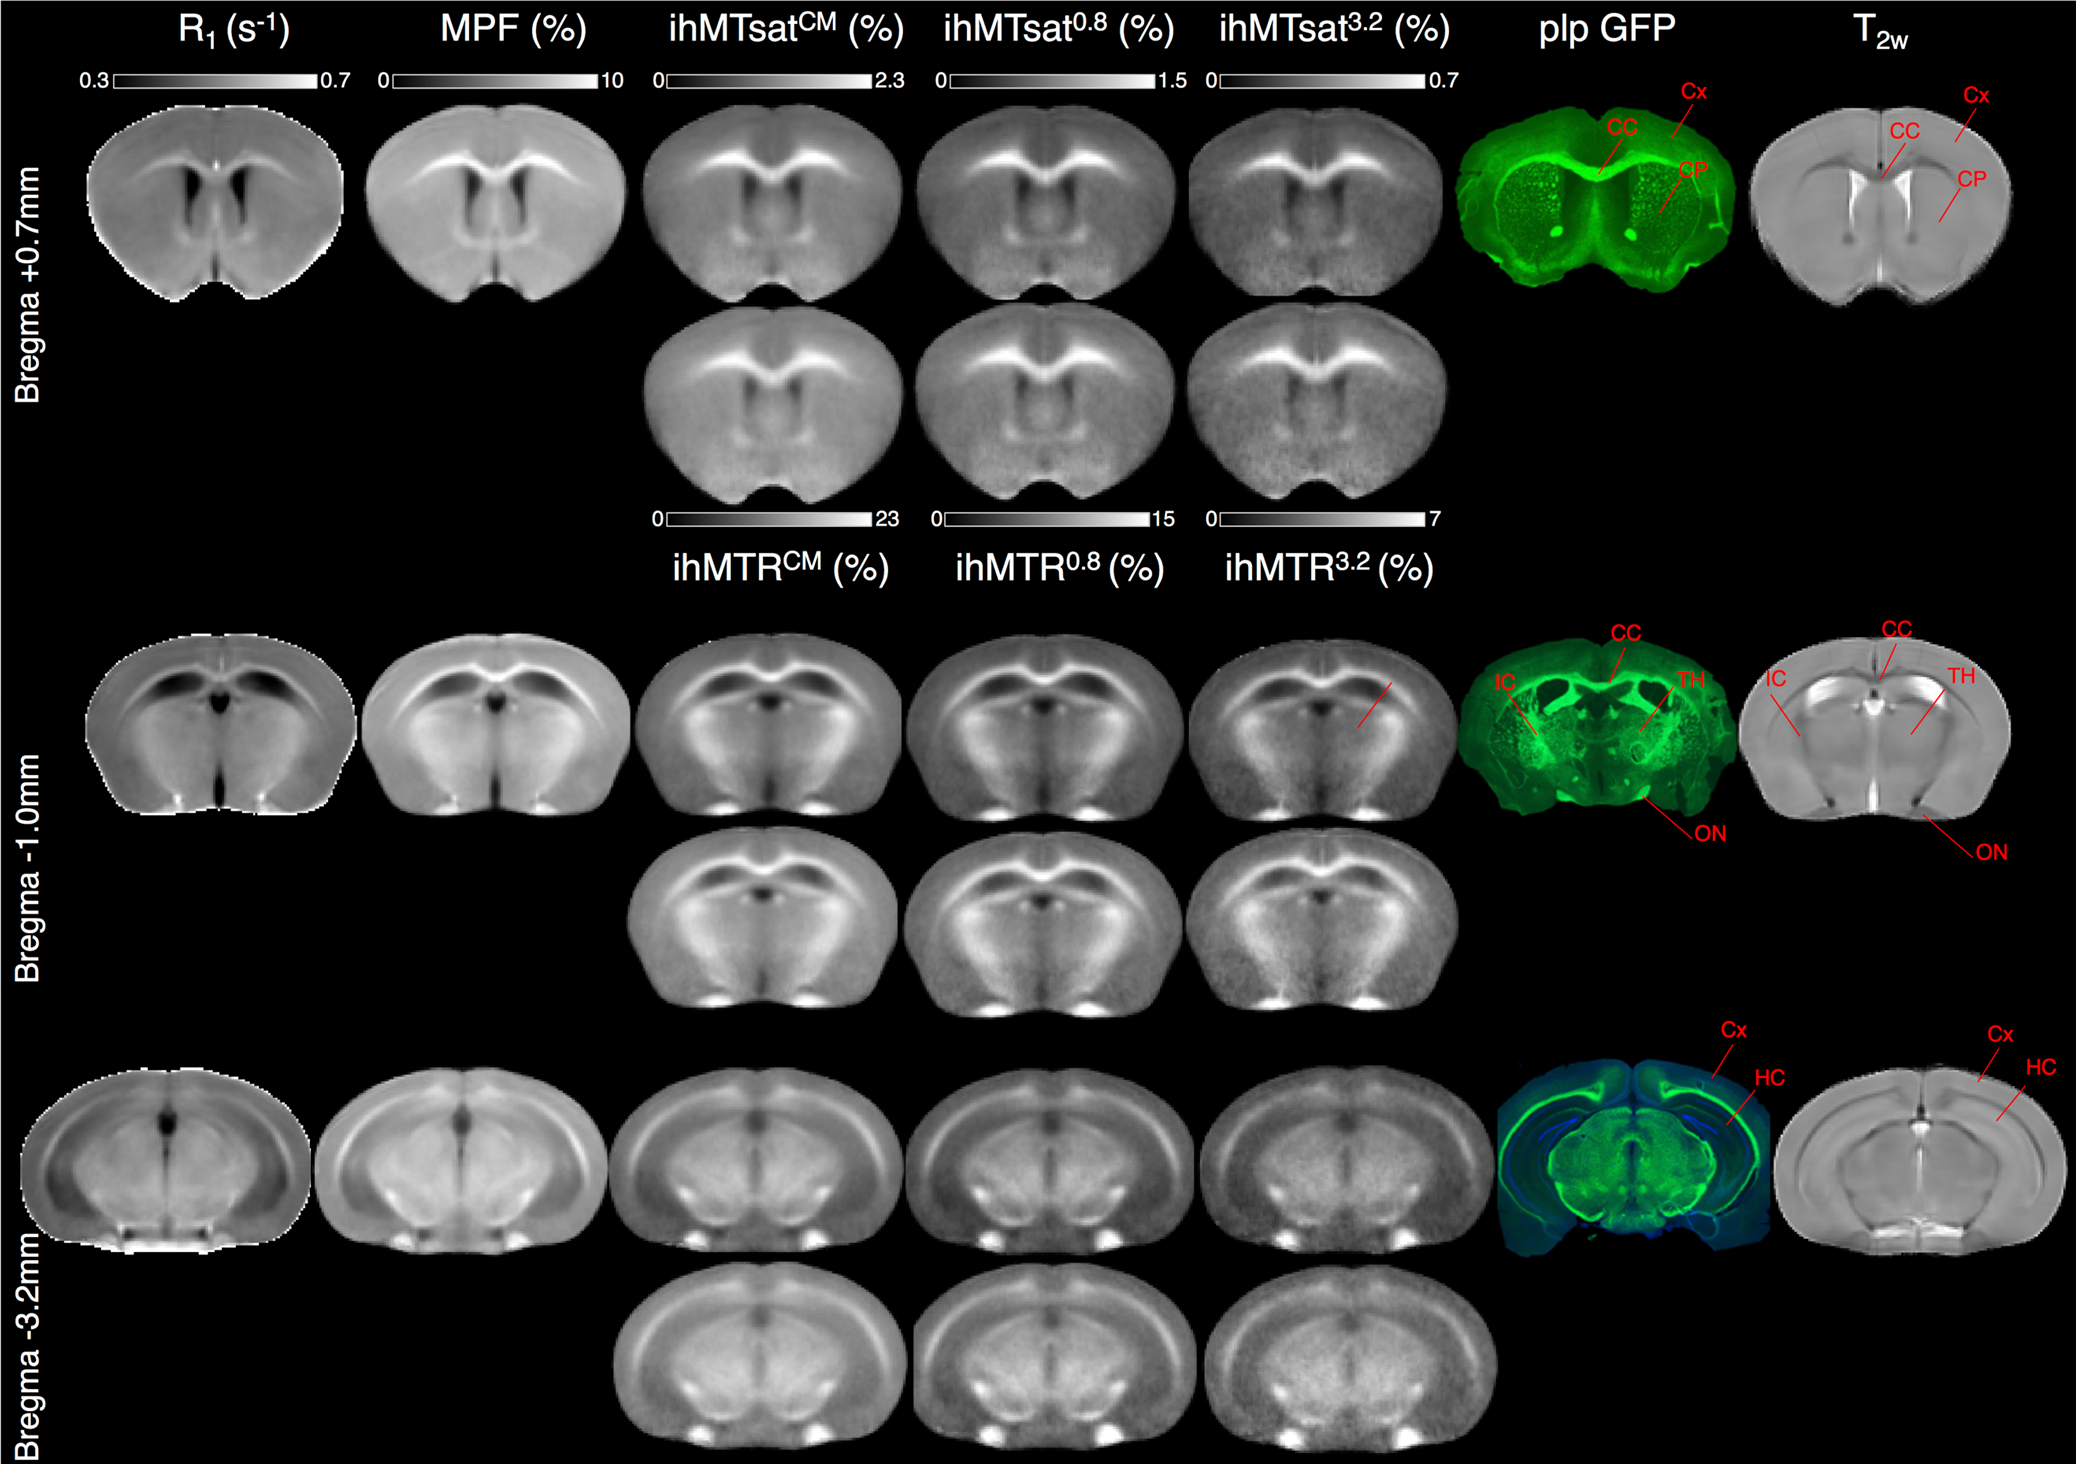
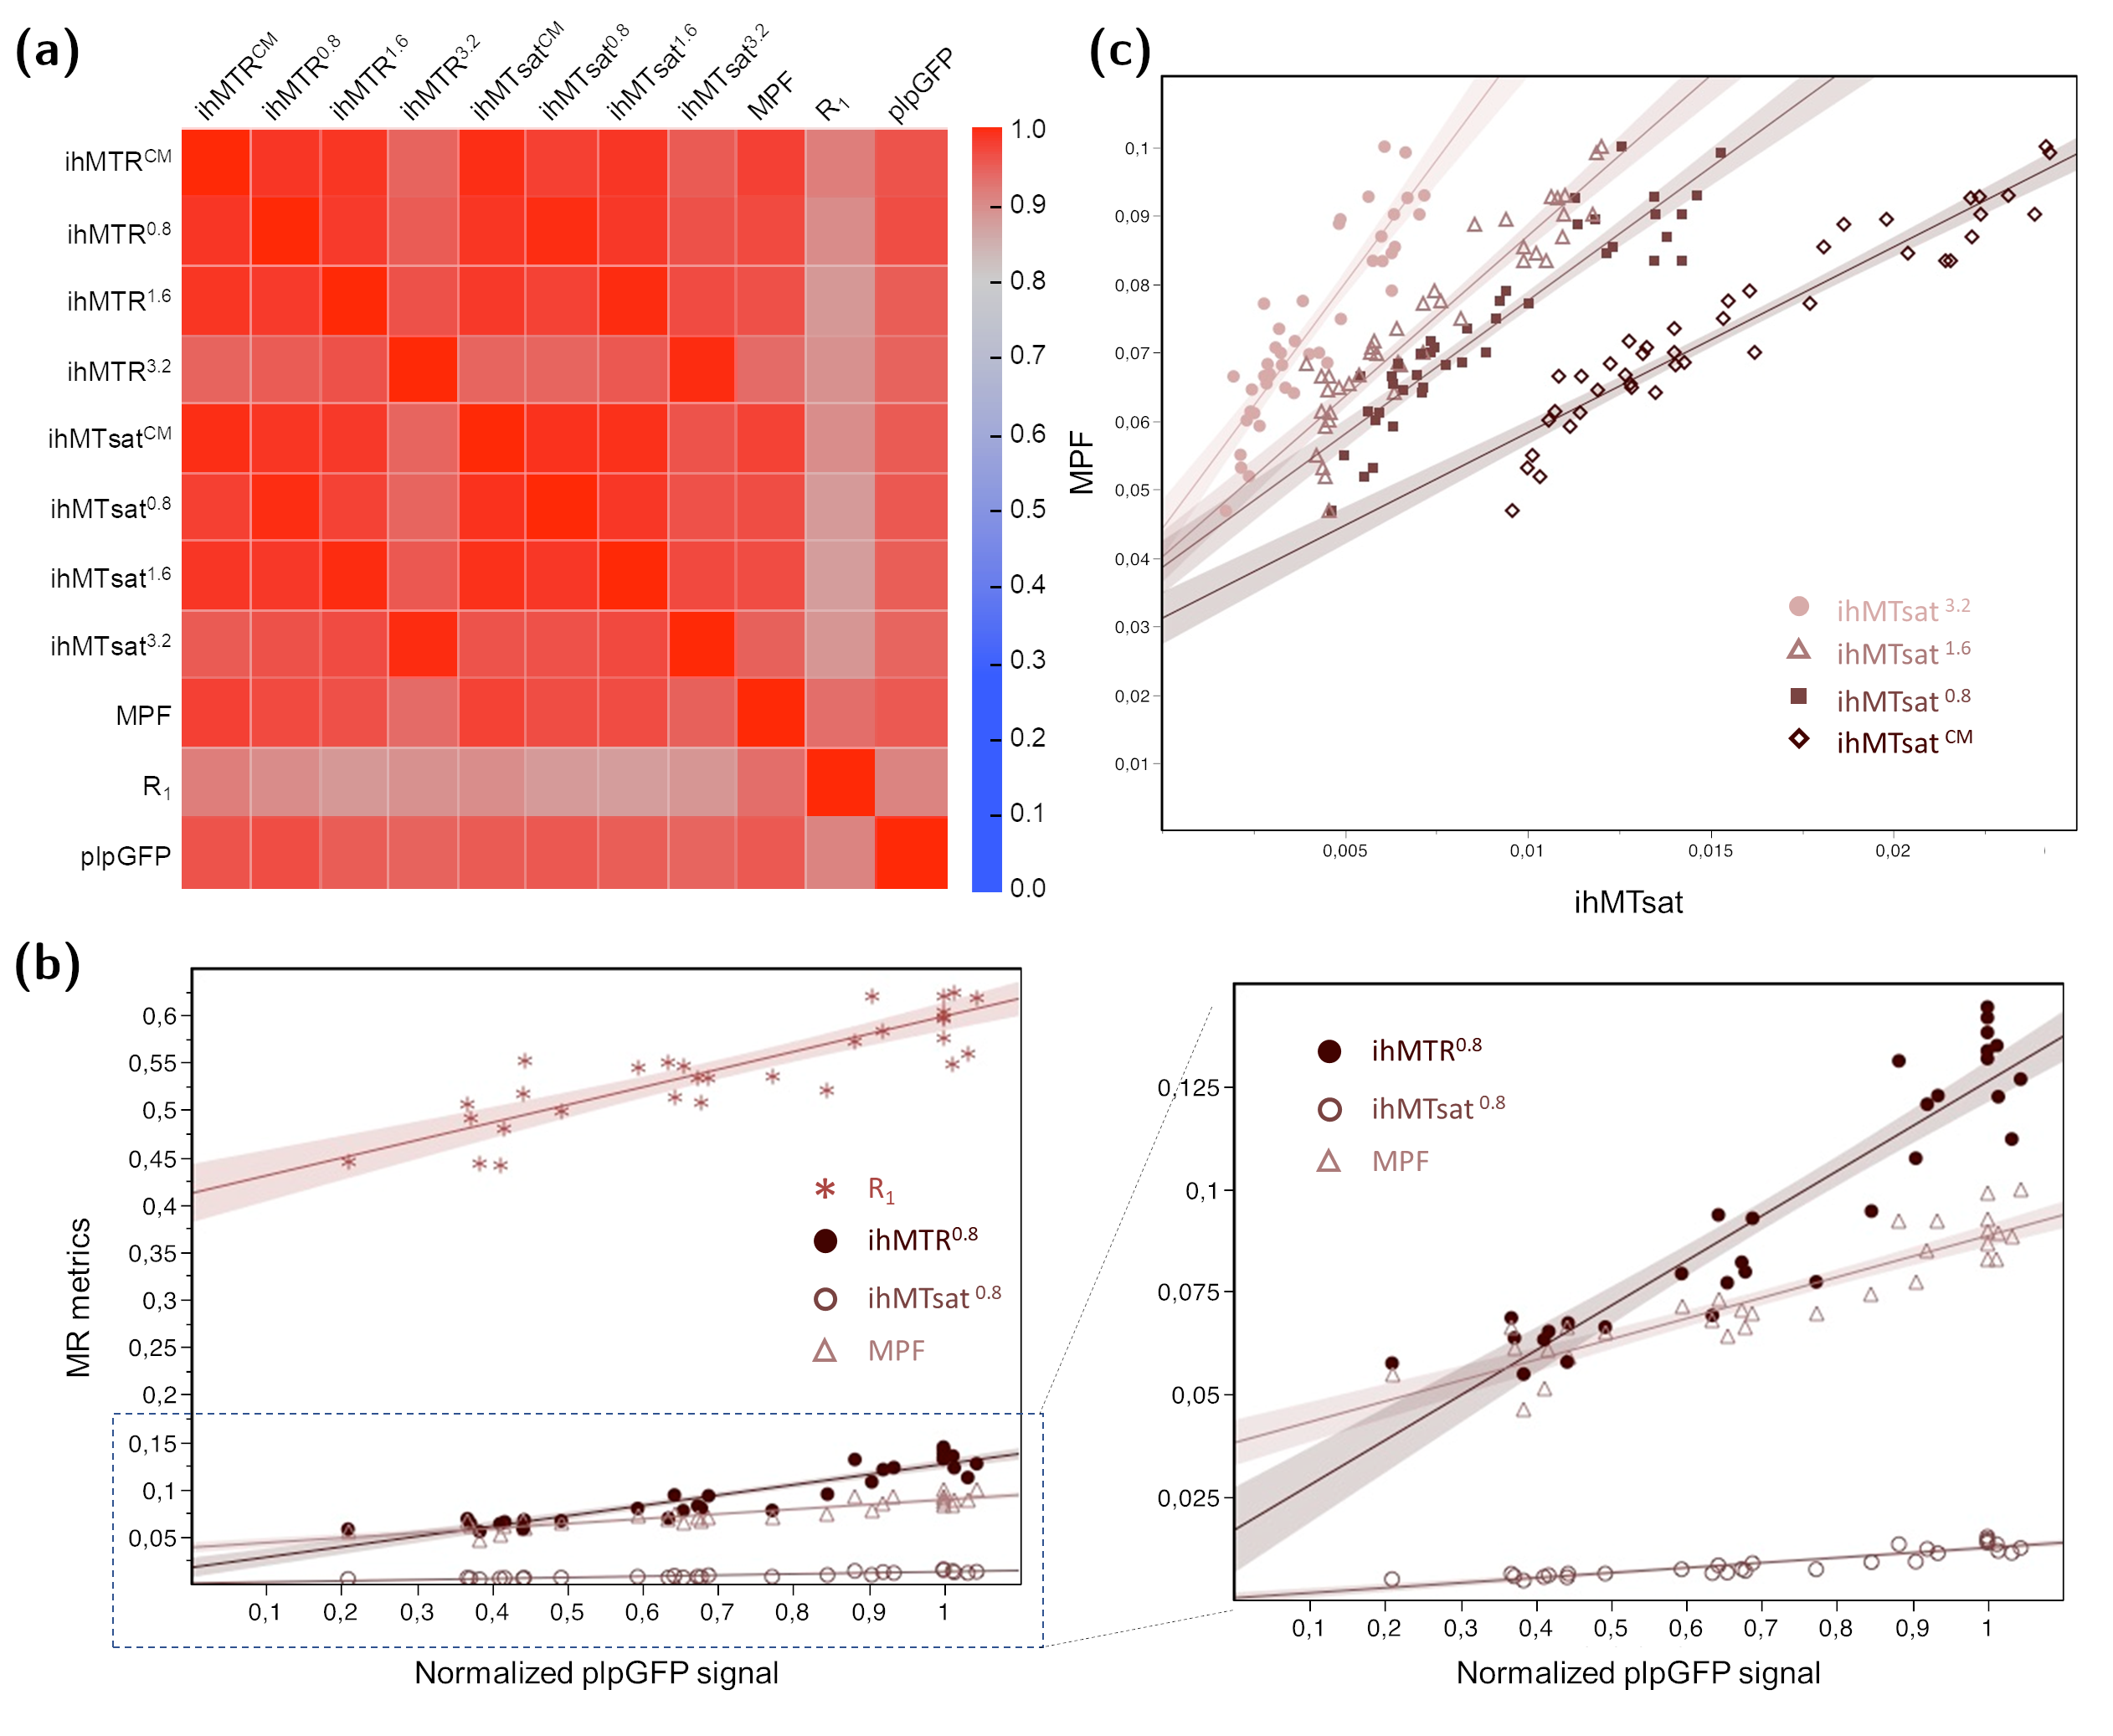
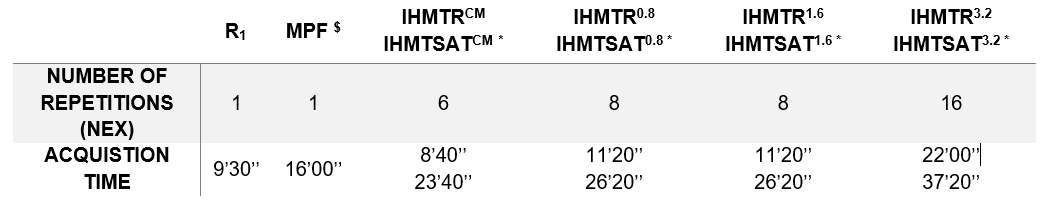
Table 1: Number of repetitions and acquisition time of each MRI technique.
$ Includes the acquisition of the R1, B0 and B1 maps. * Includes the acquisiton of the R1 and B1 maps.