0082
Investigating the microglial metabolome with high resolution 1H NMR1Physical Therapy and Rehabilitation Science, Radiology and Biomedical Imaging, UCSF, San Francisco, CA, United States, 2Department of Psychology & Neuroscience & the Center for Neuroscience, University of Colorado, Boulder, CO, United States
Synopsis
Microglia are an essential part of the brain’s immune system. In 2006, Frank et al. described a rapid isolation technique to obtain high-purity quiescent microglia from the rat brain, enabling study of their role in health and disease. Metabolomics via NMR is a robust, data-rich strategy for understanding cell metabolism. Given the central role of microglial metabolic reprogramming in numerous diseases, we investigated whether ultra-high-field 1H NMR could detect key metabolites in freshly isolated adult microglia. We optimized the isolation and extraction protocols and showed that several key microglia metabolites can be reliably quantified using high-resolution 1H NMR at 18.8Tesla.
Introduction
Microglia play a vital and complex role in the brain’s immune response, which is currently under investigation1. A strategy for interrogating freshly isolated adult microglia was developed in 2006 by Frank et al.2 who optimized a rapid, simple isolation protocol that produces a high purity population of quiescent microglia from the rat brain, without altering their in vivo phenotype. High resolution 1H NMR has not yet been optimized to assess steady state metabolism in microglia isolated by this protocol. As metabolic reprogramming occurs as microglia respond to acute insult or chronic disease development, this method could provide valuable information on the metabolic state of these cells following isolation, and in future, following insult. We hypothesized that high resolution 1H NMR at ultra-high field (18.8 Tesla) could reliably detect key metabolites in microglia freshly isolated from the rat whole brain. We first optimized the microglial isolation and extraction protocols to obtain NMR spectra without large contamination from solvents. We then demonstrated that several key metabolites can be reliably quantified using high resolution 1H NMR of lysed microglia using a NOESYgppr1D sequence at 18.8Tesla.Methods
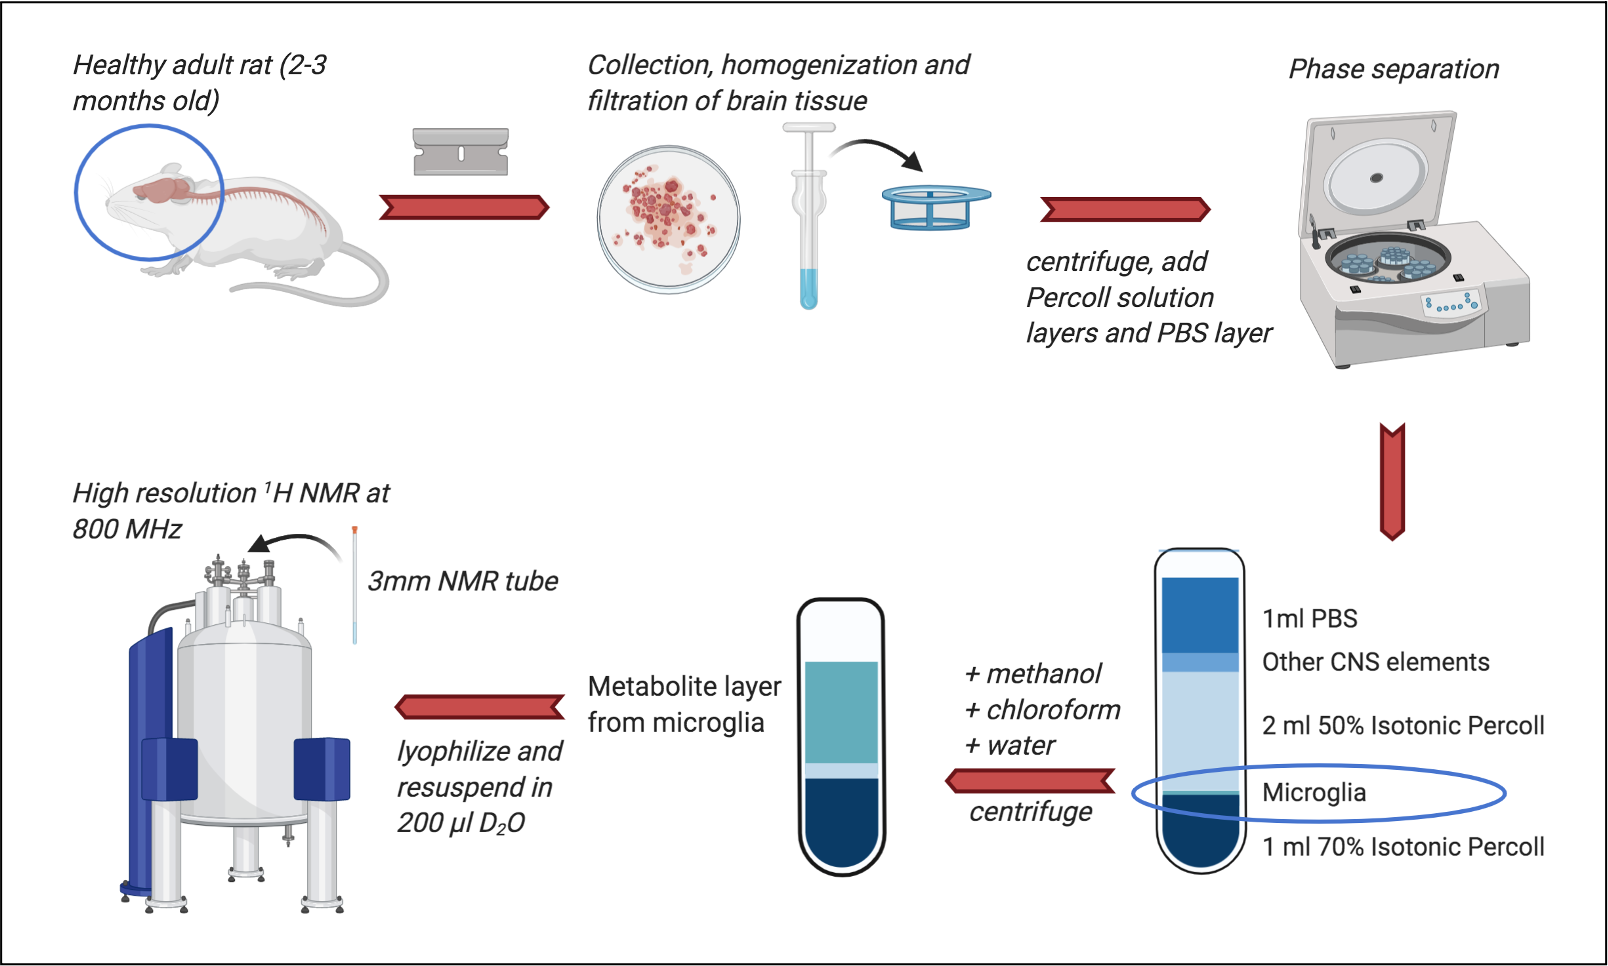
Microglial isolation (see Frank et al for full details)2: Brains from male Sprague–Dawley rats (n=8, 60–90 d; Harlan) were rapidly extracted on ice into a Petri dish with DPBS (initially supplemented with 0.2% glucose, removed in later experiments). Tissue was finely minced, homogenized, and filtered through a cell strainer before centrifugation. Layers of 70% and 50% isotonic Percoll solution and a layer of PBS were added. After further centrifugation, the layer of microglia was removed, pelleted and washed with PBS. Multiple-rat samples were created by combining tissue after homogenization and cell straining. For the blank, an empty tube was processed alongside cell-containing samples.Metabolite extraction: 500ml ice-cold methanol, chloroform and ddH2O were added sequentially to the microglia with vortexing after each addition. After centrifuging (4 min, 1100rpm, 4°C) the top layer was removed, frozen at -80°C, and lyophilized overnight.
NMR data acquisition: Samples were resuspended in 196ml of D2O + 4ml 2mg/ml TSP (minimum required to cover the MR coil region). High resolution 1H NMR data was acquired in 3mm NMR tubes on an 18.8 Tesla (800MHz) Bruker spectrometer with a TCI cryoprobe. 1H NMR spectra were acquired with a NOESYgppr1D sequence (number of points=64000, dummy scans=4, number of scans=128, water suppression manually optimized).
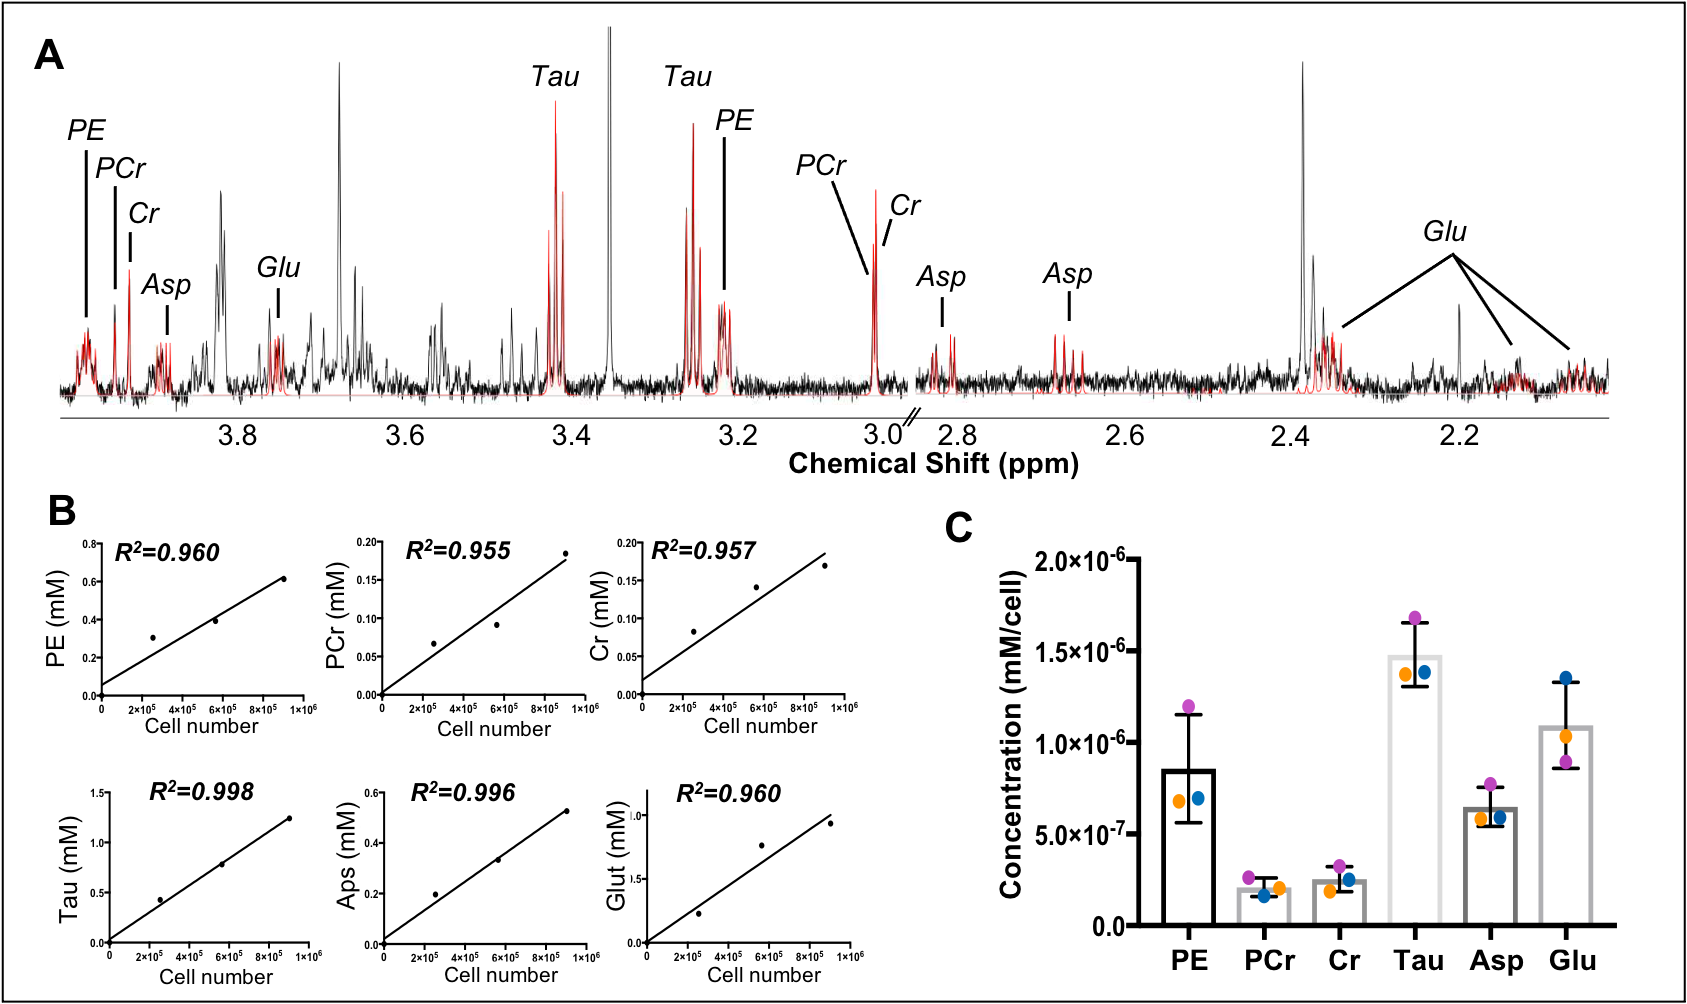
Data analysis Spectral post-processing (phasing, baseline correction, chemical shift referencing), as well as peak assignment were performed using the Chenomx software. Peaks were integrated and normalized to TSP. A simple linear regression (GraphPad Prism) shows the relationship between cell number and metabolite of interest (Figure 3B).
Results
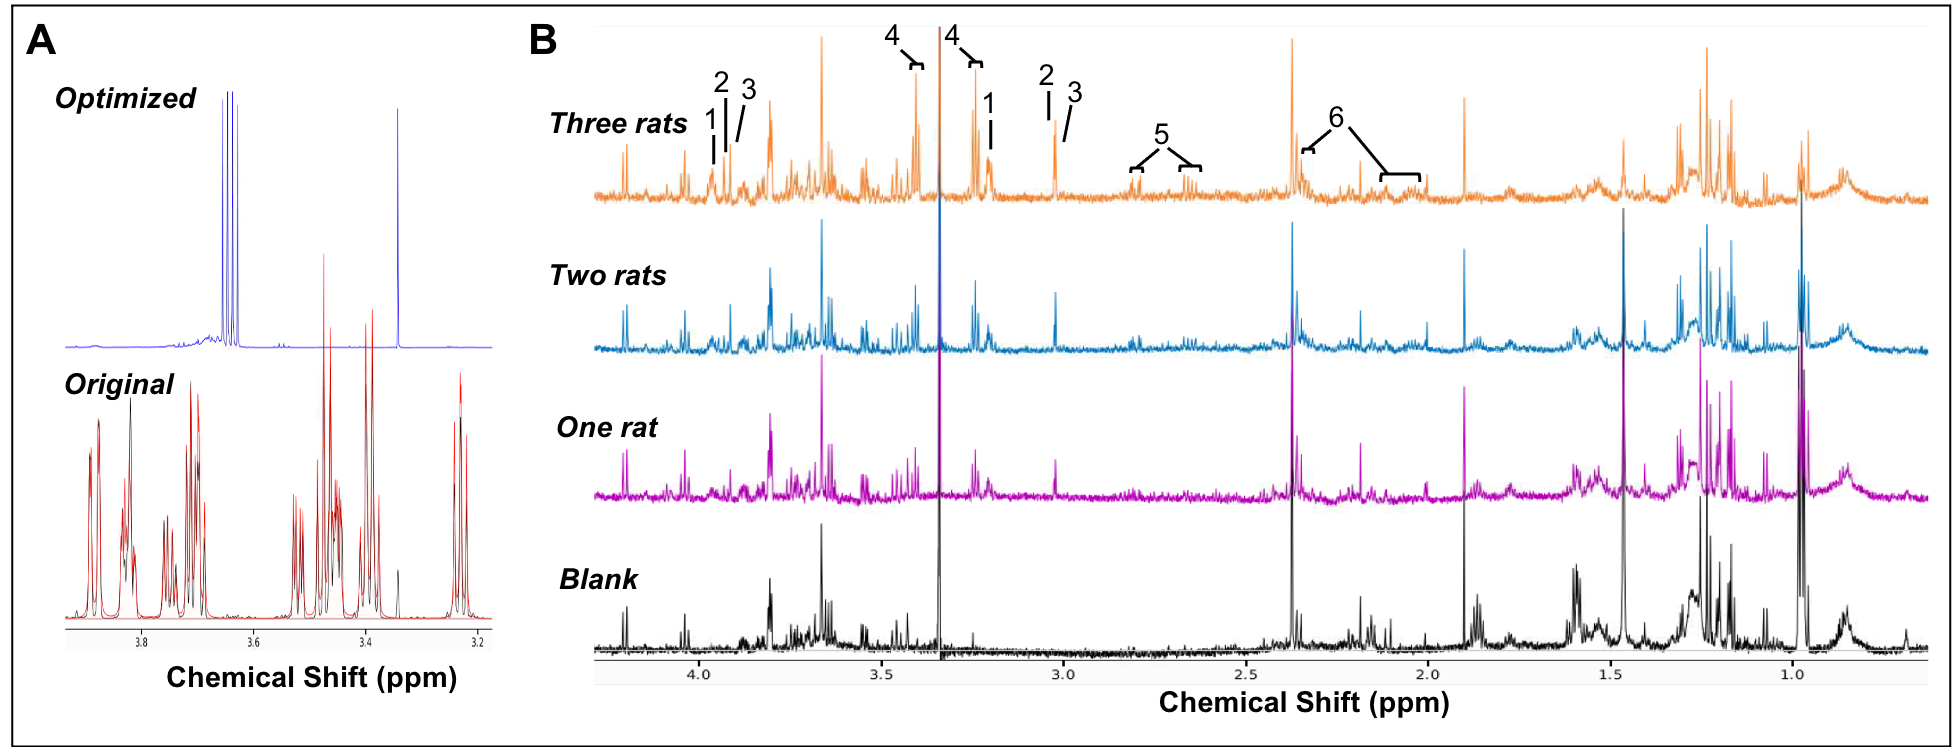
Our complete protocol is depicted in Figure 1. Our initial dataset showed large glucose resonances in the 3-4 ppm region, which covers key metabolites such as o-phosphoethanolamine, creatine phosphate, creatine and taurine (Figure 2A). On removing the glucose from the microglial isolation protocol, these peaks were no longer observed in our spectra, allowing detection of overlapping metabolites (Figure 2A). Importantly, no reduction in cell viability was seen upon glucose removal.From our no-glucose protocol, Figure 2B shows high resolution NMR spectra obtained from a blank sample, and brain microglia samples from one (254,000 cells), two (564,000 cells) and three (903,000 cells) rats. By comparing the blank to the brain samples, we identified resonances specifically originating from microglial metabolites (Figures 2B and 3A): Taurine, creatine, phosphocreatine, o-phosphoethanolamine, glutamate, and aspartate. The concentrations of these six metabolites was linearly correlated with the number of cells per sample, as seen Figure 3B (all R2 values > 0.954). Metabolite concentration per cell was calculated for all metabolites to demonstrate reproducibility between samples (Figure 3C). These averages are as follows: o-phosphoethanolamine = 8.6x10⁻⁷ ± 2.3x10⁻⁷; creatine phosphate = 2.1x10⁻⁷ ± 5.1x10⁻⁸; creatine = 2.5x10⁻⁷ ± 6.8x10⁻⁸; taurine = 1.5x10⁻⁶ ± 1.7x10⁻⁷; aspartate = 6.5x10⁻⁷ ± 1.1x10⁻⁷; glutamate = 1.1x10⁻⁶ ±2.3x10⁻⁷.
Discussion and conclusion
We have optimized a protocol for isolation of rat microglia, metabolite extraction and high resolution 1H NMR acquisition, and detected six microglia-specific metabolites that did not overlap with any resonances from the blank sample. Our method has the sensitivity to detect these metabolites in microglia from one rat whole brain, although combining brains from multiple animals improves quantification. The identified metabolites could provide valuable information on a variety of microglial metabolic pathways that are modified in disease. For example, it has recently been demonstrated that microglia can adapt to glucose deprivation by switching to glutaminolysis, so monitoring glutamate levels could be of interest3. Further, taurine has been shown to significantly decrease in cultured human microglia after morphine exposure, and might be a metabolite to monitor in pain models4.Our next steps will be to continue improving this protocol by 1) identifying the minimal solvents needed for isolation to reduce the resonances seen in blank samples, and 2) increasing replicates to apply non-supervised quantification models to these datasets. We will then assess metabolomic differences in brain microglia between rat models of diseases known to impact the brain’s immune system.Acknowledgements
This work was supported by research grants: NIH R01NS102156, NIH R01DA044934, NMSS research grant RG-1701-26630 and Dana Foundation: The David Mahoney Neuroimaging program.References
1. Li, Q. & Barres, B.A. Nat. Rev. Immunol. 18, 225–242 (2017).
2. Frank, M.G., Wieseler-Frank, J.L., Watkins, L.R. & Maier, S.F. J. Neurosci. Methods 151, 121–130 (2006).
3. Bernier, L.P. et al. Nat. Commun. 11 (2020).
4. Ghazi, I. El et al. J Neuroimmune Pharmacol 5, 574–581 (2010).
Figures