0081
Detectable velocity range in single-cell tracking by time-lapse MRI
Enrica Wilken1, Felix Freppon1, Max Masthoff1, and Cornelius Faber1
1Translational Research Imaging Center, Clinic of Radiology, University Hospital Muenster, Muenster, Germany
1Translational Research Imaging Center, Clinic of Radiology, University Hospital Muenster, Muenster, Germany
Synopsis
Repetitive T2*-weighted image acquisition in vivo and contrast simulations were used to show that single iron oxide nanoparticle labeled cells can be resolved and tracked non-invasively by time-lapse MRI. Calculation of the velocity of intravascular moving immune cells in mice brain and velocity-dependent blurring of time-lapse contrast in simulations indicate that cell dynamics slower than 1 µm/s are detectable. Therefore, time-lapse MRI is able to reveal patrolling immune cells as hypointense spots and can be a suitable tool to study inflammatory diseases and the progression of cancer metastasis.
Introduction
With growing knowledge of cell interactions and related therapeutic strategies, it becomes increasingly important to resolve single-cell dynamics.1 However, established means of cell tracking, like intravital microscopy, are invasive, have a limited tissue penetration or field of view.2 Contrarily, T2*-weighted MRI provides a non-invasive tool and several studies were able to track cell distributions or acquire static snapshots of single cells.3 Yet, the actual intravascular cell migration could not be revealed and it was the MRI time-lapse concept that allowed resolving single-cell movement in mice brain non-invasively for the first time. Movies showing single-cell motion were created by composing T2*-weighted images of repetitive MRI acquisition and whole-brain coverage enabled the analysis of three-dimensional cell motion behavior.4,5 Here, we address the velocity detection limit of time-lapse MRI by tracking iron-labeled immune cells in vivo and by simulating motion-dependent blurring of image contrast.Methods
MRI and analysis. Time-lapse MRI of female C57BL/6 mice brain (n=8) was performed using a 9.4 T Biospec (Bruker Biospin, Ettlingen, Germany) with cryogenic probe. T2*-weighted images were acquired with a gradient echo sequence with the following scan parameters: TR: 643 ms, TE: 8.0 ms, FA: 60°, averages: 4, image matrix: 180 x 256, in-plane resolution: 67 x 55 µm2, 38 slices, slice thickness: 300 µm, scan time: 8 min 12 s, 20 repetitions. Monocytes were labeled in vivo by i.v. injection of 1.9 ml per kg/BW Ferucarotran (Resovist® Bayer AG) via the tail vein 24 h prior to MRI. Further, individual immune cells were identified as hypointense spots, manually counted, and tracked with ImageJ.Simulations. MATLAB simulations of time-lapse contrast were based on simulations by Masthoff et al.4. Initially, a synthetic phantom with intensity 1 and size of 180 x 256 voxels was created and cells were added by 4 voxel signal voids at random positions. More precisely, the intensity in the central voxel was reduced to 0.5, and in two directly adjacent voxels and the one in between and diagonally neighboring the central voxel to 0.7. A diagonal in-plane movement was then simulated by stepwise in- or decreasing the position in the horizontal and vertical direction. For every frame, k space was calculated by Fourier transformation of the image. Further, synthetic k space was created by filling it with fractions of the Fourier transforms, i.e. 8 lines of every k space corresponding to 32 frames for cartesian sampling. Similarly, for a radial sampling scheme, 8 out of 256 spokes separated by the golden angle6 were used as fractions for the artificial k space. An image of the simulated moving cells was then acquired by the inverse Fourier transform of the assembled k space (Fig. 1). The image represents a single timeframe with cells moving 32 voxels during acquisition. In addition, to account for smaller velocities, cells remained in their spot and moved to the next voxel after 2, 4, 8, or 16 frames. To simulate a static cell, the signal void stayed in its position for 32 frames. Finally, an overlay of real MRI data and simulations was done by a voxelwise multiplication of the two images.
Results and Discussion
Repetitive T2*-weighted imaging allowed detection and tracking of intravascular moving monocytes in mice brain as hypointense spots in consecutive timeframes (Fig. 2a). Additionally, the motion velocity of cells moving across several voxels was determined to be 0.19 ± 0.01 µm/s from n=61 cells (Fig. 2b). Moreover, with an acquisition time of 8 mins 12 s and a resolution of 67 x 55 µm2, we simulated time-lapse contrast of moving cells with velocities of 0, 0.35, 0.70, 1.41, 2.82, and 5.64 µm/s by cartesian and radial sampling of synthetic k space (Fig. 3). The performed superposition with an actual brain MRI image does not only consider noise, distorting structures, and imaging artifacts but also enables a direct comparison of the contrast caused by in vivo labeled and simulated cells. The chosen size and intensity of the artificial cells were found to represent experimentally observed signal voids well. Further, the simulations showed that static and slowly moving cells are clearly visible for both, cartesian and radial, sampling schemes. However, with increasing speed of cell migration, contrast becomes blurred and is not sufficiently generated for single-cell detection when cells move faster than 1 µm/s.We conclude that time-lapse MRI can resolve iron-labeled single-cell motion slower than 1 µm/s. Since the calculated mean velocity of moving monocytes lies perfectly in range with the speed of patrolling immune cells (0.2 µm/s)7, we suppose that time-lapse MRI can track the patrolling motion behavior, but not rolling cells as these are linked to higher velocities (40 µm/s)2,7.
Conclusion
We have shown that time-lapse MRI enables the detection of intravascular dynamics of iron-labeled cells in mice brain. Since only slow motion (<1 µm/s) creates a sufficient contrast and faster moving cells are not yet distinguishable from tissue, we aim at accelerating image acquisition by less averaging, compressed sensing, and radial sampling in the future. Therefore, we hope to track not only patrolling but rolling monocytes as well. We understand time-lapse MRI as being a non-invasive tool to further study immune responses under inflammatory stimuli and cancer progression.Acknowledgements
This study was supported by the German Research Foundation (DFG; SFB 1009 TP-Z02 to CF), the Joachim Herz Foundation (Add-on Fellowship for Interdisciplinary Life Sciences to MM), the Interdisciplinary Centre for Clinical Research (IZKF, core unit PIX) and the Medical Faculty of the University of Muenster (MEDK dissertation fellowship to FF).References
- Perrin J, Capitao M, Mougin-Degraef M, et al. Cell Tracking in Cancer Immunotherapy. Front Med (Lausanne). 2020;7:34. Published 2020 Feb 14. doi:10.3389/fmed.2020.00034
- Karreman MA, Hyenne V, Schwab Y, Goetz JG. Intravital Correlative Microscopy: Imaging Life at the Nanoscale. Trends Cell Biol. 2016;26(11):848-863. doi:10.1016/j.tcb.2016.07.003
- Shapiro EM, Sharer K, Skrtic S, Koretsky AP. In vivo detection of single cells by MRI. Magn Reson Med. 2006;55(2):242-249. doi:10.1002/mrm.20718
- Masthoff M, Gran S, Zhang X, et al. Temporal window for detection of inflammatory disease using dynamic cell tracking with time-lapse MRI. Sci Rep. 2018;8(1):9563. Published 2018 Jun 22. doi:10.1038/s41598-018-27879-z
- Mori Y, Chen T, Fujisawa T, et al. From cartoon to real time MRI: in vivo monitoring of phagocyte migration in mouse brain. Sci Rep. 2014;4:6997. Published 2014 Nov 11. doi:10.1038/srep06997
- Winkelmann S, Schaeffter T, Koehler T, Eggers H, Doessel O. An optimal radial profile order based on the Golden Ratio for time-resolved MRI. IEEE Trans Med Imaging. 2007;26(1):68-76. doi:10.1109/TMI.2006.885337
- Auffray C, Fogg D, Garfa M, et al. Monitoring of blood vessels and tissues by a population of monocytes with
patrolling behavior. Science. 2007;317(5838):666-670.
doi:10.1126/science.1142883
Figures
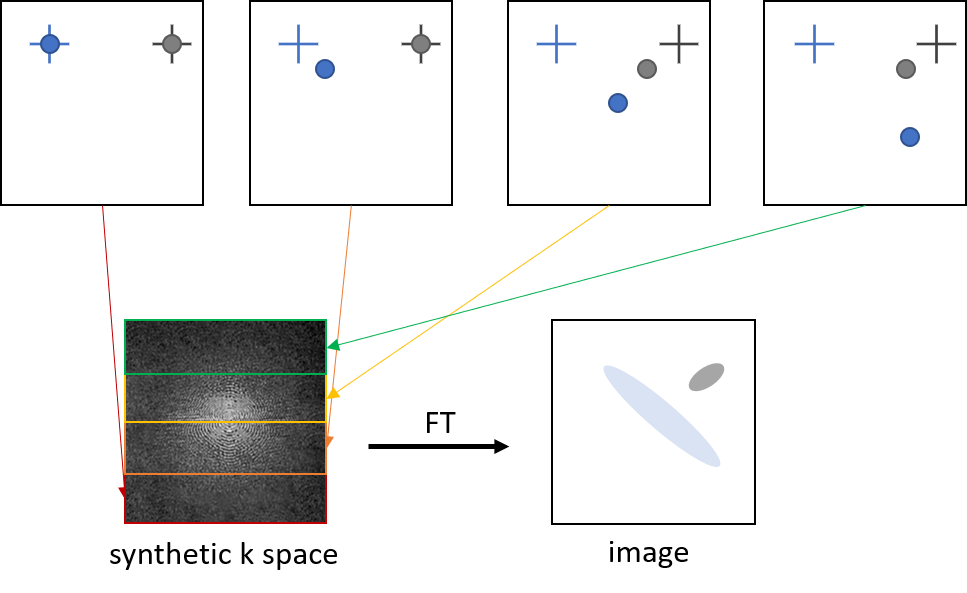
Figure 1: Principle of how image contrast of moving cells
with different velocities is simulated by creating synthetic k space.
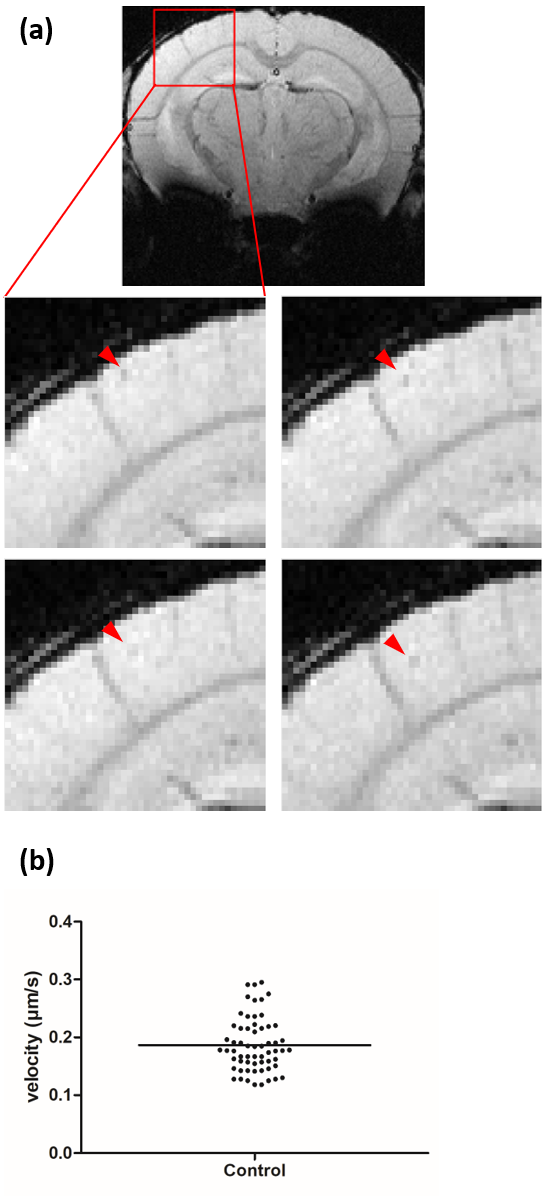
Figure 2: In vivo detected cells in motion. (a) Image
details, indicated by the red rectangle in a representative example of one
slice from a mouse brain, of four sequential timeframes show that moving cells
can be identified as hypointense spots (red arrowhead). (b) A mean velocity of 0.19 ± 0.01 µm/s of monocytes
moving across several pixels in consecutive timeframes was calculated.
Individual values are indicated by closed circles, mean value by horizontal
bar.
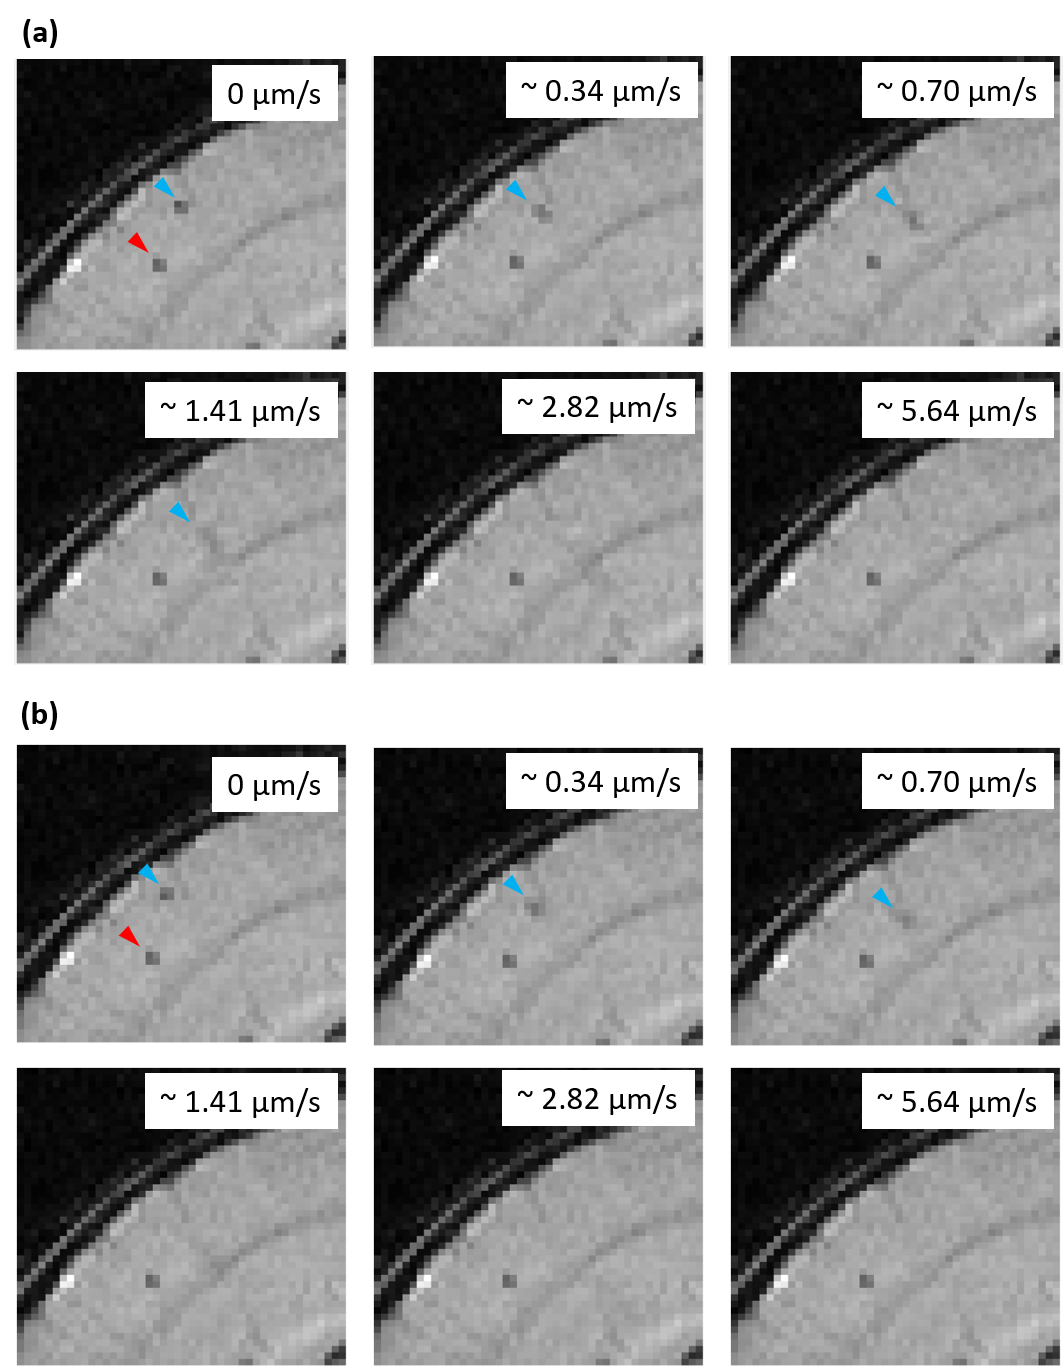
Figure 3: Image sections of an overlay of a T2*-weighted
image obtained by the time-lapse MRI protocol and the contrast simulation for
different cell motion velocities, showing a real (red arrowhead) and a
simulated (blue arrowhead) cell in the brain cortex. Simulations used a (a)
cartesian and (b) radial sampling scheme.