0079
A Mn-based probe targeted towards organic-anion transporting polypeptides
Nivin N Nyström1, Hanlin Liu2, Francisco Martínez-Santiesteban1, Xiao-an Zhang2, Timothy J Scholl1, and John A Ronald1
1Robarts Research Institute, London, ON, Canada, 2University of Toronto, Toronto, ON, Canada
1Robarts Research Institute, London, ON, Canada, 2University of Toronto, Toronto, ON, Canada
Synopsis
We have developed a manganese(III) porphyrin probe for targeted imaging of cells expressing organic-anion transporting polypeptides. OATP1 targeting and relaxation characteristics were evaluated in vitro in engineered cells, and in vivo and ex vivo in different organs in mice.
Introduction
Targeted molecular imaging agents are useful tools to understand protein expression patterns and molecular mechanisms of disease. For example, the clinical MRI agent gadolinium ethoxybenzyl diethylenetriamine pentaacetic acid (Gd-EOB-DTPA) is used to image human liver cancer via its selective uptake primarily by OATP1B3 transport into healthy hepatocytes, but not liver cancer cells [1]. Gd-EOB-DTPA has additionally been established as a sensitive probe for cells engineered to express rat OATP1A1 or human OATP1B3, allowing for in vivo MRI tracking of these cells [2,3,4]. However, Gd is associated with nephrogenic systemic fibrosis in patients with renal disease, and Gd deposition has been found in the central nervous system, leading to increased efforts towards development and use of Gd-free agents [5]. Manganese(III) porphyrin constructs offer a safe, sensitive, and versatile platform for molecular MRI, but little work has been performed to target these agents towards specific biomarkers [6]. We hypothesize that addition of a phenyloxyethyl (PhOEt) group to manganese(III) porphyrin would facilitate its uptake by cells expressing OATP1A1 and OATP1B3 transporters.Methods
Manganese(III) 5-ethoxybenzyl-10, 15, 20-tri(carboxyl) porphyrin (MnTriCP-PhOEt) was synthesized (Figure 1). UV-vis spectra at λ ∈ (300, 700) nm for MnTriCP-PhOEt and its precursors, and nuclear magnetic relaxation dispersion (NMRD) profiles at B0 ∈ (0, 1) T, 1 mM, 37.0°C for MnTriCP-PhOEt, Gd-EOB-DTPA and Gd-DTPA were acquired. Spin-lattice relaxation rates (R1) of 1 mM solutions were also measured at 1.5T and 3T (Figure 2). Next, cell lines (rat C6, human MDA-MB-231) were transduced with lentivirus to express rat Oatp1a1 and human Oatp1b3, respectively (Figure 3). Non-transduced control and transduced cells were each incubated with 1 mM MnTriCP-PhOEt, Gd-EOB-DTPA or Gd-DTPA for 60 minutes, washed, and R1 relaxation rates of cell pellets were measured at 3T. Mice were administered 0.025 mmol/kg MnTriCP-PhOEt (n=3) via intraperitoneal injection and T1-weighted imaging was performed at 3T for 60 minutes (Figure 4, Figure 5). An additional set of mice received intraperitoneal injections of 0.025 mmol/kg MnTriCP-PhOEt or an equivalent volume of saline (n=3), were sacrificed 44 minutes post-injection, and organs were harvested for relaxometry at B0 ∈ (0.01, 1) T, 37.0°C.Results
MnTriCP-PhOEt exhibited increased R1 rates relative to Gd-EOB-DTPA at B0 > 0.1005 T (Figure 2B). The R1 rate of MnTriCP-PhOEt was 1.38-fold greater than Gd-EOB-DTPA at 1.5T (Figure 2B). At 3T, MnTriCP-PhOEt exhibited an increased R1 rate (10.55 ± 0.4151 Hz) relative to Gd-EOB-DTPA (8.327 ± 0.3745 Hz) and Gd-DTPA (6.295 ± 0.3902 Hz) (Figure 2C). None of the transporter-expressing cells incubated with Gd-DTPA exhibited increased R1 rates relative to treated control cells (Figure 3E, 3F). Oatp1a1- and Oatp1b3-expressing cells exhibited significantly increased R1 rates following incubation with Gd-EOB-DTPA (2.082 ± 0.125, 1.548 ± 0.113 Hz), relative to controls not expressing these transporters (0.6933 ± 0.1329 Hz). Oatp1a1- and Oatp1b3-expressing cells also exhibited significantly increased R1 rates following MnTriCP-PhOEt incubation (2.457 ± 0.198, 2.087 ± 0.132 Hz, respectively), relative to treated control cells (0.7675 ± 0.1466 Hz) (Figure 3E, 3F). Importantly, our data show increased R1 values for transporter-expressing cells treated with MnTriCP-PhOEt, relative to the same cells treated with an equivalent concentration of Gd-EOB-DTPA, consistent with each agent’s relaxivity. Mice imaged in vivo exhibited liver uptake of MnTriCP-PhOEt over time, averaging a maximum 1.914-fold significant increase in liver signal intensity at 3T after a 0.025 mmol/kg dose, relative to pre-contrast images (n=3, p<0.05) (Figure 4A, 4B, 4C). When T1 times of ex vivo organs were measured via relaxometry, liver tissue from mice administered 0.025 mmol/kg MnTriCP-PhOEt demonstrated significantly smaller T1 times at field strengths above 0.3057 T, relative to liver tissue from mice administered saline (n=3, p<0.05), whereas no significant differences were observed in T1 times of kidney and muscle tissue (Figure 4D, 4E).Discussion
The manganese(III) porphyrin platform has much to offer for the field of molecular MR. Importantly, the planar geometry of the porphyrin construct allows for water coordination both above and below the plane of the molecule (q=2), thereby increasing its relaxivity relative to comparable constructs with access to only one water hydration site (Figure 1B, Figure 2B, Figure 2C). Further, the porphyrin offers four locations onto which different functional groups may be added to alter important properties such as circulation half-life and ligand activity. In this study, we show that molecular modification of manganese(III) porphyrin via addition of a PhOEt functional group enables transportation of this agent into cells through OATP1A1 and OATP1B3 transporters, with resultant relaxivities greater than cells treated with equivalent concentrations of Gd-EOB-DTPA. In animals, when 0.025 mmol/kg MnTriCP-PhOEt was administered, significant signal enhancement and T1 shortening of liver tissue were observed, whereas previous manganese(III) porphyrin contrast agents were reported to be largely cleared through the kidneys [7]. Altogether, our research poses the possibility of replacing Gd-EOB-DTPA with MnTriCP-PhOEt, which exhibits a higher relaxivity at clinical field strengths for diagnostic purposes, and may be especially useful for patients with impaired renal function in which Gd-based contrast agents may be contraindicated. Future work will be focused on performing quantitative kinetic imaging to maximize MnTriCP-PhOEt detection at low doses in vivo.Acknowledgements
No acknowledgement found.References
[1] Hamm et al. 1995 Radiol [2] Patrick et al. 2014 PNAS [3] Nyström et al. 2019 Invest Radiol [4] Nyström et al. 2019 Radiol Img Cancer [5] Rogosnitzky and Branch 2016 Biometals [6] Haedicke et al. 2016 Chem Sci [7] Chang et al. 2013 JMRI.
Figures
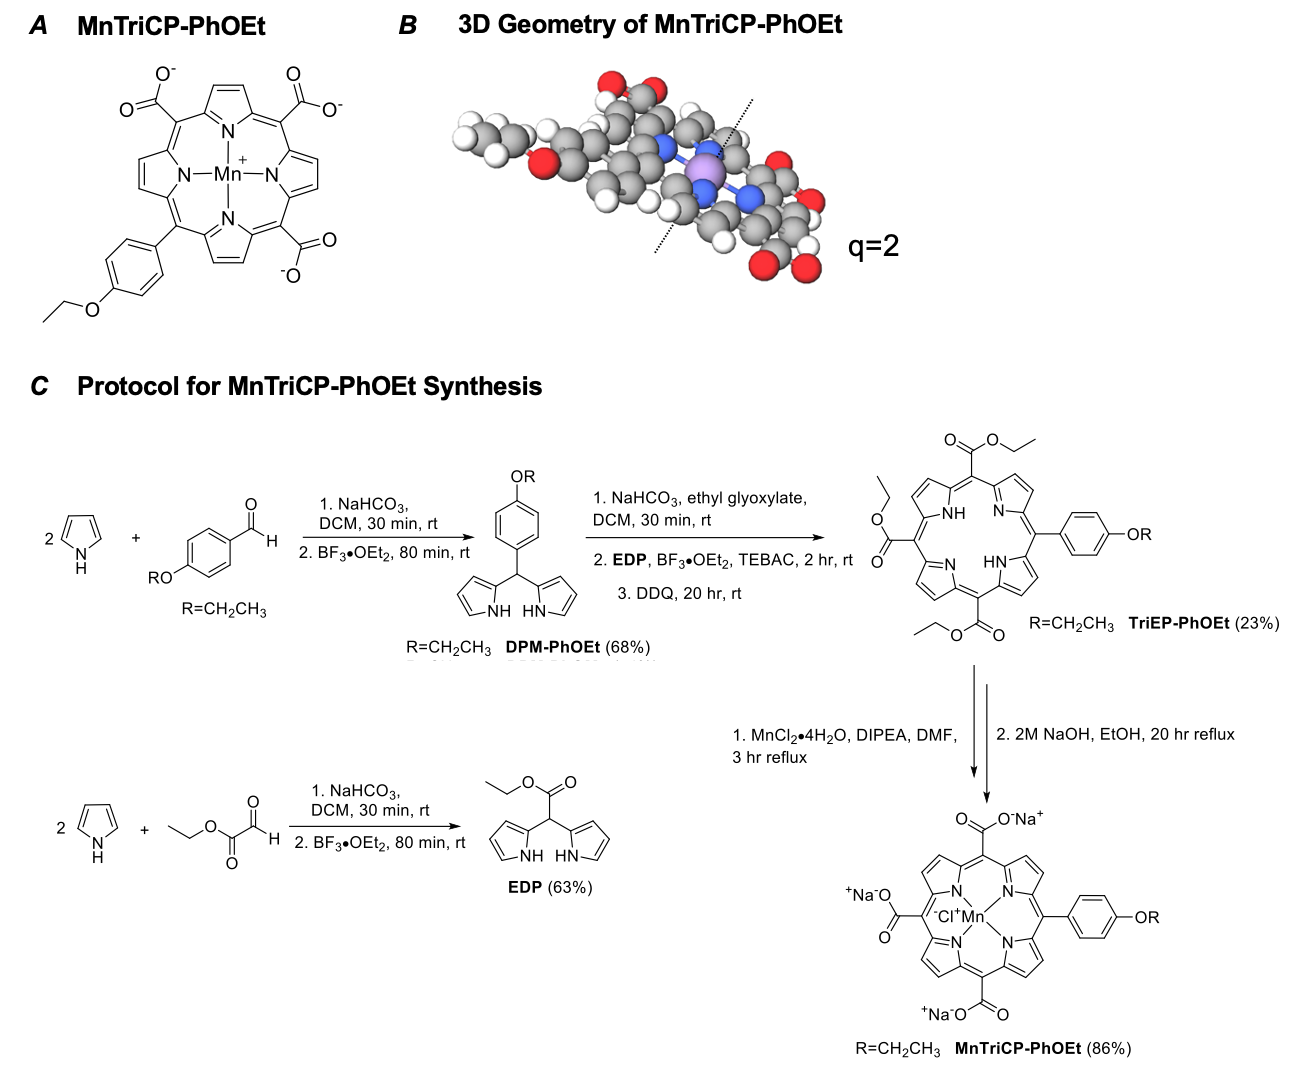
MnTriCP-PhOEt Structure and Synthesis. a) Molecular structure of MnTriCP-PhOEt. b) 3-dimensional geometry of MnTriCP-PhOEt. q, hydration number. c) Synthesis and yield of MnTriCP-PhOEt. Yields shown in brackets.
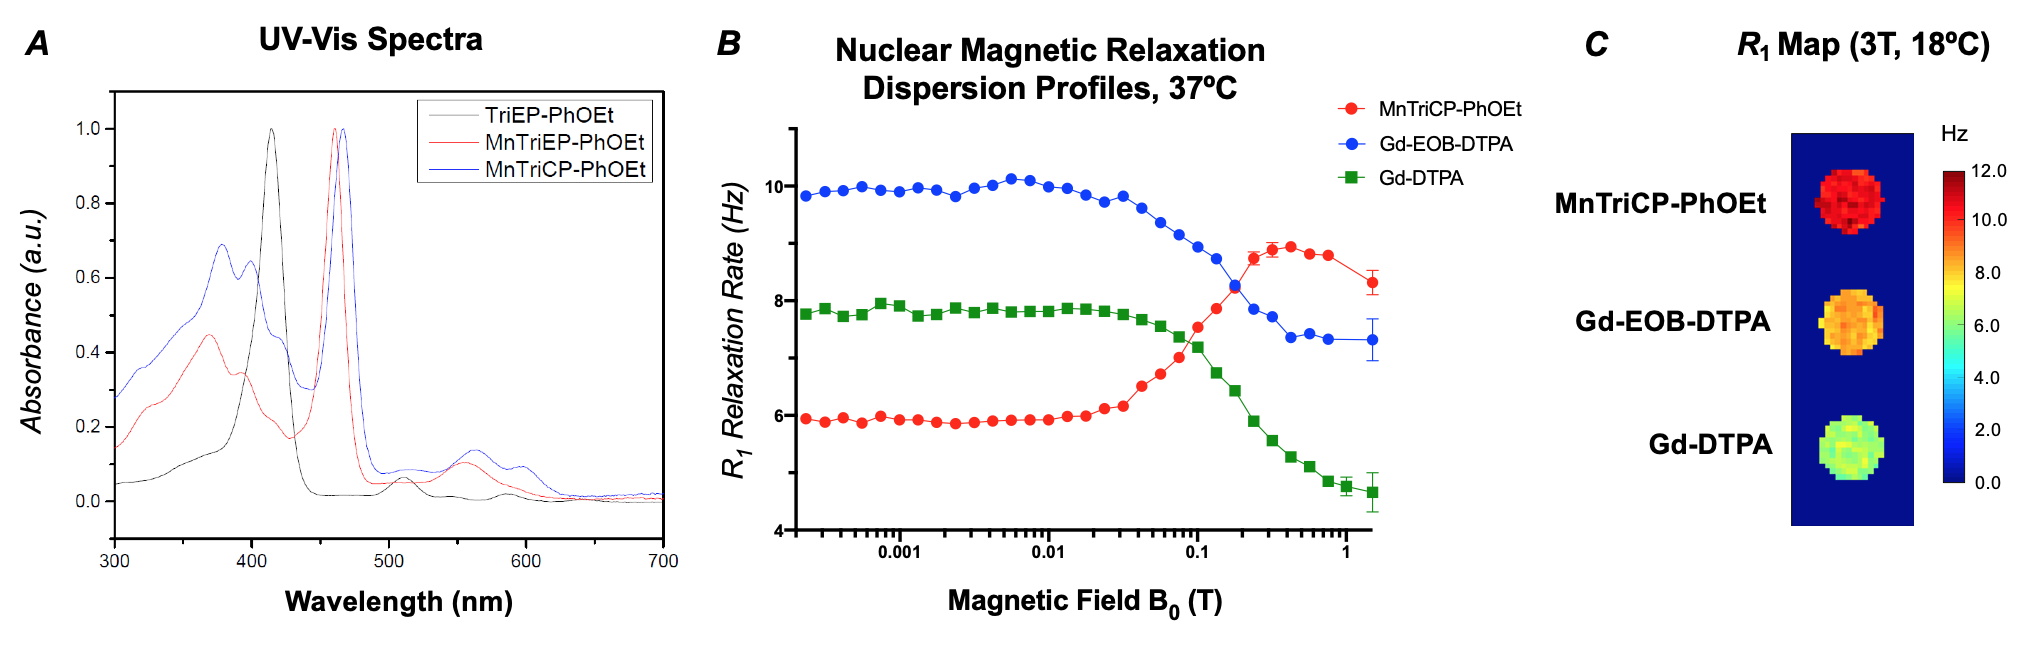
Optic and Magnetic Properties of MnTriCP-PhOEt. a) UV-vis spectra of MnTriCP-PhOEt, and its immediate precursors. b) Nuclear magnetic relaxation dispersion profiles of 1 mM solutions of MnTriCP-PhOEt, Gd-EOB-DTPA, and Gd-DTPA. c) Spin-lattice relaxation maps of 1 mM solutions of MnTriCP-PhOEt, Gd-EOB-DTPA, and Gd-DTPA at 3 Tesla.
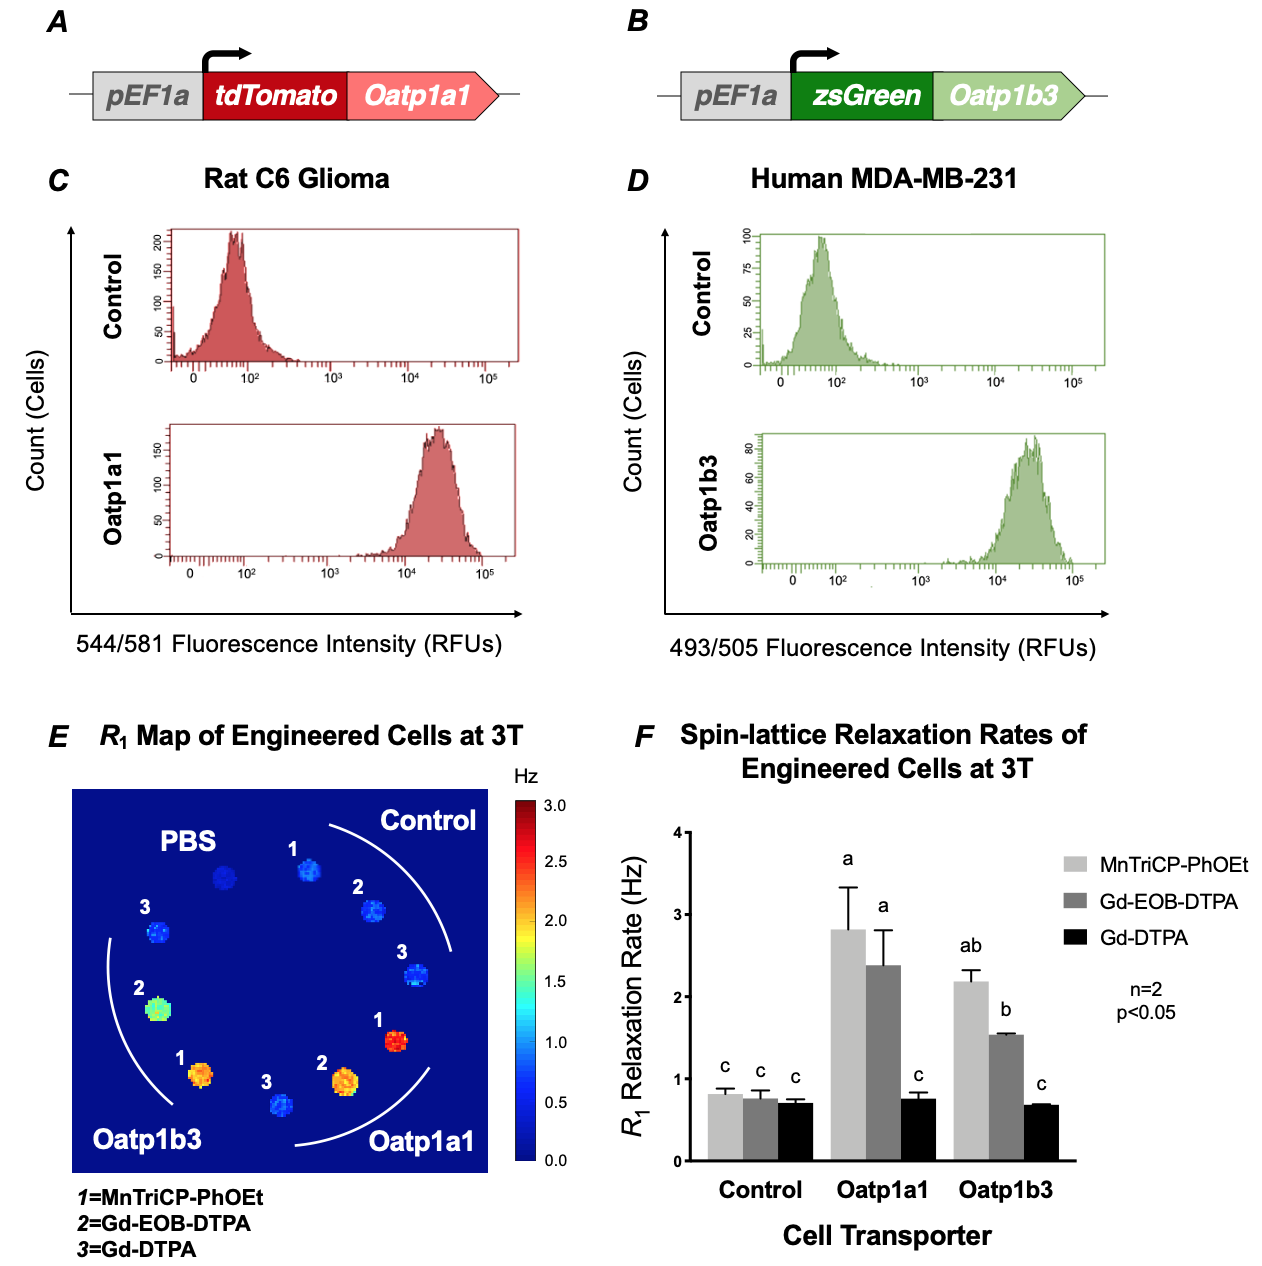
In Vitro Uptake of MnTriCP-PhOEt by Oatp1 Transporters. a) Genetic construct of rat Oatp1a1 for engineering of rat C6 cells. b) Genetic construct of human Oatp1b3 for engineering of human MDA-MB-231 cells. c) Flow cytometry of C6 cells after sorting for tdTomato fluorescence. d) Flow cytometry of MDA-MB-231 cells after sorting for zsGreen fluorescence. e) Spin-lattice relaxation map of cells at 3 Tesla following a 60-minute incubation with 1 mM of either MnTriCP-PhOEt, Gd-EOB-DTPA, or Gd-DTPA and subsequent washing. f) Spin-lattice relaxation rates of cells at 3 Tesla.
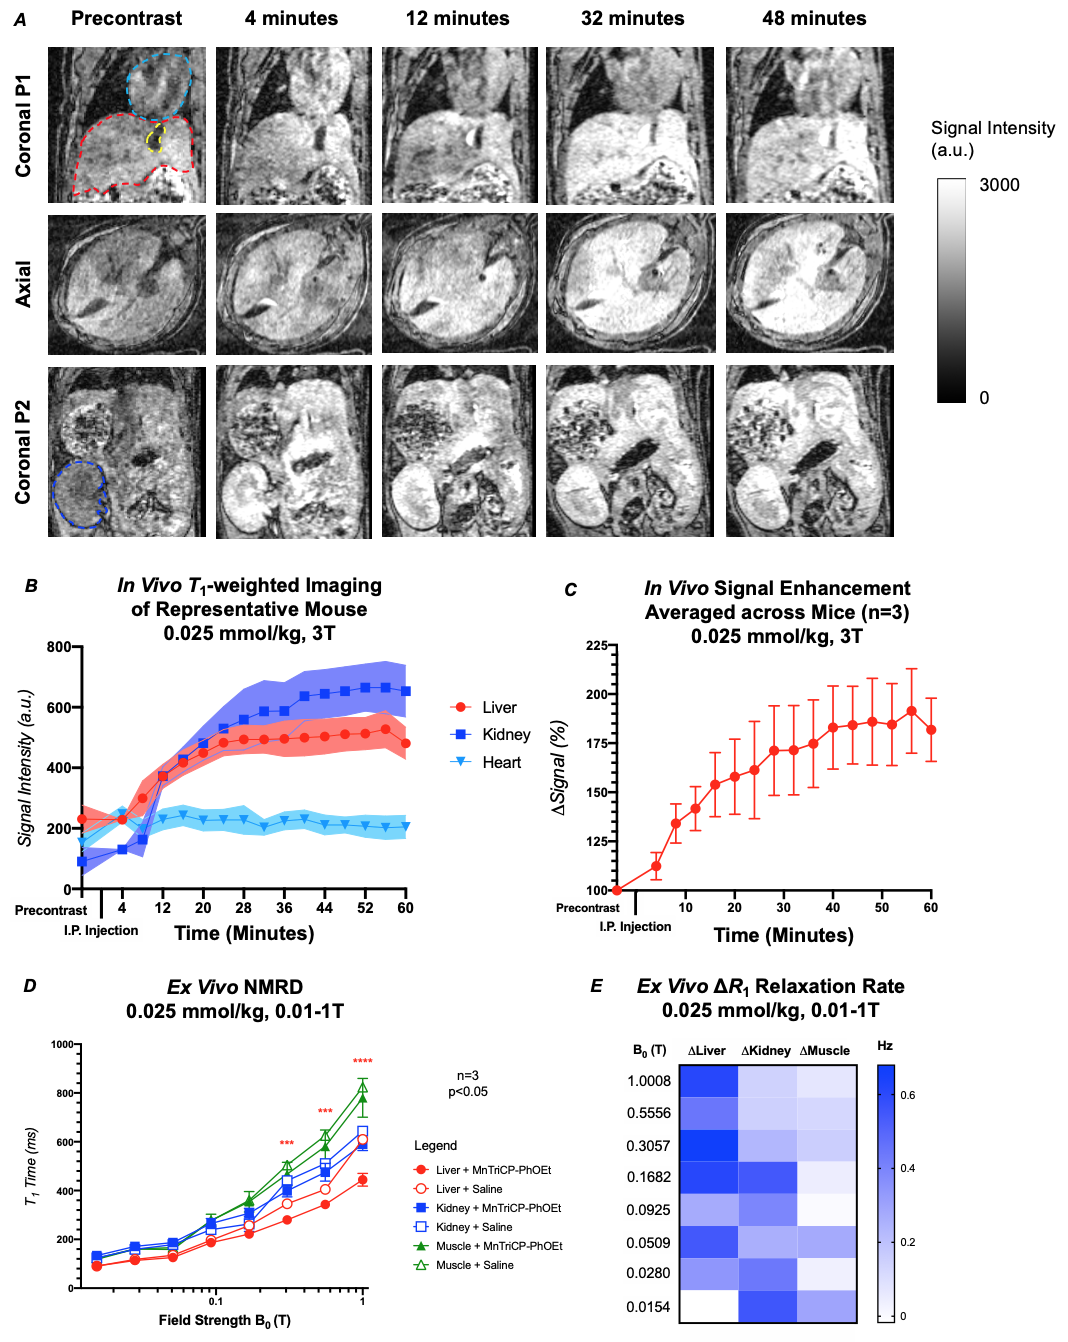
Liver Uptake of MnTriCP-PhOEt at 3 Tesla. a) T1-weighted images of a representative mouse before and up to 60 minutes post intraperitoneal injection of 0.025 mmol/kg MnTriCP-PhOEt. b) In vivo signal intensity of various organs over time of a representative mouse. c) Average in vivo signal enhancement of liver (n=3). d) Ex vivo nuclear magnetic relaxation dispersion (NMRD) profiles of various tissues 44 minutes post injection. e) Differences in spin-lattice relaxation rates of various tissues between mice injected 0.025 mmol/kg MnTriCP-PhOEt or saline, 44 minutes post injection.