0076
In vivo methemoglobin modulation as an intravascular contrast agent for magnetic resonance imaging: Rabbit Model with T1 measurement1UCAIR, Department of Radiology and Imaging Sciences, University of Utah, Salt Lake City, UT, United States, 2Department of Pediatrics, University of Utah, Salt Lake City, UT, United States
Synopsis
After intravenous injection, gadolinium(GBCA), commonly used for MR contrast, distributes from intravascular to the extravascular space and rapidly cleaned by renal excretion. This pharmacologic behavior makes GBCA unfavorable as in blood pool agent. One potential alternative agent is endogenous intracellular methemoglobin (MetHb), a paramagnetic molecule in our blood cells. Intracellular levels of MetHb can be increased by exposing blood to sodium nitrite. We evaluated change of T1 of blood according to a transient increase in intracellular MetHb in in vivo animal model. Our results demonstrated that MetHb modulation resulted T1 shortening of blood and soft tissue enhancement.
INTRODUCTION
Gadolinium utilize T1 and T2* shortening effects to create tissue better contrast1. However, after intravenous injection, GBCA distributes from the intravascular to the extravascular space and is rapidly cleaned from the body by renal excretion2,3. This pharmacologic behavior makes GBCA unfavorable as an agent in blood pool analysis. Blood pool agents (BPAs) are contrast agents developed to remain intravascular with a long blood half-life4. One potential alternative agent is endogenous intracellular methemoglobin (MetHb)5, a paramagnetic molecule that is normally present in small amounts in our blood cells3. Intracellular levels of MetHb can be increased by sodium nitrite(SN)6. Previous in vitro studies suggest that an intracellular MetHb level less than 10% sufficiently increases the T1-weighted signal of blood to be an effective contrast agent5,7. In this work, we investigated methemoglobin modulation in vivo as a potential intravascular contrast agent by using MRI studies of SN treated animal models.METHODS
All of MRI studies were performed on a 3T MRI system. We first performed T1 measurements of in vitro cow blood treated with different concentrations of SN to find the optimal dose of intravenous SN as an intravascular contrast. T1 measurement data was acquired by using turbo spin echo(TSE) with inversion recovery preparation. Imaging parameters were: TR/TE = 8000/7.3ms, TI = 50, 100, 300, 500, 1000,1500, 2500, 5000, 7500ms, in-plane resolution = 0.5×0.5mm2, and slice thickness=2.0 mm. Prior to study initiation, the animal use protocol was approved by IACUC. Pathogen-free four white New Zealand rabbits were treated with 30 mg intravenous dose of SN for MetHb modulation. The levels of oxyhemoglobin, carboxyhemoglobin and MetHb in blood were monitored by pulse oximetry. 3D TOF and 3D MPRAGE images were acquired before (baseline) and after (t=20 mins) treatment. T1 measurement data was obtained at baseline and after SN injection using 2D ss-EPI with IR prep8 with TE/TR=38/115ms, TI=5, 120, 240, 480, 960,1560, 2520, 4080, 6600, 16080ms, FOV=120x120 mm, and 128 EPI factors. Baseline data was acquired with an oxygen saturation measurement of 100%, or a methemoglobin level near 0%. After the rabbit was treated with 30 mg SN and T1 data acquisition was repeated until 40 minutes later. T1 maps were calculated by fitting the signal recovery curve and displayed using homemade software.RESULTS
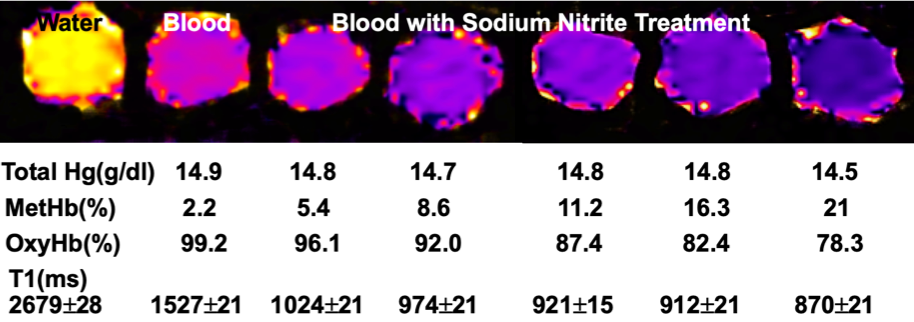
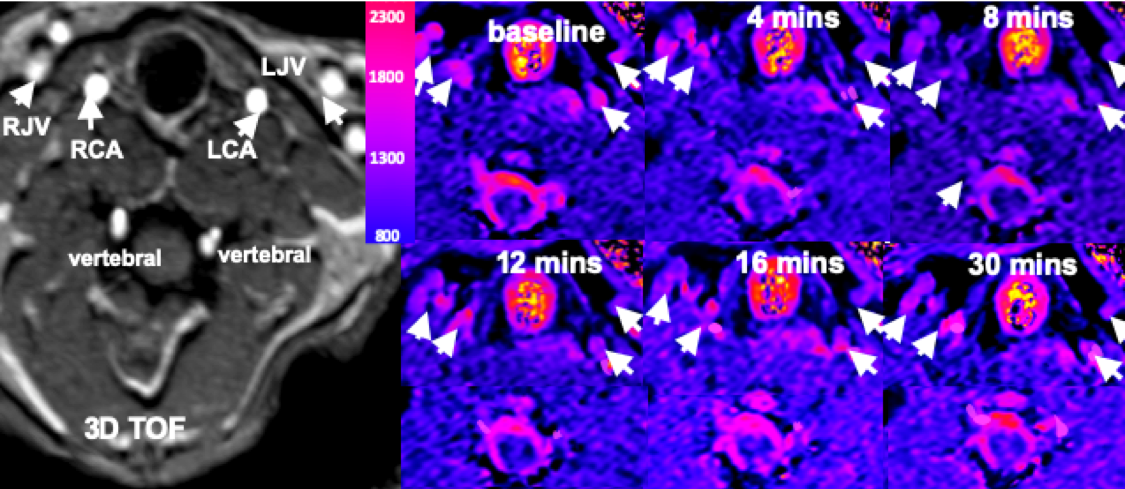
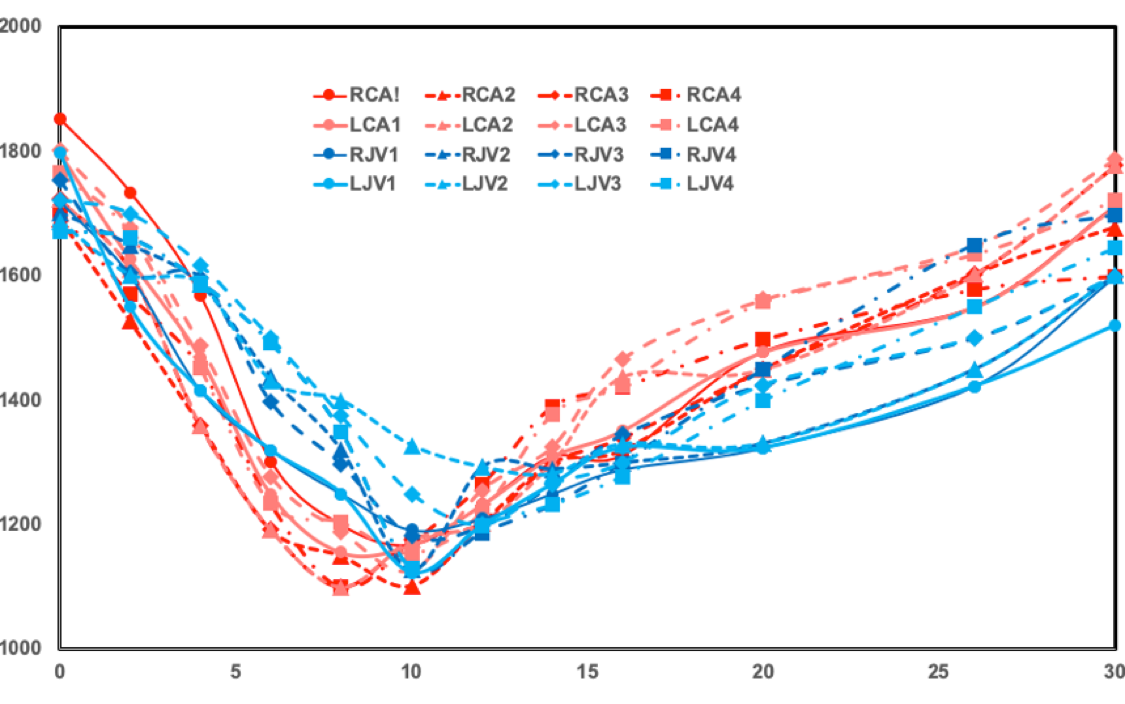
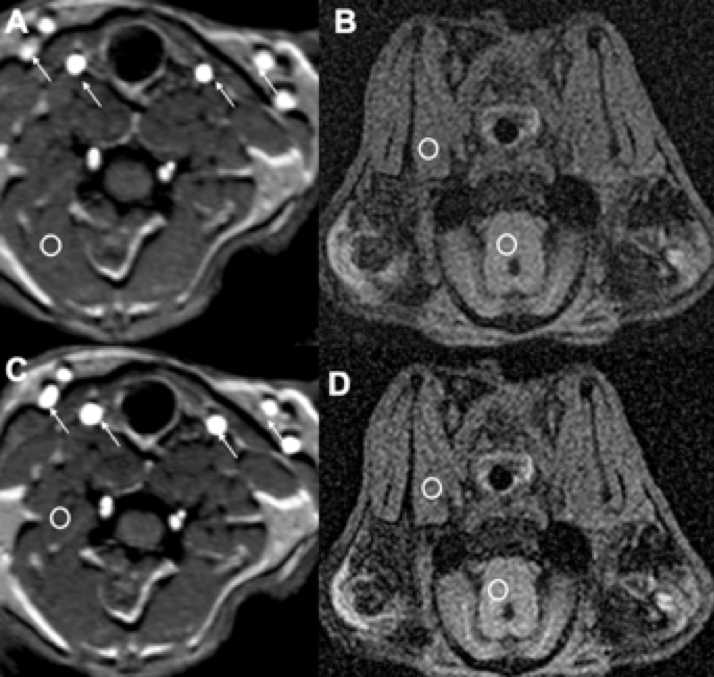
Fig 1 shows results from in vitro MetHb modulation by SN treatment. The mean level of MetHb prior to SN treatment was 2.2%. The range of MetHb levels was 2.2% to 21% after each tube was treated with different concentration of SN. The T1 value of blood with 21% of MetHb level (870±21ms) declined by 48% of baseline value (1527±21 ms). Fig 2 shows dynamic T1 maps of in vivo MetHb modulation by using SN treatment from one rabbit study. 3D TOF image shows the anatomic location of right/left carotid artery (RCA/LCA), external jugular vein (RJV/LJV), and vertebral artery or vein. Before SN treatment, mean T1 on RCA and RJV were 1692112 and 1702±98 ms, respectively. After 8 minutes from SN injection, T1 on RCA and RJV were decreased to 1150±82 and 1292±86 ms, respectively. The dynamic T1 changes of in vivo MetHb modulation from four rabbit studies were plotted on the Fig 3. The time to reach the minimum T1 relaxation time for carotid artery (RCA/LCA) and vein(RJV/LJV) were 8 to 10mins and 10 to 12 mins from SN injection time, respectively. MetHb modulation after SN injection significantly decreased T1 of arterial blood by the maximum 39.52%. T1 of venous blood was decreased by up to 37.57%. Fig 4 shows example images of TOF(A,C) and MPRAGE(B,D) at baseline(A,B) and 20 mins later from SN injection(C,D). On 3D-TOF, visible blood signal changes were in CA and JA. There was a significant difference in carotid arterial blood signal. RCA blood signal change on rabbit 2 was 1.47±0.12-fold, right jugular vein signal change was 1.65±0.08-fold.DISCUSSION
This study was the first to demonstrate in vivo MetHb modulation can create T1 relaxation time changes on blood. In our in vitro study, there was a noticeable T1 change depending on the levels of MetHb on the blood. Our rabbit study demonstrated that the elevation of MetHb level reduced T1 of blood up to 39.52% and 27.57% at artery and vein, respectively. We observed that there was a time difference between artery and vein to reach the maximum T1 enhancement via MetHb modulation. Therefore, T1 relaxation time can be used to assess the localization and amount of MetHb level directly and with high sensitivity. The FDA has approved sodium nitrite for cyanide poisoning. However, MetHb decreases the oxygen carrying capacity of blood. As a result, high levels of intracellular MetHb are not safe for individuals who cannot tolerate a transient decrease in oxygen9. Therefore, we need to investigate the safety and efficacy of a transiently induced increase in intracellular MetHb. We also need to further characterize time course of T1 change and to determine location of T1 signal changes on venous vs. arterial or intravascular vs. extravascular.CONCLUSION
Methemoglobinemia modulated from sodium nitrite has a great potential for an alternative intravenous contrast agent.Acknowledgements
Sponsored by University of Utah Program in Personalized Health and National Center for Advancing Translational Sciences of the National Institutes of Health under Award Number 1UL1TR002538.References
1. Jeong Y, Hwang HS, Na K. Theranostics and contrast agents for magnetic resonance imaging. Biomater Res. 2018;22(1)
2. Stojanov D, Aracki-Trenkic A, Benedeto-Stojanov D. Gadolinium deposition within the dentate nucleus and globus pallidus after repeated administrations of gadolinium-based contrast agents—current status. Neuroradiology. 2016;58(5):433-441.
3. FDA Drug Safety Podcast: FDA warns that gadolinium-based contrast agents (GBCAs) are retained in the body; requires new class warnings | FDA. https://www.fda.gov/drugs/fda-drug-safety-podcasts/fda-drug-safety-podcast-fda-warns-gadolinium-based-contrast-agents-gbcas-are-retained-body-requires.
4. Mohs AM, Nguyen T, Jeong EK, et al. Modification of Gd-DTPA cystine copolymers with PEG-1000 optimizes pharmacokinetics and tissue retention for magnetic resonance angiography. Magn Reson Med. 2007;58(1):110-118.
5. Day RW, Day RW, White KS, et al. Nitric oxide increases the signal intensity of the T1-weighted magnetic resonance image of blood. J Cardiovasc Magn Reson. 2005;7(4):667-669.
6. Wright RO, Lewander WJ, Woolf AD. Methemoglobinemia: etiology, pharmacology, and clinical management. Ann Emerg Med. 1999;34(5):646-656
7. Jaffey JA, Harmon MR, Villani NA, et al. Long-term Treatment with Methylene Blue in a Dog with Hereditary Methemoglobinemia Caused by Cytochrome b5 Reductase Deficiency. J Vet Intern Med. 2017;31(6):1860-1865.
8. Guo JY, Kim SE, Zhang L, et al. Improved accuracy and consistency in T1 measurement of flowing blood by using inversion recovery GE-EPIMed Phys, 2005:32(4), 1083-93.
9. Thunberg CA, Morozowich ST, Ramakrishnaet H, Inhaled therapy for the management of perioperative pulmonary hypertension. Ann Card Anaesth. 2015 Jul-Sep; 18(3): 394–402.
Figures