0075
Multimodal MRI study of multiple sclerosis: the therapeutic role of complement system1Centre for Advanced imaging, University of Queensland, Brisbane, Australia, 2Ministry of Education, Riyadh, Saudi Arabia, 3Faculty of Medicine, School of Biomedical Sciences, University of Queensland, Brisbane, Australia, 4National Imaging Facility, Brisbane, Australia
Synopsis
Multiple sclerosis (MS) is an autoimmune disease with uncertain
aetiology. In this work, we used two genetically modified mice, each derived by
gene ablation to complement protein C5aR1 and C5L2 receptors, designed to
investigate their roles in mediating the disease model experimental autoimmune
encephalomyelitis (EAE). MR spectroscopy and DTI were measured using a 9.4T MRI
with cryoprobe at the level of lumbar spinal cord. Changes in metabolites and DTI
parameters indicate that the ablation of C5L2, to a greater extent than the ablation of C5aR1,
made these mice less susceptible to EAE induced neuronal damage compared to
wild-type mice.
Introduction
MS is a neuro-autoimmune disease that attacks the myelin of grey matter (GM) and white matter (WM) in the central nervous system (CNS). Through MRS, the disease is characterised by an increase in the concentration of myo-inositol (m-Ins) and choline (Cho), whereas N-acetyl-aspartate (NAA) decreases (1, 2). Until now, metabolic changes in the lumbar region of the spinal cord has not been investigated in any animal model of MS. DTI measures in MS usually show a decrease in fractional anisotropy (FA) and an increase in radial diffusivity (RD) in WM (3). In GM, changes are not usually observed by DTI. The complement system, an integral part of the innate immune system has been associated with pathological mechanisms of various neurodegenerative diseases including MS (4). However, the exact pathological role of complement proteins, particularly C5aR1 and C5L2, is largely unknown. This project aims to use MRS and DTI to: (i) monitor pathological changes in the CNS (lumbar spinal cord) of C57BL/6 mice following chronic-progressive EAE disease induction, and (ii) to identify whether or not genetic ablation of C5aR1 (C5aR1KO) or C5L2 (C5L2KO) would alter EAE disease progression. The outcome of this study will underline the mechanisms within the complement system that can potentially be targeted for the treatment of MS.Methods
Animals61 (C57BL6/J) female mice aged between 12-16 weeks were used in this experiment and divided into four groups: control WT-naïve (n=13), WT-EAE (n=20), C5L2KO-EAE (n=14) and C5aR1KO-EAE (n=14). All groups except control WT-naïve were injected with myelin oligodendrocyte glycoprotein emulsion in complete Freund’s adjuvant. This was followed by an intraperitoneal injection pertussis toxin to disrupt the blood brain barrier to facilitate development of the chronic stage of EAE. Animals were scanned by MRI at 21 days ±3 post immunisation. In vivo scans were performed using a Bruker Biospec 9.4T MRI equipped with a quadrature Tx/Rx cryoprobe coil.
MR Spectroscopy
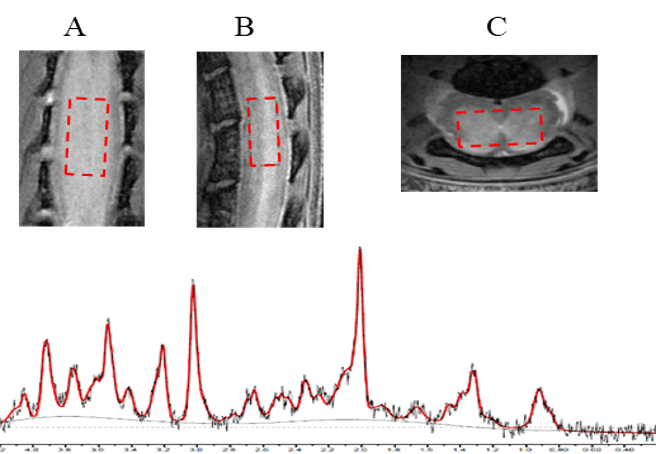
A high-resolution proton density (PD) gradient echo FLASH sequence at 40x40 µm resolution was used to guide the placement of MRS voxel and for image registration of DTI-maps. MRS was acquired using the point‐resolved spectroscopy (PRESS) (Figure 1). First order FID local shim was employed to reduce the water full width at half maximum (FWHM) to 23 ±3 Hz. Spectra with FWHM >28 Hz were excluded from analysis. LCModel (5) was used for spectral analysis to determine metabolite concentrations relative to creatine (Cr). Cr was chosen as it has been found invariant in MS compared to healthy controls (2, 6).
Diffusion tensor imaging
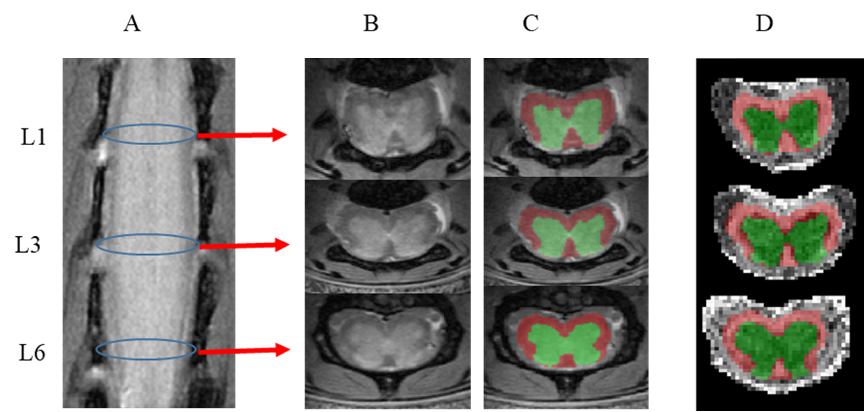
DTI data was acquired using 2D diffusion-weighted spin-echo sequence (Figure 2). Fractional anisotropy (FA), axial diffusivity (AD), mean diffusivity (MD) and radial diffusivity (RD) maps were calculated using FSL DTIFIT. ROI segmentation of the spinal cord WM and GM was made on the high-resolution PD-weighted images using the Spinal Cord Toolbox (SCT), which has been retrained to segment the mouse spinal cord. Segmented ROIs were registered to DTI-maps by affine registration using FSL FLIRT.
Results
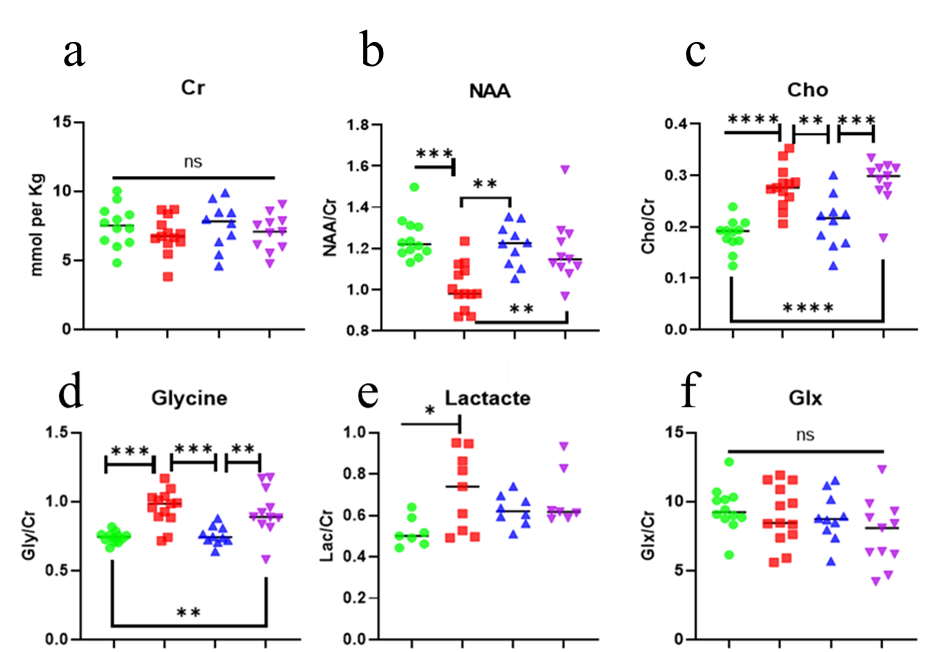
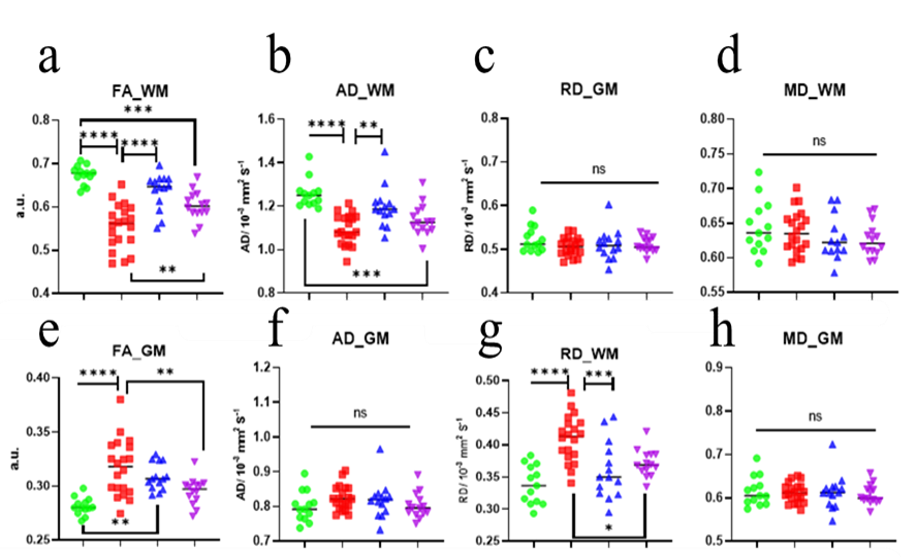
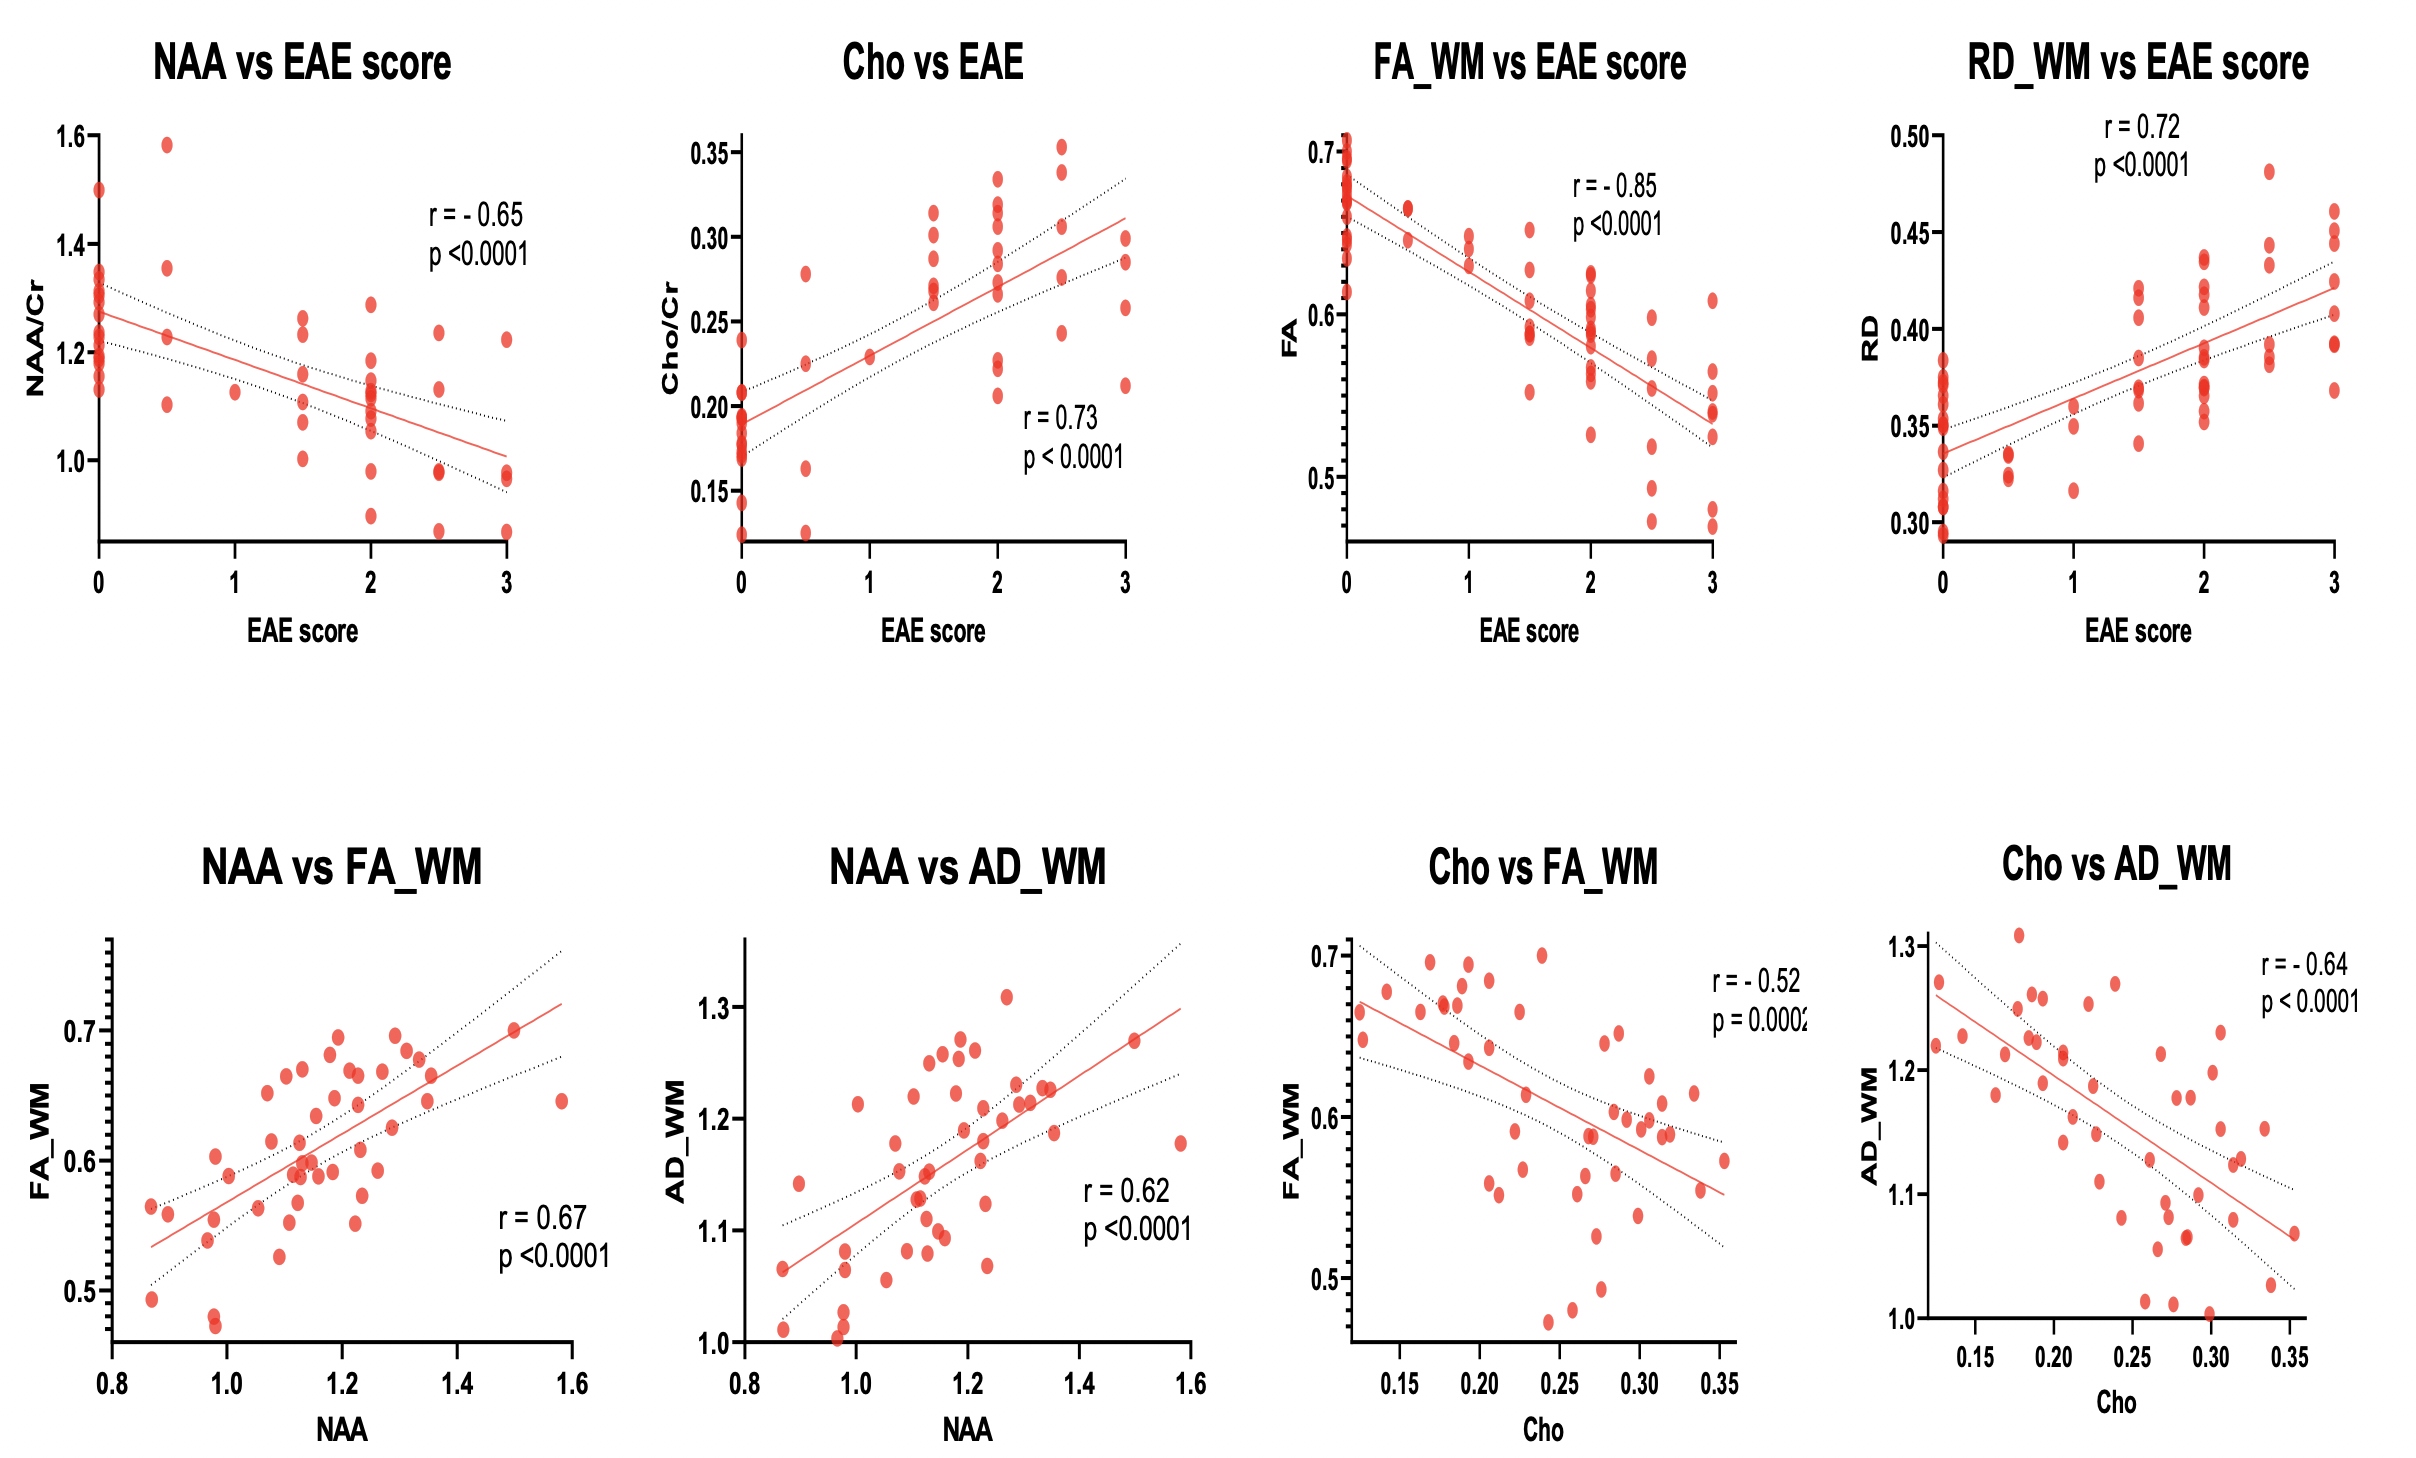
MRS analysis detected a significant decrease in relative NAA concentration for WT-EAE compared to all other groups, and a concomitant increase in relative Cho (Figure 3 b & c). m-Ins concentration has a generally large standard deviation and did not show any significant differences. Significant changes were also found in glycine and lactate (Figure 3 d & e). DTI showed a significant change in the white matter FA, AD and RD (Figure 4 a, b & c). These changes mainly occurred between L2 to L5 which is covered by the MRS voxel. For GM, only FA showed significant increase in WT-EAE compared to control WT-naïve animals. These changes were also found in KO groups and control WT-naïve but were less significant (Figure 4 e). MRS and DTI parameter changes were strongly correlated to each other, and also with the EAE scores (Figure 5).Discussion
Changes in MRS metabolites and their correlations with DTI parameters suggest that they indicate EAE-induced neuronal damage, and therefore they can be used to further differentiate the roles of the two complement receptors in EAE. The reduction in NAA and a concomitant increase in Cho is often observed in MS (2). In the WT-EAE group, NAA is reduced significantly compared to control WT-naïve, which could result from axonal damage and metabolic dysfunction (1, 7). The similarity of NAA in the two KO-EAE groups compared to control WT-naïve could indicate the involvement of these receptors in increasing the inflammatory process leading to neuroaxonal damage. The axonal damage was also indicated by DTI as the AD values have decrease in WT-EAE compared to control WT-naïve. Moreover, demyelination was suggested by the significant increase in Cho and RD is which in agreement with some other studies e.g. Henning et al (8). We observed no significant difference in Cho between C5L2KO-EAE and control WT-naïve groups, whereas the C5aR1-EAE group exhibited higher Cho. This suggests that C5L2 receptor inhibition may be more protective against EAE progression than C5aR1 inhibition.Conclusion
FA, AD, Cho and NAA are MRI biomarkers that are sensitive to the severity of EAE disease. Genetic ablation of C5L2, to a greater extent than C5aR1, make these knockout mice less susceptible to CNS damage in EAE disease.Acknowledgements
AA and NK would like to acknowledge Dr. Julien Cohen-Adad and Dr Charley Gros, NeuroPoly Lab, Institute of Biomedical Engineering, Polytechnique Montreal, Montreal, QC, Canada, for their great help on retraining SCT.References
1. Abdel-Aziz K, Schneider T, Solanky BS, Yiannakas MC, Altmann DR, Wheeler-Kingshott CAM, et al. Evidence for early neurodegeneration in the cervical cord of patients with primary progressive multiple sclerosis. Brain : a journal of neurology. 2015;138(Pt 6):1568-82.
2. Duan Y, Liu Z, Liu Y, Huang J, Ren Z, Sun Z, et al. Metabolic changes in normal-appearing white matter in patients with neuromyelitis optica and multiple sclerosis: a comparative magnetic resonance spectroscopy study. 2017;58(9):1132-7.
3. Budde MD, Kim JH, Liang H-F, Russell JH, Cross AH, Song S-K. Axonal injury detected by in vivo diffusion tensor imaging correlates with neurological disability in a mouse model of multiple sclerosis. NMR in biomedicine. 2008;21(6):589-97.
4. Morgan BPJEroci. The role of complement in neurological and neuropsychiatric diseases. 2015;11(10):1109-19.
5. Provencher SWJLV. LCModel & LCMgui user’s manual. 2014:6.2-3.
6. De Stefano N, Filippi M. MR Spectroscopy in Multiple Sclerosis. Journal of Neuroimaging. 2007;17(s1):31S-5S.
7. Blamire AM, Cader S, Lee M, Palace J, Matthews PM. Axonal damage in the spinal cord of multiple sclerosis patients detected by magnetic resonance spectroscopy. 2007;58(5):880-5.
8. Henning A, Schar M, Kollias SS, Boesiger P, Dydak U. Quantitative magnetic resonance spectroscopy in the entire human cervical spinal cord and beyond at 3T. Magnetic resonance in medicine. 2008;59(6):1250-8.
Figures