0074
DTI and gluCEST imaging reveal the key role of white matter alteration in the pathogenesis in a mouse model of Huntington’s Disease1Université Paris-Saclay, Commissariat à l’Energie Atomique et aux Energies Alternatives (CEA), Centre National de la Recherche Scientifique (CNRS), Molecular Imaging Research Center (MIRCen), Laboratoire des Maladies Neurodégénératives, Fontenay-aux-Roses, France, 2Université Grenoble-Alpes, Grenoble Institute of Neurosciences (GIN), INSERM U1216, Grenoble, France
Synopsis
Huntington’s Disease (HD) is a neurodegenerative disorder caused by the expansion of CAG repeats on the exon 1 of the HTT gene. Although genetic origin of HD is well-established, early and predictive biomarkers of disease onset and progression are still lacking. In the present study, we performed a multiparametric longitudinal MRI study on a mouse model of HD. Our results in gluCEST, Magnetization Transfer, morphometry and Diffusion Tensor Imaging revealed early modifications of white matter followed by progressive functional and anatomical changes in HD mice. Such network seems to point out the central role of white matter in HD pathogenesis.
Purpose
Huntington’s Disease (HD) is a neurodegenerative disorder caused by the expansion of CAG repeats on the exon 1 of the HTT gene1. The mutation causes progressive neurodegeneration with preferential vulnerability of the striatum. Atrophy of this structure is currently the main biomarker of the disease2 but there is a need to find earlier and more functional biomarkers.In a previous work, we showed that gluCEST imaging3 was able to highlight defects in the white matter of a slowly progressive mouse model of HD4. In the present study, we combined gluCEST with other state-of-the-art MRI techniques to investigate the pivotal role of white matter alteration in HD pathogenesis in this mouse model. In addition, we evaluated the potential of different biomarkers that could help refining HD diagnosis and disease monitoring.
Material & Methods
Mouse model: Knock-in mice expressing mouse/human exon 1 containing 140 CAG repeats inserted in the murine huntingtin (Htt) gene were used5. Heterozygous mice for the Htt gene (Ki140, n=11 males) were compared to their relative age-matched littermates (WT, n=12 males).MRI protocol: Animals were scanned longitudinally (2.5, 5, 8, 12 and 18 months of age) on a horizontal 11.7T Bruker magnet using a Cryoprobe. The MRI protocol included anatomical (TSE sequence, 100 slices, 0.1 x 0.1 mm², 0.2 mm slice thickness), gluCEST (Magnetization Transfer Ratio (MTRasym) at ±3 ppm calculated from a Zspectrum acquired between -5 and 5 ppm, B1=5 µT, Tsat=1 s, WASSR correction for B0 inhomogeneity6), magnetization transfer (MT) (MTRasym at ±16 ppm, B1=10 µT, Tsat=800 ms) and Diffusion Tensor Image sequences (EPI, 10 slices, 0.1125 x 0.1125 mm², 0.5 mm slice thickness, b-value=1000 s/mm², 30 directions). Resting-state fMRI sequence was added at 18 months (TE/TR=10/1000 ms, 0.2 x 0.2 mm2, 0.7 mm slice thickness, 12 slices, 450 repetitions).
Image Analysis: Images were co-registered and automatically segmented using an atlas composed of a high-resolution template based on Allen mouse brain atlas7. The registration pipeline used an in-house python library (Sammba-MRI8). DTI images were analyzed using the Tract-Based Spatial Statistics (TBSS9) pipeline (FSL10).
Statistical analysis: After Shapiro-Wilk normality test, one-way ANOVA with repeated measures was used for statistical analysis and was followed by Fisher LSD post-hoc test.
Results
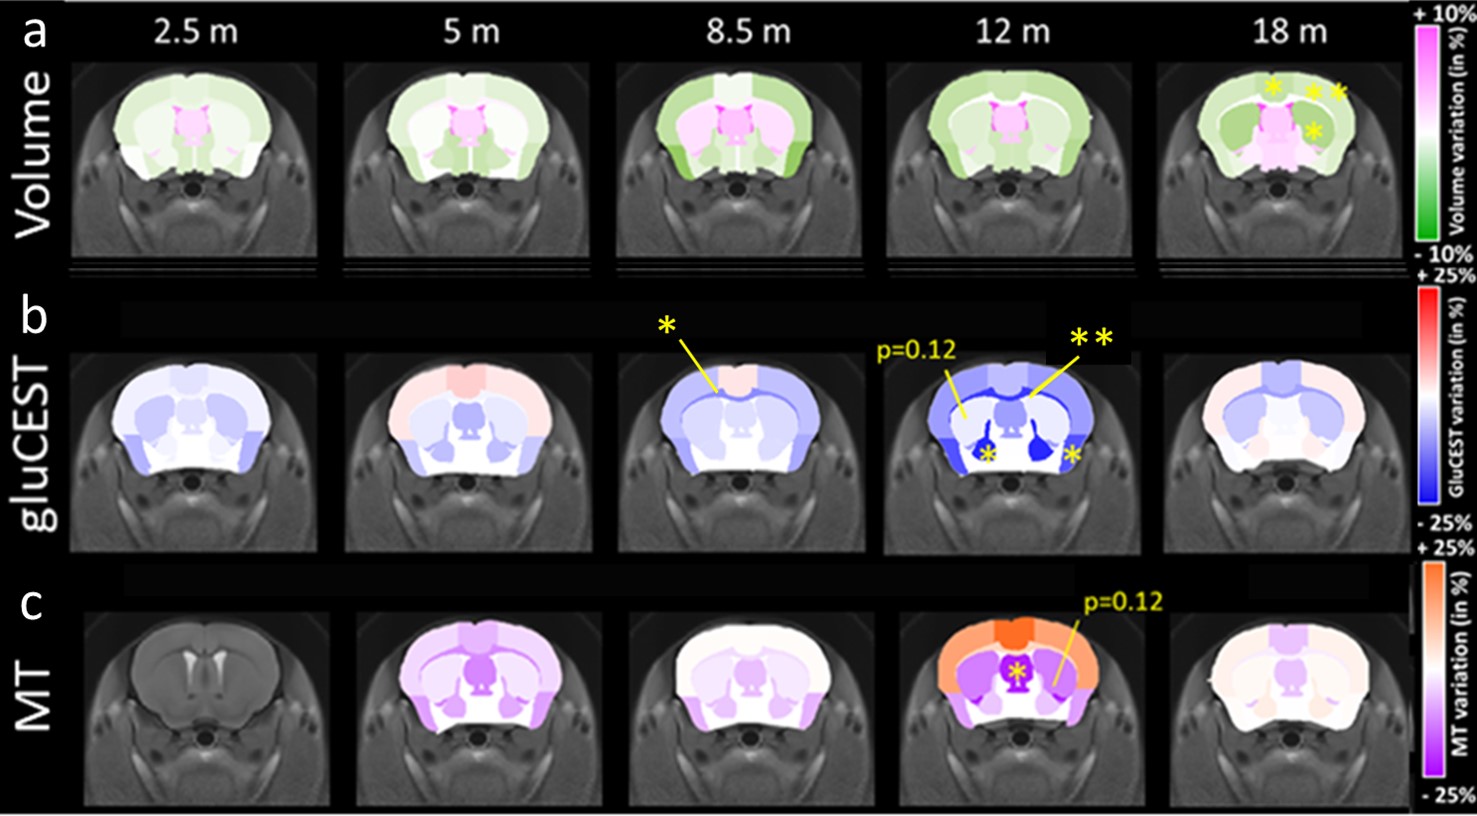
Morphometry: Based on volume measurements, variation maps between WT and Ki140 mice were calculated (Fig.1a). Ki140 mice exhibited progressive global atrophy of the brain, leading to significant atrophy of the striatum (-4.3%, p<0.05), frontal cortex (-5.3%, p<0.05) and motor cortex (-3.3%, p<0.05) at 18 months.GluCEST and MT imaging: Variation maps of gluCEST and MT signal were generated using the same process (Fig.1b-c). GluCEST signal was similar in Ki140 and WT at 2 and 5 months of age. At 8 months, Ki140 mice displayed reduced gluCEST in the corpus callosum (CC, -10.8%, p<0.05). Significant decrease of gluCEST signal was also measured in the CC (-19%, p<0.01), in the frontal (-7.3%, p<0.05) and piriform (-16.7%, p<0.05) cortices and in the pallidum (-21.0%, p<0.05) of Ki140 mice at 12 months. At the same timepoint, a downward trend was also visible in the striatum of HD mice (-12%, p=0.12). MT contrast displayed the same behavior with no alteration in young animals until 12 months, when a significant decrease was measured in the septum (-21.7%, p<0.05) and a trend in the striatum (-12.5%, p=0.12). In the latest timepoint, gluCEST and MT signals exhibited no significant variation.
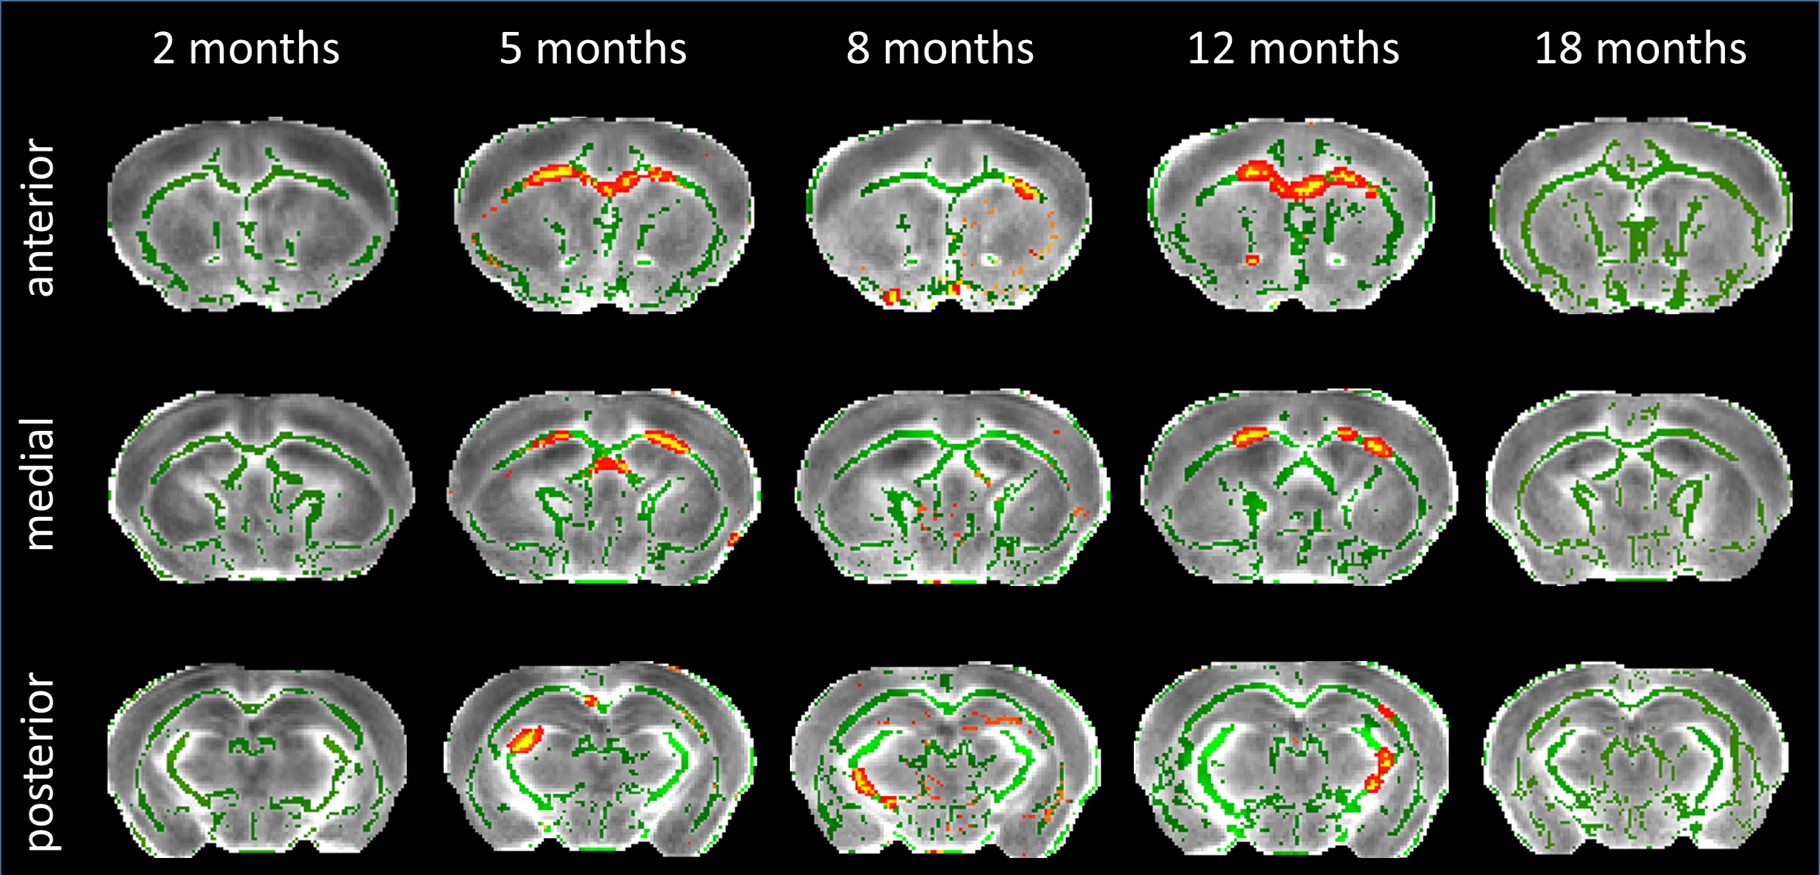
DTI: TBSS analysis showed decreased Fractional Anisotropy (FA) in anterior CC of Ki140 mice at 5 months (Fig.2). Clusters of voxels with altered diffusivity also appeared at 8 and 12 months in CC and fimbria.
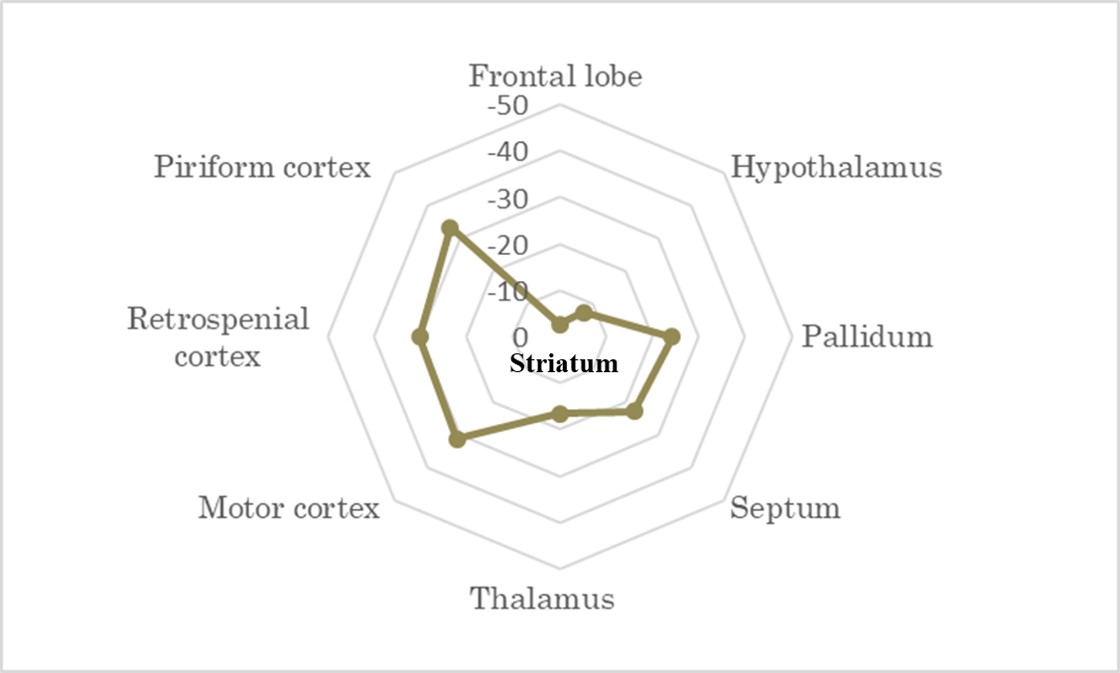
RS-fMRI: Correlation matrix analysis showed reduced connectivity of the striatum to other regions of interest in Ki140 compared with WT (n.s., Fig. 3)
Discussion
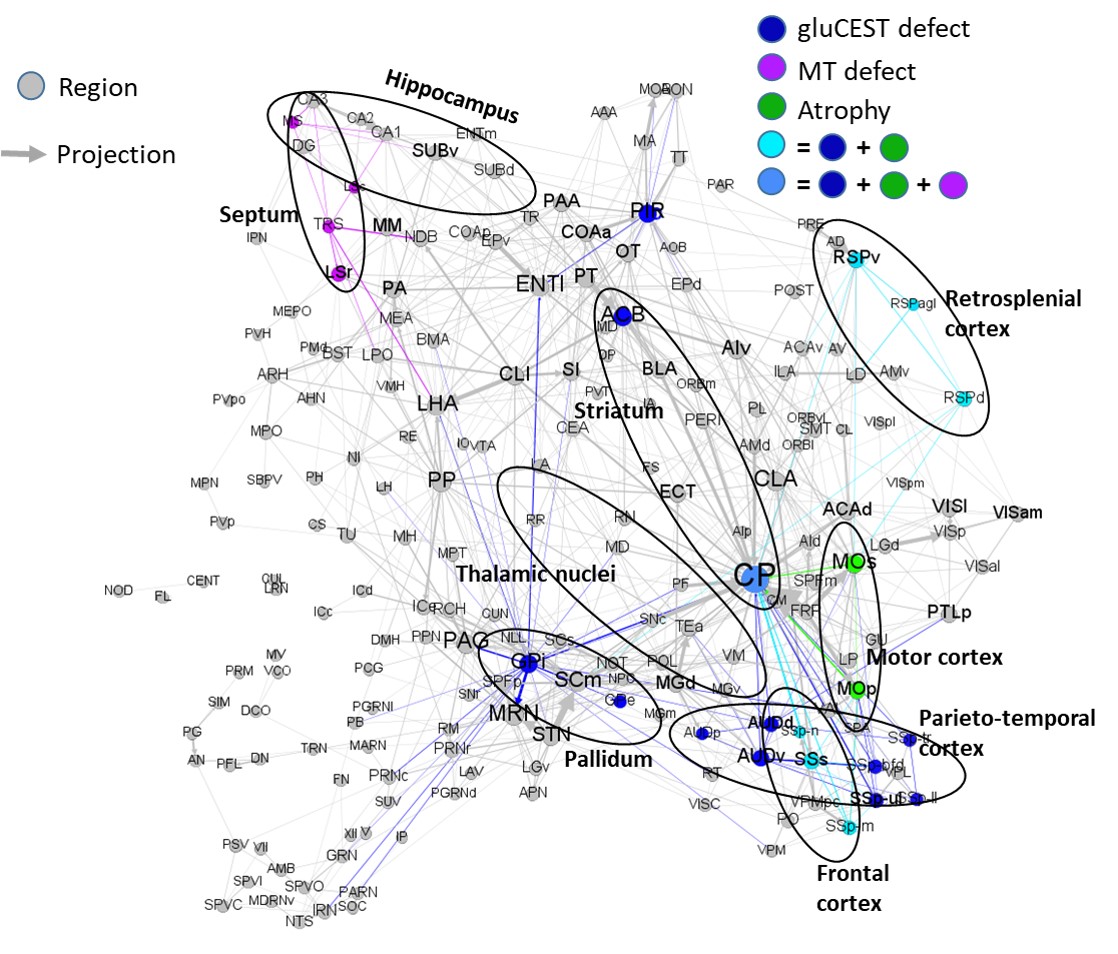
Atrophy observed at 18 months is consistent with clinical HD according to literature11-13, as well as reduced gluCEST contrast measured in the CC at 12 months4. However, our results showed that gluCEST and MT imaging could give earlier and more functional information than morphometric analysis.Using axonal projection data of the mouse brain14 (Fig.4), we discovered that striatal and cortical regions displaying defects in MT, gluCEST or atrophy were strongly connected. FA alterations at 5 months showed evidence of microstructural modifications in the anterior CC, which drives most of these connections. CC also exhibited earliest and firmest metabolic impairments. This highlights the central role that white matter alteration may play in HD pathogenesis.
Finally, a resting-state fMRI sequence acquired during the last timepoint showed a reduced functional connectivity of the striatum to other regions of interest, especially motor, retrosplenial and piriform cortices (Fig.3). This tends to confirm that white matter, and more precisely cortico-striatal connections, was strongly involved in HD pathogenesis in this mouse model.
Conclusion
Our study emphasizes the interest of DTI, CEST and MT imaging combined with automated segmentation as biomarkers of neurodegenerative diseases. We showed that, in the Ki140 mouse model, white matter alteration precedes striatal impairments and may induce the vulnerability of this structure by affecting cortico-striatal connectivity. In the future, it would be of great interest to explore further early alterations of white matter and to transfer our protocol to clinical HD.Acknowledgements
Acknowledgment Project was supported by eRARE ERA-Net (“TreatPolyQ” ANR-17-RAR3-0008-01) and NeurATRIS, (“Investissements d'Avenir”, ANR-11-INBS-0011). The 11.7T scanner was funded by NeurATRIS (“Investissements d'Avenir”, ANR-11-INBS-0011).References
1. Walker, F.O., Huntington's disease. Lancet, 2007. 369(9557): p. 218-28.
2. Tabrizi, S.J. et al., Predictors of phenotypic progression and disease onset in premanifest and early-stage Huntington's disease in the TRACK-HD study: analysis of 36-month observational data. Lancet Neurol., 2013. 12(7): p.637-49.
3. Cai, K. et al. Magnetic resonance imaging of glutamate. Nat. Med., 2012. 18(2): p302-6
4. Pépin, J. et al. In vivo imaging of brain glutamate defects in a knock-in mouse model of Huntington's disease. Neuroimage, 2016. 139: p53-64
5. Menalled, L.B. et al., Time course of early motor and neuropathological anomalies in a knock‐in mouse model of Huntington's disease with 140 CAG repeats. The Journal of Comparative Neurology, 2003. 465: 11–26.
6. Kim, M. et al. Water saturation shift referencing (WASSR) for chemical exchange saturation transfer (CEST) experiments. Magn. Reson. Med., 2009. 61(6):1441-50
7. Lein, E.S. et al. Genome-wide atlas of gene expression in the adult mouse brain, Nature, 2007. 445: 168-176.
8. Célestine, M. et al. Sammba-MRI: A Library for Processing SmAll-MaMmal BrAin MRI Data in Python. Frontiers in Neuroinformatics, 2020. 14:24.
9. Smith, S.M. et al. Tract-based spatial statistics: voxelwise analysis of multi-subject diffusion data. Neuroimage. 2006 Jul 15;31(4):1487-505.
10. Smith, S.M. et al., Advances in functional and structural MR image analysis and implementation as FSL. NeuroImage, 2004 23(S1):208-219.
11. G. J. Harris et al., Putamen volume reduction on magnetic resonance imaging exceeds caudate changes in mild Huntington’s disease, 1992, Ann. Neurol., vol. 31, no 1, p. 69‑75
12. T. L. Jernigan et al. Cerebral structure on MRI, part II: Specific changes in Alzheimer’s and Huntington’s diseases, Biol. Psychiatry, 1991, vol. 29, no 1, p. 68‑81
13. Van den Bogaard S. et al., MRI biomarkers in Huntington’s disease, Front. Biosci. Elite Ed., 2012, vol. 4, p. 1910‑1925
14. Oh, S.W. et al. A mesoscale connectome of the mouse brain. Nature, 2014. 508: 207-214.
Figures