0073
Altered pH in early Alzheimer’s disease detected by creatine chemical exchange saturation transfer magnetic resonance imaging1Department of Radiology and Radiological Science, Johns Hopkins University, Baltimore, MD, United States, 2F.M. Kirby Research Center for Functional Brain Imaging, Kennedy Krieger Research Institute, Baltimore, MD, United States, 3Department of Psychiatry and Behavioral Sciences, Johns Hopkins University, Baltimore, MD, United States, 4Department of Pathology, Johns Hopkins University, Baltimore, MD, United States, 5Department of Neuroscience, Johns Hopkins University, Baltimore, MD, United States
Synopsis
We demonstrate the feasibility of creatine chemical exchange saturation transfer (CrCEST) MRI in detecting altered pH in Alzheimer’s disease (AD) mouse brain. In two early-stage AD models, namely Tau and APP mice, CrCEST contrast in the brain was significantly reduced compared to that of WT mice at 6-7 months (P<0.007). From MRS experiments, the brain creatine concentration between WT and AD mice was the same within error, which indicates that the reduced CrCEST contrast in the AD brain can be contributed mainly to pH reduction. Immunohistochemical analysis showed neuroinflammation in the APP mice, a potential factor for causing pH reduction.
Purpose
Previous studies have shown that abnormal cerebral pH plays an important role in the aggregation of Alzheimer’s disease associated proteins (1-3). Some studies also implicate neuroinflammation as a cause of the cerebral pH reduction involved in developing AD(4-6). Hence, in vivo assessment of cerebral pH could be a useful biomarker for the differentiation between AD and healthy controls (7-9). Currently, there are limited methods for noninvasively detecting pH in vivo. Previous studies demonstrate that the exchange of protons between water and guanidinium protons from creatine is highly sensitive to pH change(10-13). Hence we aim to apply creatine chemical exchange saturation transfer (CrCEST) as a sensitive method to detect cerebral pH changes in two AD mouse models, the amyloid precursor protein/presenilin-1 (APP) model (14) and the tau mouse model (Tau4RDK) (15).Methods
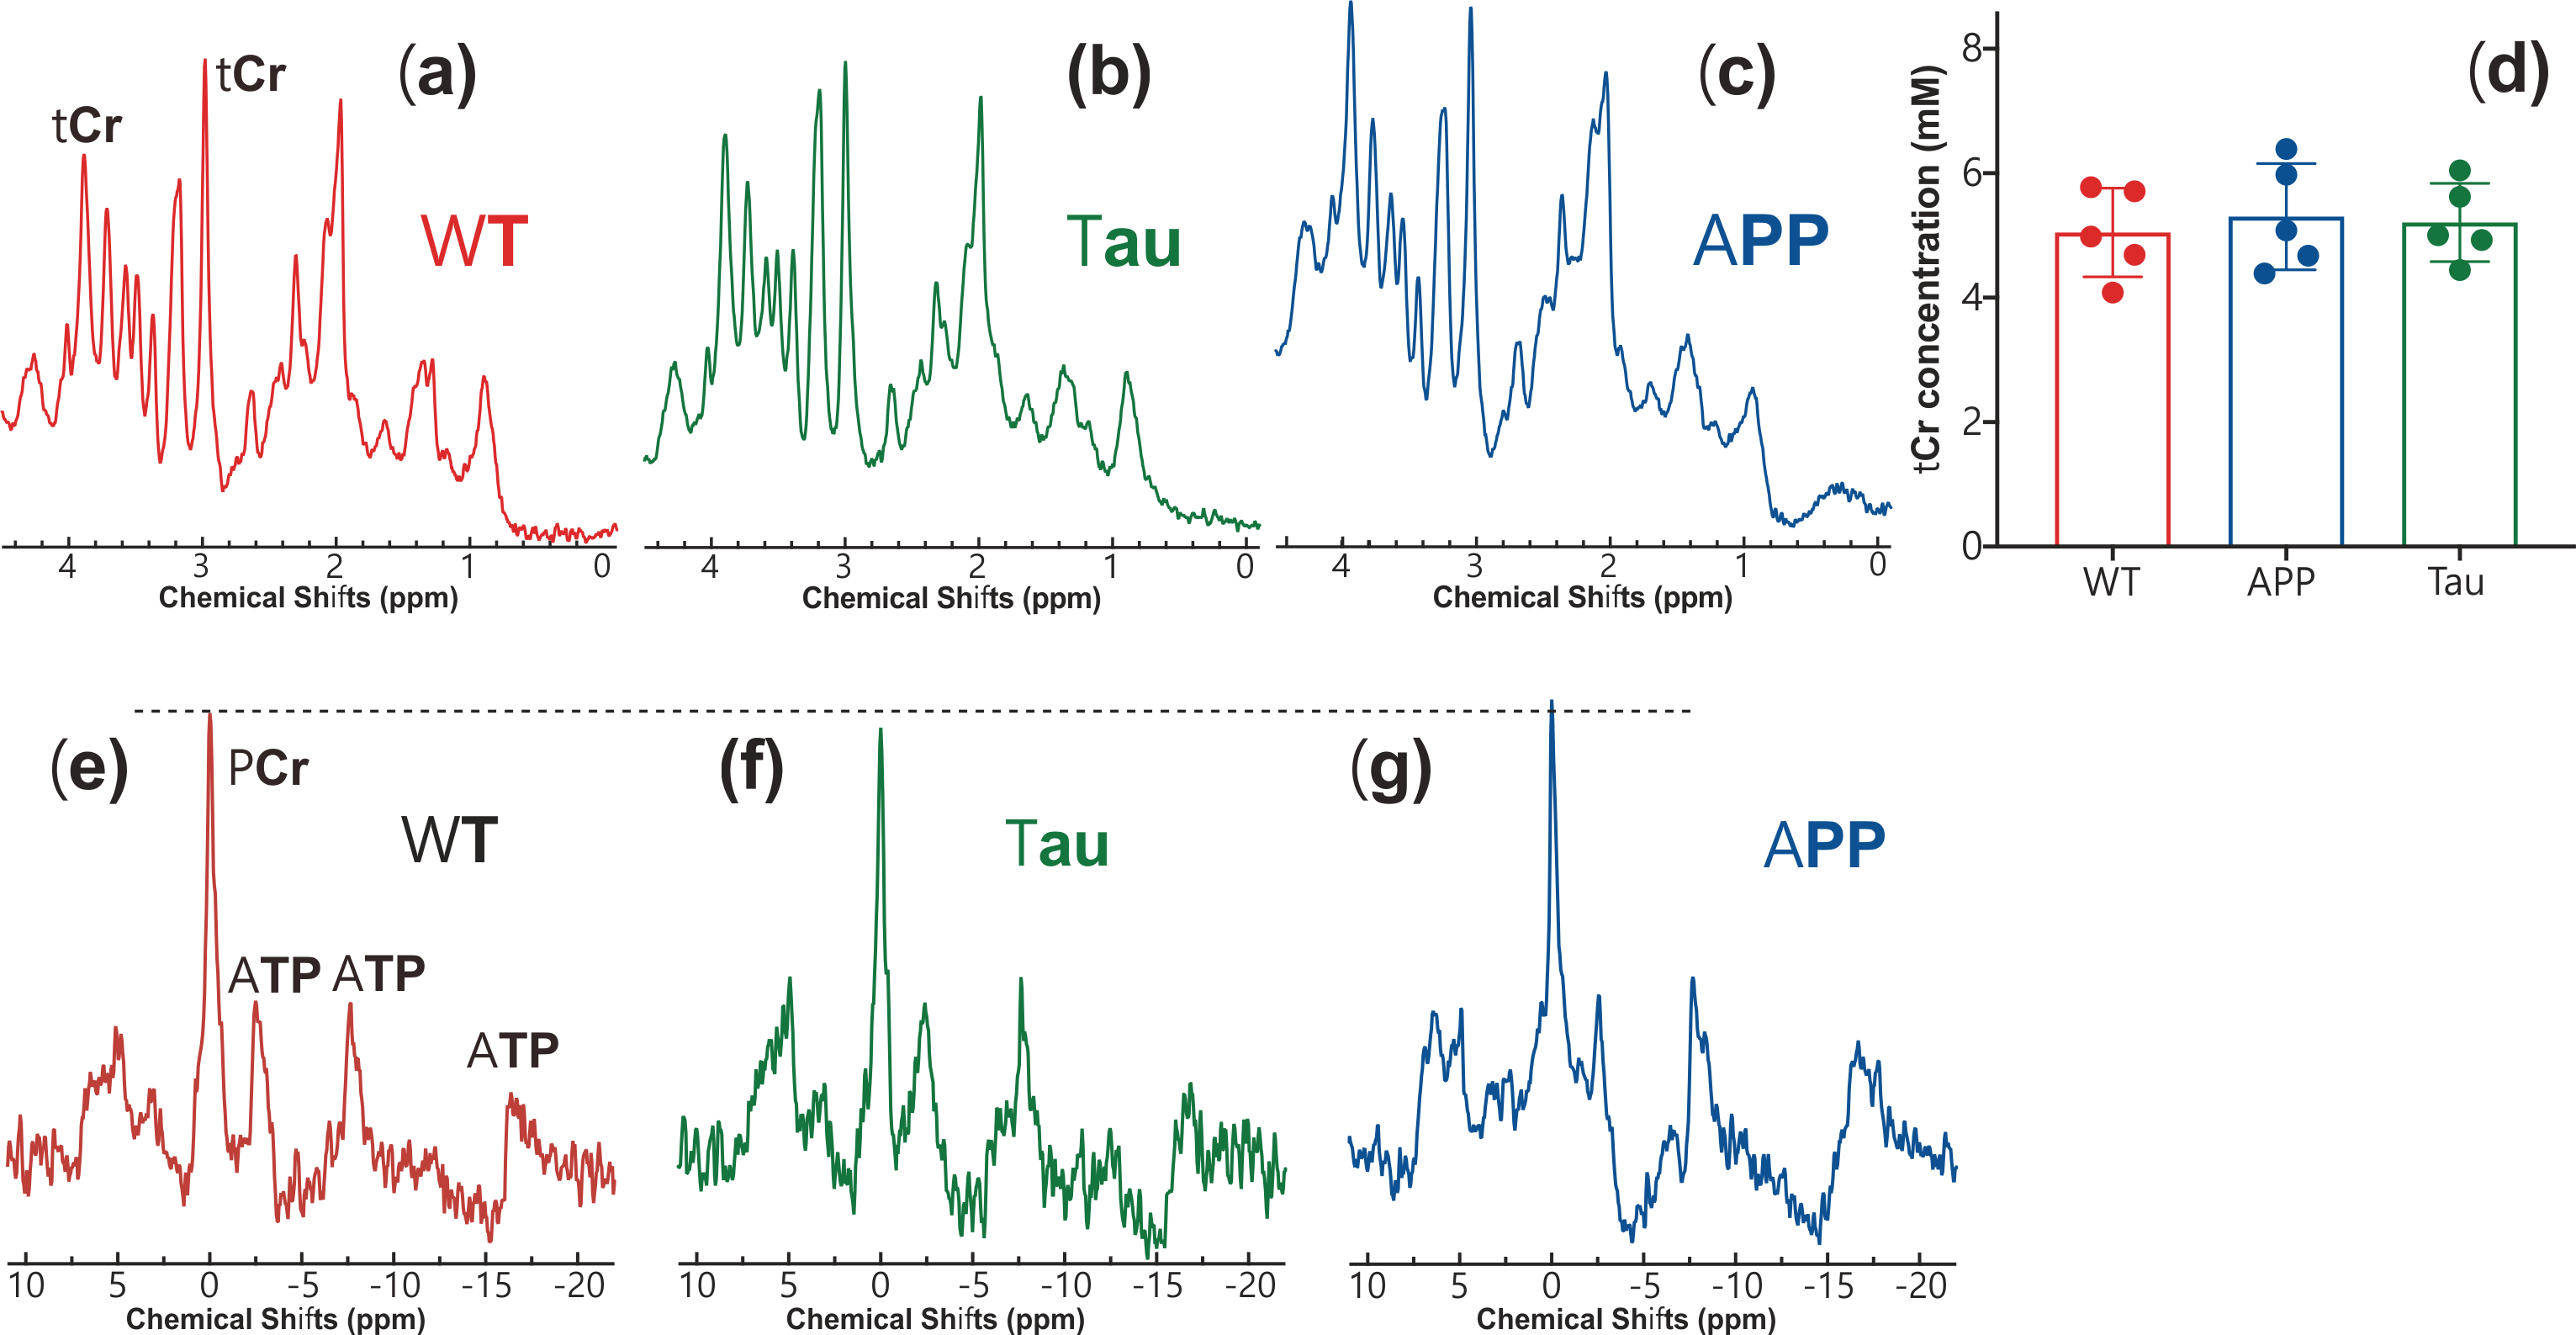
Thirty female mice (age 6-7 months) were employed for the study, of which ten were Tau4RDK (Tau) (15), ten APPswe:PS1DE9 (APP), and another ten age-matched C57BL/6J (WT). All MRI experiments were performed on a horizontal bore 11.7 T Bruker Biospec system equipped with a 72mm volume resonator and 2×2 phased array coil. A double-tuned 31P/1H coil was employed for the collection of in vivo 31P MRS. All CEST experiments were performed using continuous-wave CEST (cwCEST). MR images were acquired using a Turbo Spin Echo (TSE) sequence with TE = 18 ms, TR=5 s, TSE factor = 20, slice thickness =1.5 mm and a matrix size of 64×64. The saturation field strength (B1) and length for CrCEST were 2 μT and 1 s, respectively (16,17). The extraction and quantification of the CEST signal were achieved using polynomial and Lorentzian line-shape fitting (PLOF) as detailed previously (11,16-19). The concentration of total Cr (tCr=Cr+PCr) was determined by 1H MRS, which was performed with a voxel of 3×3×3 mm3 using a stimulated echo acquisition mode (STEAM) sequence (TE = 3 ms, TM = 10 ms, TR = 2.5 s, NA = 256). The PCr concentration was determined by in vivo 31P MRS experiments, which were performed using a single pulse sequence (TR = 2 s, NA = 512, bandwidth = 50 ppm, acquisition time = 100 ms). Antibodies specific to human Ab and phosphorylated S422 of tau were used to monitor plaque and tangle formation, respectively. Neuroinflammation in the AD brain was determined by examining reactive astrocytes and microglia using polyclonal antibodies against GFAP and IBA1, respectively.Results and Discussion
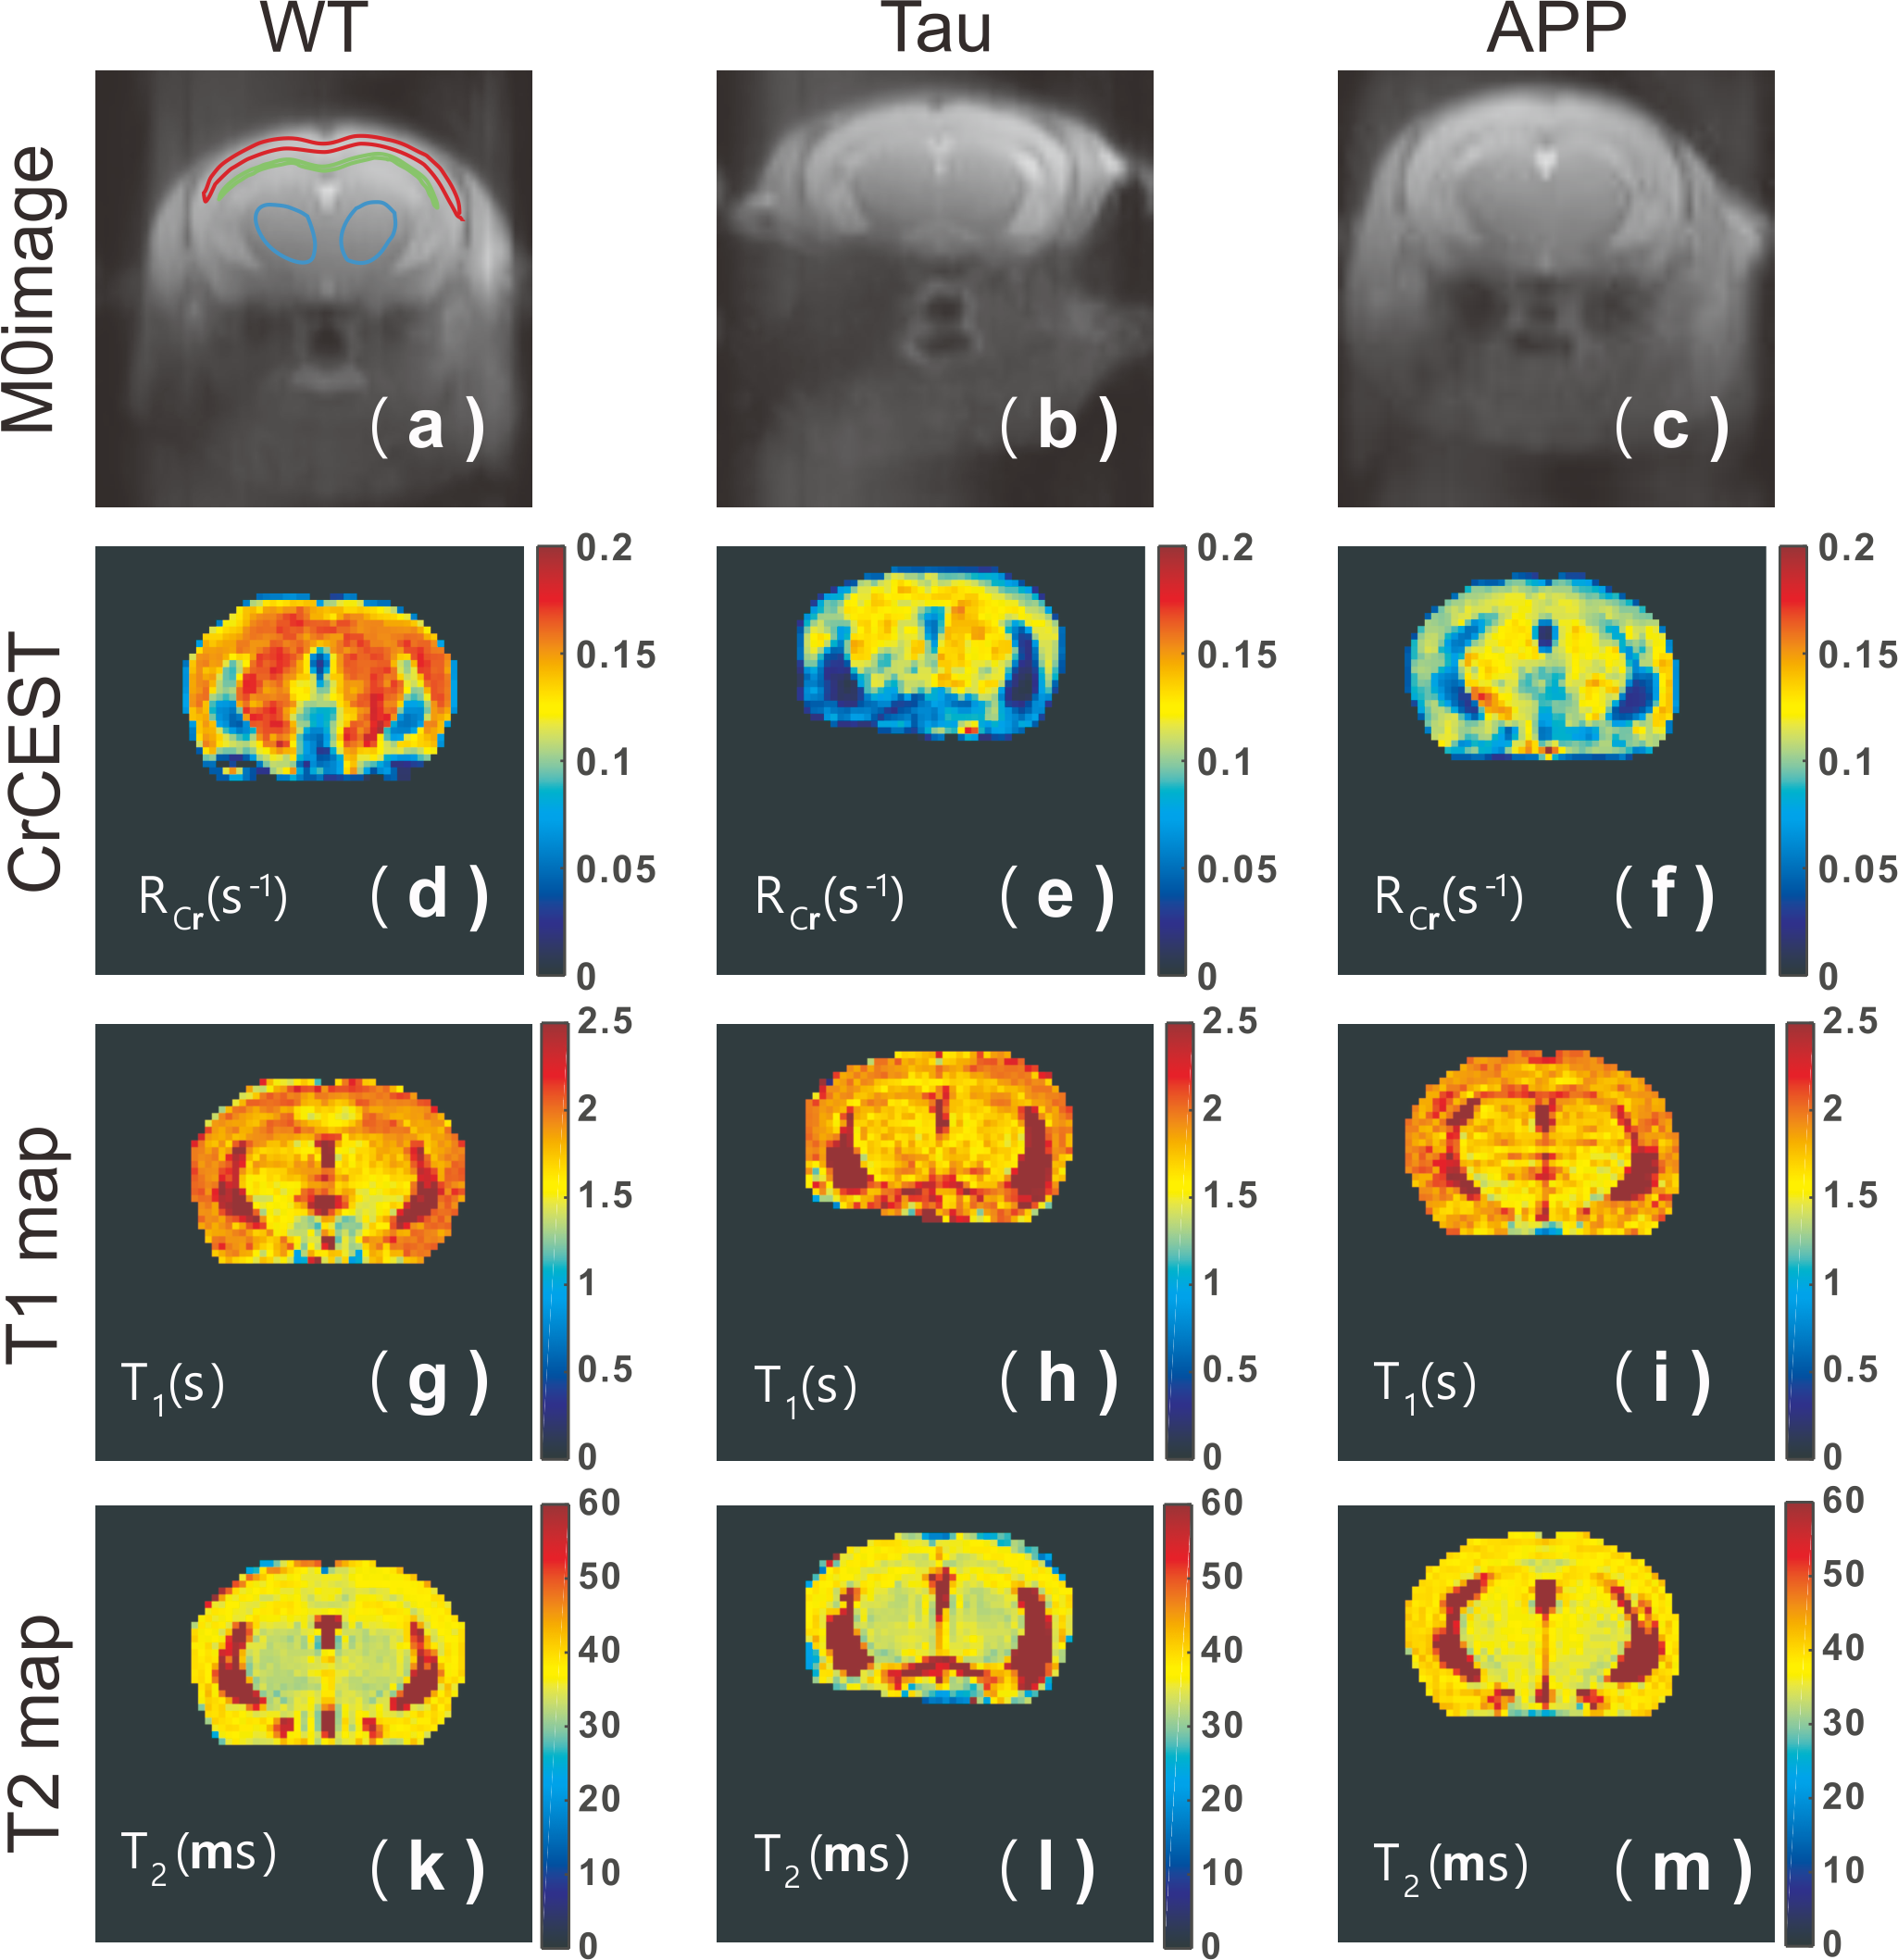
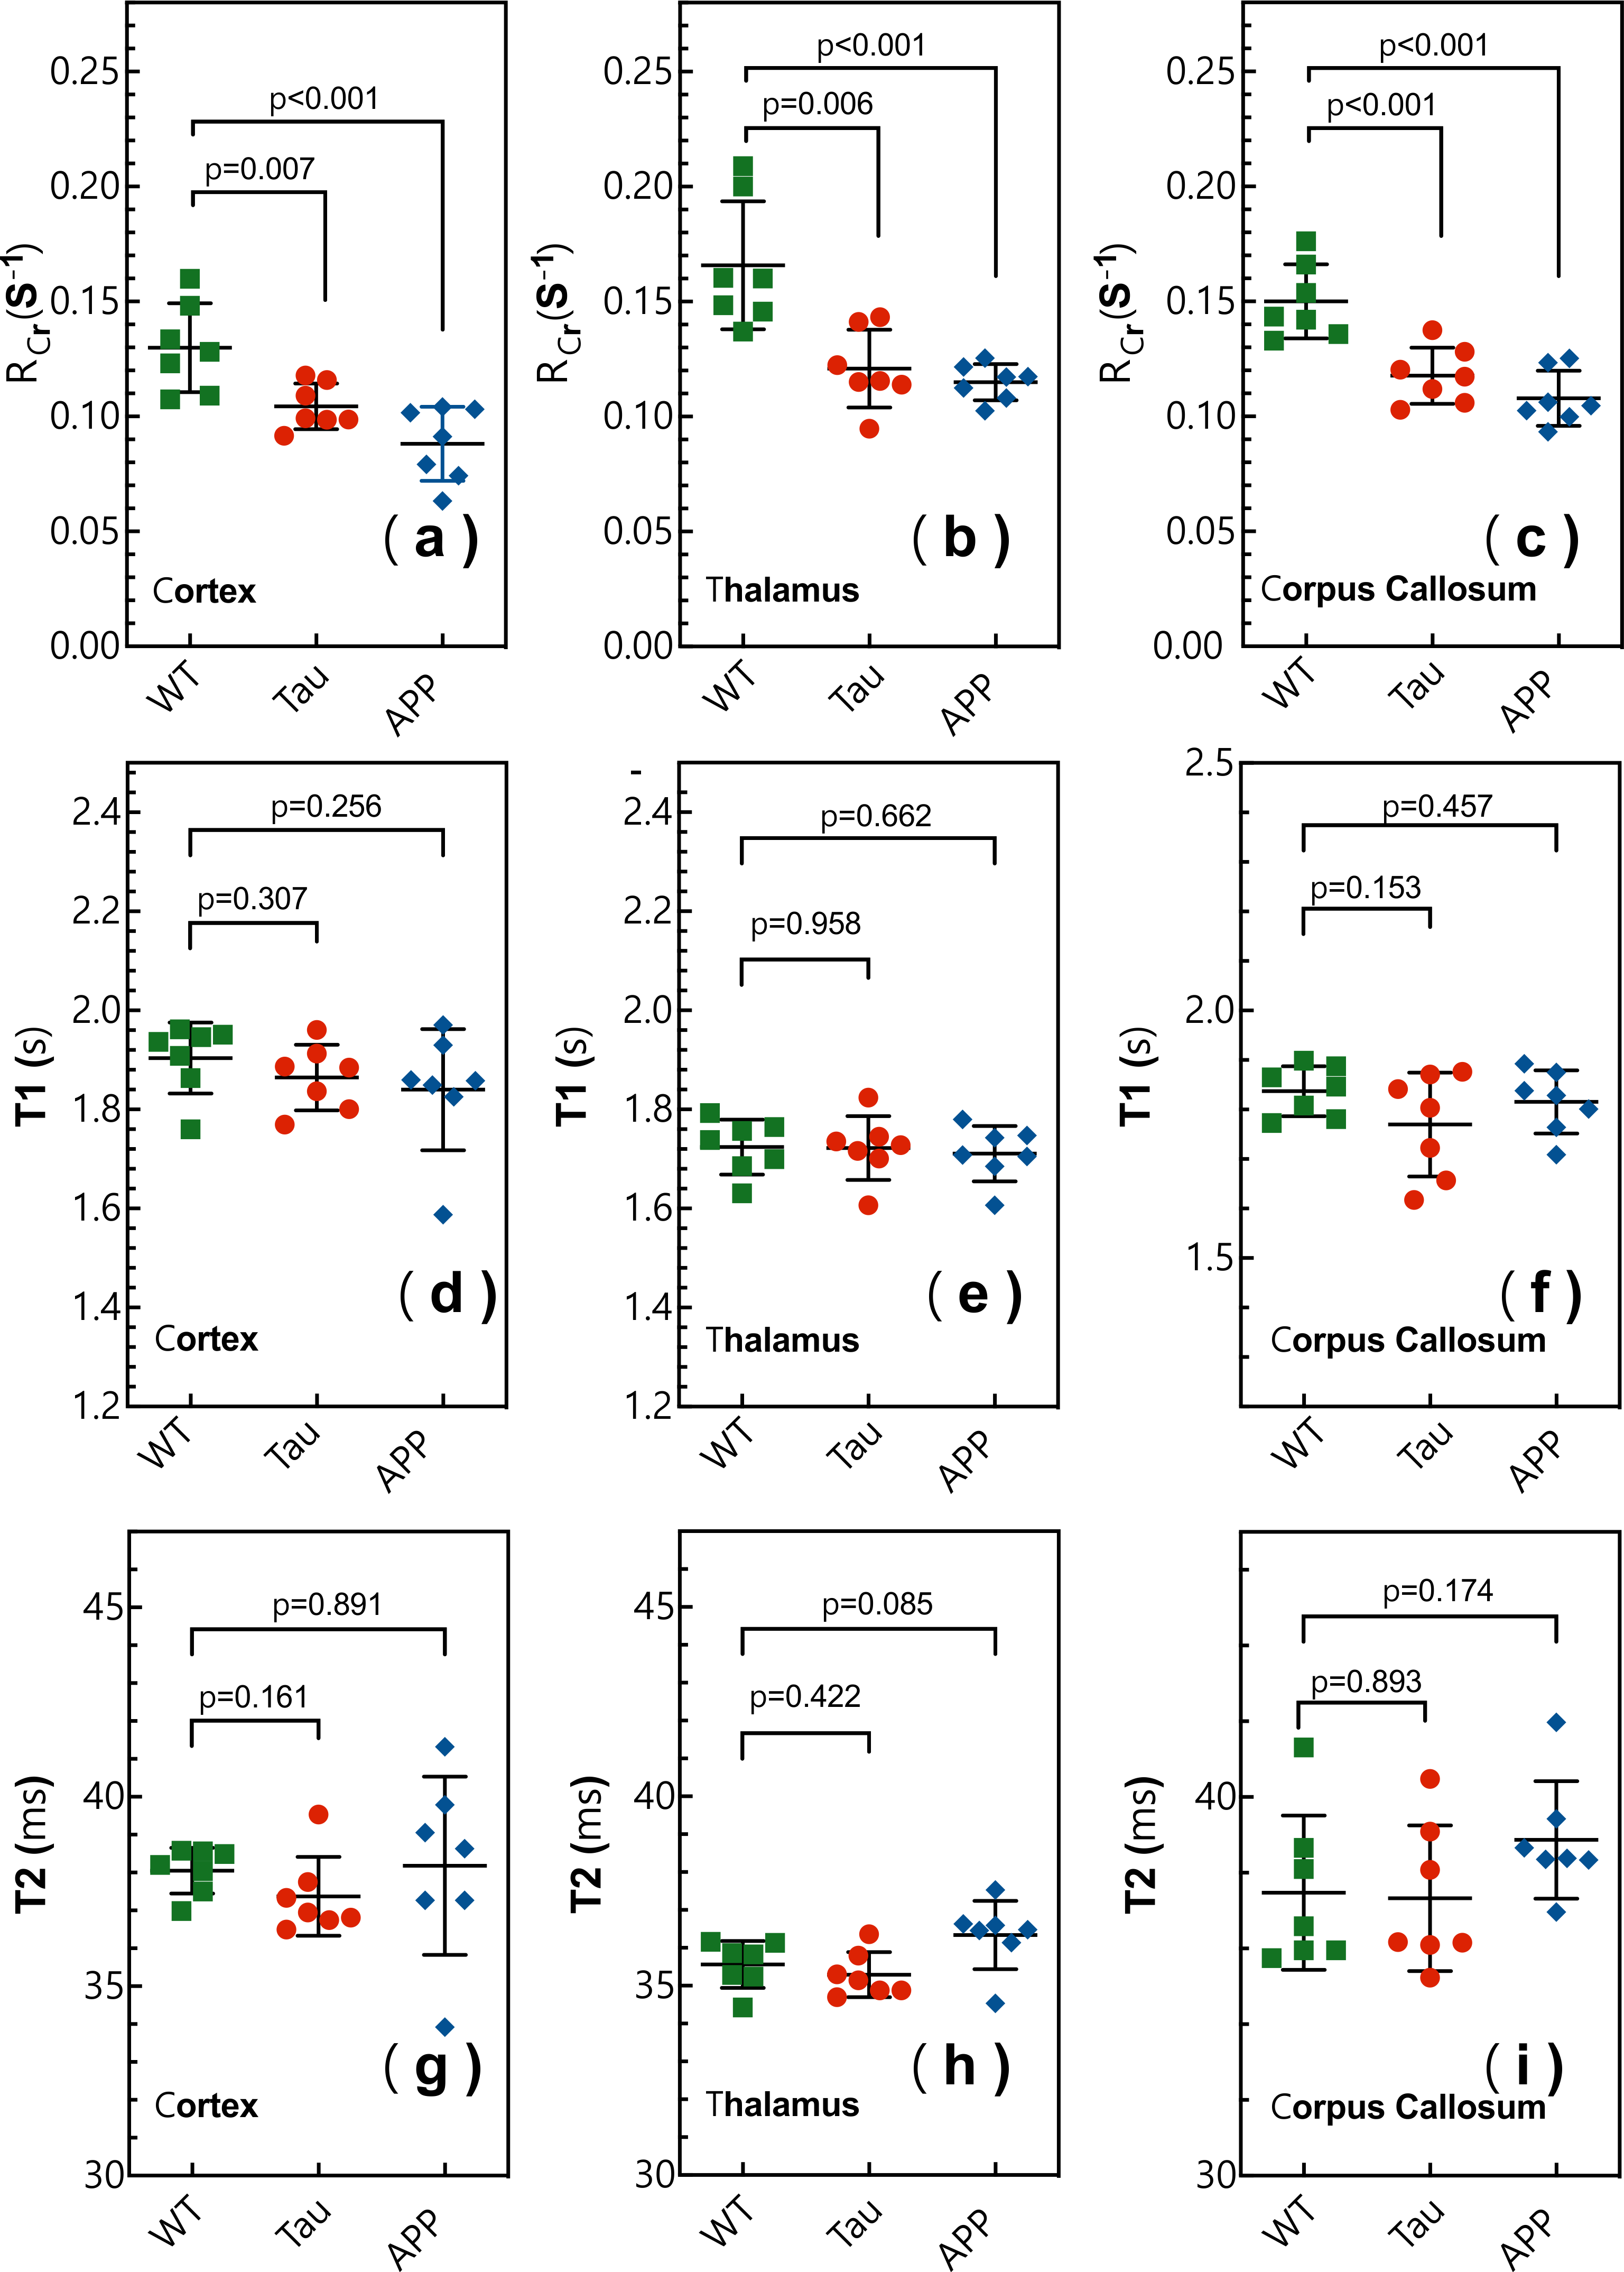
Typical CrCEST maps, which are represented by the true apparent relaxation rates of Cr ( on AD and WT mouse brains, are shown in Figs. 1d-f together with T1 maps (Figs. 1g-i) and T2 maps (Figs. 1k-m). To compare the results among different types of mice, regional , T1 and T2 values were extracted and summarized in Fig. 2. Three regions of interest (ROIs), namely cortex (cx), thalamus (th), and corpus callosum (cc), were chosen (Fig. 1a). Significant difference was observed between WT and APP values in all three regions (P<0.001). The values for APP mice were slightly lower than those for Tau mice in the cortex (Tau: 0.104±0.014 s-1; APP: 0.088±0.014 s-1; P=0.04). No significant difference was observed for the regional T1 values among the three types of mice. The T2 values were similar between WT and Tau mice, while the T2 values were slightly higher in the APP mice, particularly in the thalamus (WT: 35.56±0.60 ms; Tau: 35.29±0.59 ms; and APP: 36.34±0.90 ms), though this did not reach statistical significance (P=0.08).To exclude potential contributions from creatine concentration variations to the reduced CrCEST contrast observed in APP and Tau mouse brains, the PCr and total Cr (tCr = PCr + Cr) concentrations were measured using 31P and 1H MRS, respectively (Fig. 3). The MRS showed that the concentrations of PCr and Cr in AD and WT mouse brain were not significantly different. This result suggests that altered pH is the major contributor to the reduced CEST contrast observed in AD mouse brain.
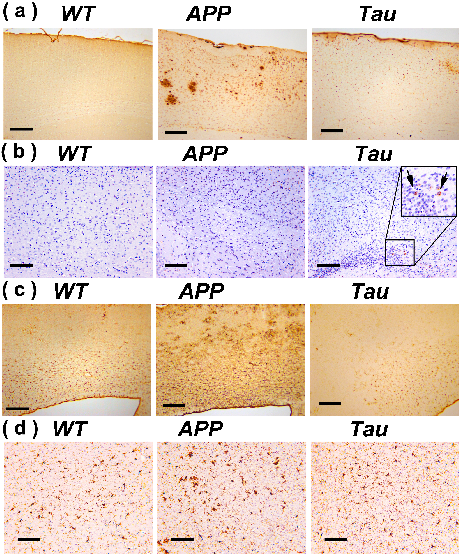
Typical immunohistochemical staining results in the cortex of WT, APP and Tau mouse brains are demonstrated in Fig. 4. At the age when altered PH was detected, the plaques are already abundant in APP mice (Fig. 4a), while Tau tangles are less obvious (Fig. 4b). Hypertrophic GFAP positive astrocytes were observed in the cortical regions of APP mice but not Tau mice (Fig. 4c). Similar to the astrocyte results, the IBA1 histological staining results indicated activation of microglia in the APP mice, while weaker microglial activation was observed in the Tau mice. Inflammation is a widely demonstrated pathological feature in the AD human brain characterized by an accumulation of activated microglia and astrocytes around plaques and tau tangles(20,21). Hence, neuroinflammation could be a major cause of the intracellular pH reduction in both APP and Tau mice (5,6) as confirmed by the current immunohistochemical analysis.
Conclusion
Young AD mice have reduced intracellular pH compared to WT mice, which preceded the tangle and plaque formation. pH has the potential to be a biomarker for early diagnosis of AD.Acknowledgements
This work was supported by NIH: P41EB015909, R01HL149742, R03NS109664, R21NS118079, R21AG065794, P50AG05146 and DOD W81XWH-18-1-0797References
1. Burdick D, Soreghan B, Kwon M, Kosmoski J, Knauer M, Henschen A, Yates J, Cotman C, Glabe C. Assembly and aggregation properties of synthetic Alzheimer's A4/beta amyloid peptide analogs. Journal of Biological Chemistry 1992;267(1):546-554.
2. Barrow CJ, Zagorski MG. Solution structures of beta peptide and its constituent fragments: relation to amyloid deposition. Science 1991;253(5016):179-182.
3. Atwood CS, Moir RD, Huang X, Scarpa RC, Bacarra NME, Romano DM, Hartshorn MA, Tanzi RE, Bush AI. Dramatic aggregation of Alzheimer Aβ by Cu (II) is induced by conditions representing physiological acidosis. Journal of Biological Chemistry 1998;273(21):12817-12826.
4. Morales I, Guzman-Martinez L, Cerda-Troncoso C, Farias GA, Maccioni RB. Neuroinflammation in the pathogenesis of Alzheimer's disease. A rational framework for the search of novel therapeutic approaches. Front Cell Neurosci 2014;8:112.
5. Schwartz L, Peres S, Jolicoeur M, da Veiga Moreira J. Cancer and Alzheimer's disease: intracellular pH scales the metabolic disorders. Biogerontology 2020:10.1007/s10522-10020-09888-10526.
6. Fang B, Wang D, Huang M, Yu G, Li H. Hypothesis on the relationship between the change in intracellular pH and incidence of sporadic Alzheimer's disease or vascular dementia. Int J Neurosci 2010;120(9):591-595.
7. Lyros E, Ragoschke-Schumm A, Kostopoulos P, Sehr A, Backens M, Kalampokini S, Decker Y, Lesmeister M, Liu Y, Reith W, Fassbender K. Normal brain aging and Alzheimer's disease are associated with lower cerebral pH: an in vivo histidine (1)H-MR spectroscopy study. Neurobiol Aging 2020;87:60-69.
8. Mandal PK, Akolkar H, Tripathi M. Mapping of hippocampal pH and neurochemicals from in vivo multi-voxel 31P study in healthy normal young male/female, mild cognitive impairment, and Alzheimer's disease. J Alzheimers Dis 2012;31 Suppl 3:S75-86.
9. Gonzales EB, Sumien N. Acidity and Acid-Sensing Ion Channels in the Normal and Alzheimer's Disease Brain. J Alzheimers Dis 2017;57(4):1137-1144.
10. Goerke S, Zaiss M, Bachert P. Characterization of creatine guanidinium proton exchange by water-exchange (WEX) spectroscopy for absolute-pH CEST imaging in vitro. NMR Biomed 2014;27(5):507-518.
11. Chen L, Cao S, Koehler RC, van Zijl PCM, Xu J. High-sensitivity CEST mapping using a spatiotemporal correlation-enhanced method. Magn Reson Med 2020:10.1002/mrm.28380.
12. Kogan F, Haris M, Singh A, Cai K, Debrosse C, Nanga RP, Hariharan H, Reddy R. Method for high-resolution imaging of creatine in vivo using chemical exchange saturation transfer. Magn Reson Med 2014;71(1):164-172.
13. Haris M, Nanga RP, Singh A, Cai K, Kogan F, Hariharan H, Reddy R. Exchange rates of creatine kinase metabolites: feasibility of imaging creatine by chemical exchange saturation transfer MRI. NMR Biomed 2012;25(11):1305-1309.
14. Drummond E, Wisniewski T. Alzheimer’s disease: experimental models and reality. Acta Neuropathol 2017;133(2):155-175.
15. Li T, Braunstein KE, Zhang J, Lau A, Sibener L, Deeble C, Wong PC. The neuritic plaque facilitates pathological conversion of tau in an Alzheimer's disease mouse model. Nat Commun 2016;7:12082.
16. Chen L, Wei Z, Cai S, Li Y, Liu G, Lu H, Weiss RG, van Zijl PCM, Xu J. High-resolution creatine mapping of mouse brain at 11.7 T using non-steady-state chemical exchange saturation transfer. NMR Biomed 2019;32(11):e4168.
17. Chen L, Zeng H, Xu X, Yadav NN, Cai S, Puts NA, Barker PB, Li T, Weiss RG, van Zijl PCM, Xu J. Investigation of the contribution of total creatine to the CEST Z-spectrum of brain using a knockout mouse model. NMR Biomed 2017;30(12):e3834.
18. Chen L, Barker PB, Weiss RG, van Zijl PCM, Xu J. Creatine and phosphocreatine mapping of mouse skeletal muscle by a polynomial and Lorentzian line-shape fitting CEST method. Magn Reson Med 2019;81(1):69-78.
19. Chen L, Schar M, Chan KWY, Huang J, Wei Z, Lu H, Qin Q, Weiss RG, van Zijl PCM, Xu J. In vivo imaging of phosphocreatine with artificial neural networks. Nat Commun 2020;11(1):1072.
20. Maeda J, Zhang MR, Okauchi T, Ji B, Ono M, Hattori S, Kumata K, Iwata N, Saido TC, Trojanowski JQ, Lee VM, Staufenbiel M, Tomiyama T, Mori H, Fukumura T, Suhara T, Higuchi M. In vivo positron emission tomographic imaging of glial responses to amyloid-beta and tau pathologies in mouse models of Alzheimer's disease and related disorders. J Neurosci 2011;31(12):4720-4730.
21. Jonsson T, Stefansson H, Steinberg S, Jonsdottir I, Jonsson PV, Snaedal J, Bjornsson S, Huttenlocher J, Levey AI, Lah JJ, Rujescu D, Hampel H, Giegling I, Andreassen OA, Engedal K, Ulstein I, Djurovic S, Ibrahim-Verbaas C, Hofman A, Ikram MA, van Duijn CM, Thorsteinsdottir U, Kong A, Stefansson K. Variant of TREM2 associated with the risk of Alzheimer's disease. N Engl J Med 2013;368(2):107-116.
Figures