0072
Optimized Subspace-Based J-Resolved MRSI for Simultaneous Metabolite and Neurotransmitter Mapping1Department of Bioengineering, University of Illinois Urbana-Champaign, Urbana, IL, United States, 2Beckman Institute for Advanced Science and Technology, Urbana, IL, United States
Synopsis
J-resolved 1H-MRSI offers improved molecular specificity by encoding the J-coupling evolution of different molecules at multiple TEs. The addition of another encoding dimension poses both challenges and flexibility for optimizations in data acquisition and reconstruction. This work presents further optimized J-resolved MRSI acquisition and reconstruction strategies for high-resolution, 3D metabolite, and neurotransmitter mapping. Specifically, estimation-theoretic TE selection within a union-of-subspaces (UoSS) framework was analyzed for optimized separation of metabolite and neurotransmitter signals. Both simulation and in vivo studies have been conducted. Promising results in terms of simultaneously high-resolution mapping of major metabolites, Glx, and GABA are provided.
Introduction
J-resolved 1H-MRSI can improve quantification of metabolite and neurotransmitter signals by encoding their J-coupling evolutions at multiple TEs1-5. Meanwhile, the addition of another encoding dimension to the high-dimensional MRSI problems poses significant technical challenges as well as more flexibility for optimizations in data acquisition and reconstruction. Recently, subspace imaging has been shown as an effective approach to accelerate J-resolved MRSI by exploring the spatial-temporal-TE correlations within multiple dimensions 6-9. It has also been recognized that choosing an optimized set of arbitrarily spaced TEs instead of the conventional uniform-TE distribution offers improved estimation of specific molecules of interest 8-10 . Highly accelerated J-resolved MRSI has been demonstrated using sparse sampling in a (k,t,tJ)-space with limited TE sampling8-9. This work presents a new optimized J-resolved MRSI acquisition and reconstruction method for fast, high-resolution, 3D metabolite, and neurotransmitter mapping of the brain. Specifically, we performed estimation-theoretic TE selection within a union-of-subspaces (UoSS) framework for optimized separation of metabolite and neurotransmitter signals, and described a joint subspace and spatially constrained reconstruction for high-resolution noisy J-resolved data acquired at the optimized TEs. Simulation and in vivo studies were performed to evaluate our method, which produced promising results in terms of fast, high-resolution mapping of major metabolites, Glx, and GABA simultaneously.Theory and methods
To optimize the separation and estimation of metabolite and neurotransmitter components in the J-resolved MRSI data, we use a different adaptation of the general UoSS model11-12. Specifically, assuming the removal of water/lipid signals, we represent the image function of interest as$$ \rho(\textbf{r},t_2,t_1) = \sum_{l_{meta}=1}^{L_{meta}}c_{l_{meta}}(\textbf{r})v_{l_{meta}}(t_2,t_1) + \sum_{l_{glx}=1}^{L_{glx}}c_{l_{glx}}(\textbf{r})v_{l_{glx}}(t_2,t_1) + \sum_{l_{gaba}=1}^{L_{gaba}}c_{l_{gaba}}(\textbf{r})v_{l_{gaba}}(t_2,t_1),[1] $$ where $$$t_2$$$ denotes the chemical shift dimension, $$$t_1$$$ the J-evolution (or TE) dimension. The basis $$$\{v_{l_{meta}}(t_2,t_1)\}$$$, $$$\{v_{l_{glx}}(t_2,t_1)\}$$$, and $$$\{v_{l_{gaba}}(t_2,t_1)\}$$$ span the multi-TE subspaces for the major metabolites(e.g., NAA, Cr, Cho, mI etc), Glx (glutamate+glutamine) and GABA, respectively (can be learned from training data), with $$$c_{x(\cdot)}$$$ the spatial coefficient to determine. Compared to the individual-molecule subspace expansion 8-12, this model allows further reduction of dimensionality and enables TE optimization specific to the task of separating metabolites, Glx, and GABA.
More specifically, Eq. [1] can be rewritten in a discretized form as :
$$ \textbf{d} = \begin{bmatrix}\textbf{V}_{meta},\textbf{V}_{glx},\textbf{V}_{gaba}\end{bmatrix} \begin{bmatrix}\textbf{c}_{meta}\\ \textbf{c}_{glx}\\ \textbf{c}_{gaba} \end{bmatrix} + \textbf{n}, [2] $$
where $$$\textbf{d}$$$ contains the TE-concatenated data, $$$\textbf{V}_{x}$$$ are matrix representations of the component-specific subspaces (with dimensionality $$$L_{x(\cdot)}$$$), $$$\textbf{c}_{x}$$$ the spatial coefficients for respective components, and $$$\textbf{n}$$$ the white Gaussian measurement noise with standard deviation $$$\delta$$$. Eq. [2] affords an easier estimation-theoretic analysis, i.e., denoting $$$\hat{\textbf{c}} = [\hat{\textbf{c}}_{meta}^H, \hat{\textbf{c}}_{glx}^H, \hat{\textbf{c}}_{gaba}^H]$$$ as coefficient estimates, the Cramer-Rao lower bound (CRLB) for $$$\hat{\mathbf{c}}$$$ can be derived as :
$$ \textit{COV}(\hat{\textbf{c}}) \geqslant {\delta^{2}} (\textbf{V}^{H}\textbf{V})^{-1} = {\delta^{2}} \begin{bmatrix} \textbf{V}_{meta}^{H}\textbf{V}_{meta} & \textbf{V}_{meta}^{H}\textbf{V}_{glx} & \textbf{V}_{meta}^{H}\textbf{V}_{gaba}\\ \textbf{V}_{glx}^{H}\textbf{V}_{meta} & \textbf{V}_{glx}^{H}\textbf{V}_{glx} & \textbf{V}_{glx}^{H}\textbf{V}_{gaba} \\ \textbf{V}_{gaba}^{H}\textbf{V}_{meta} & \textbf{V}_{gaba}^{H}\textbf{V}_{glx} & \textbf{V}_{gaba}^{H}\textbf{V}_{gaba} \end{bmatrix} ^{-1}, [3] $$
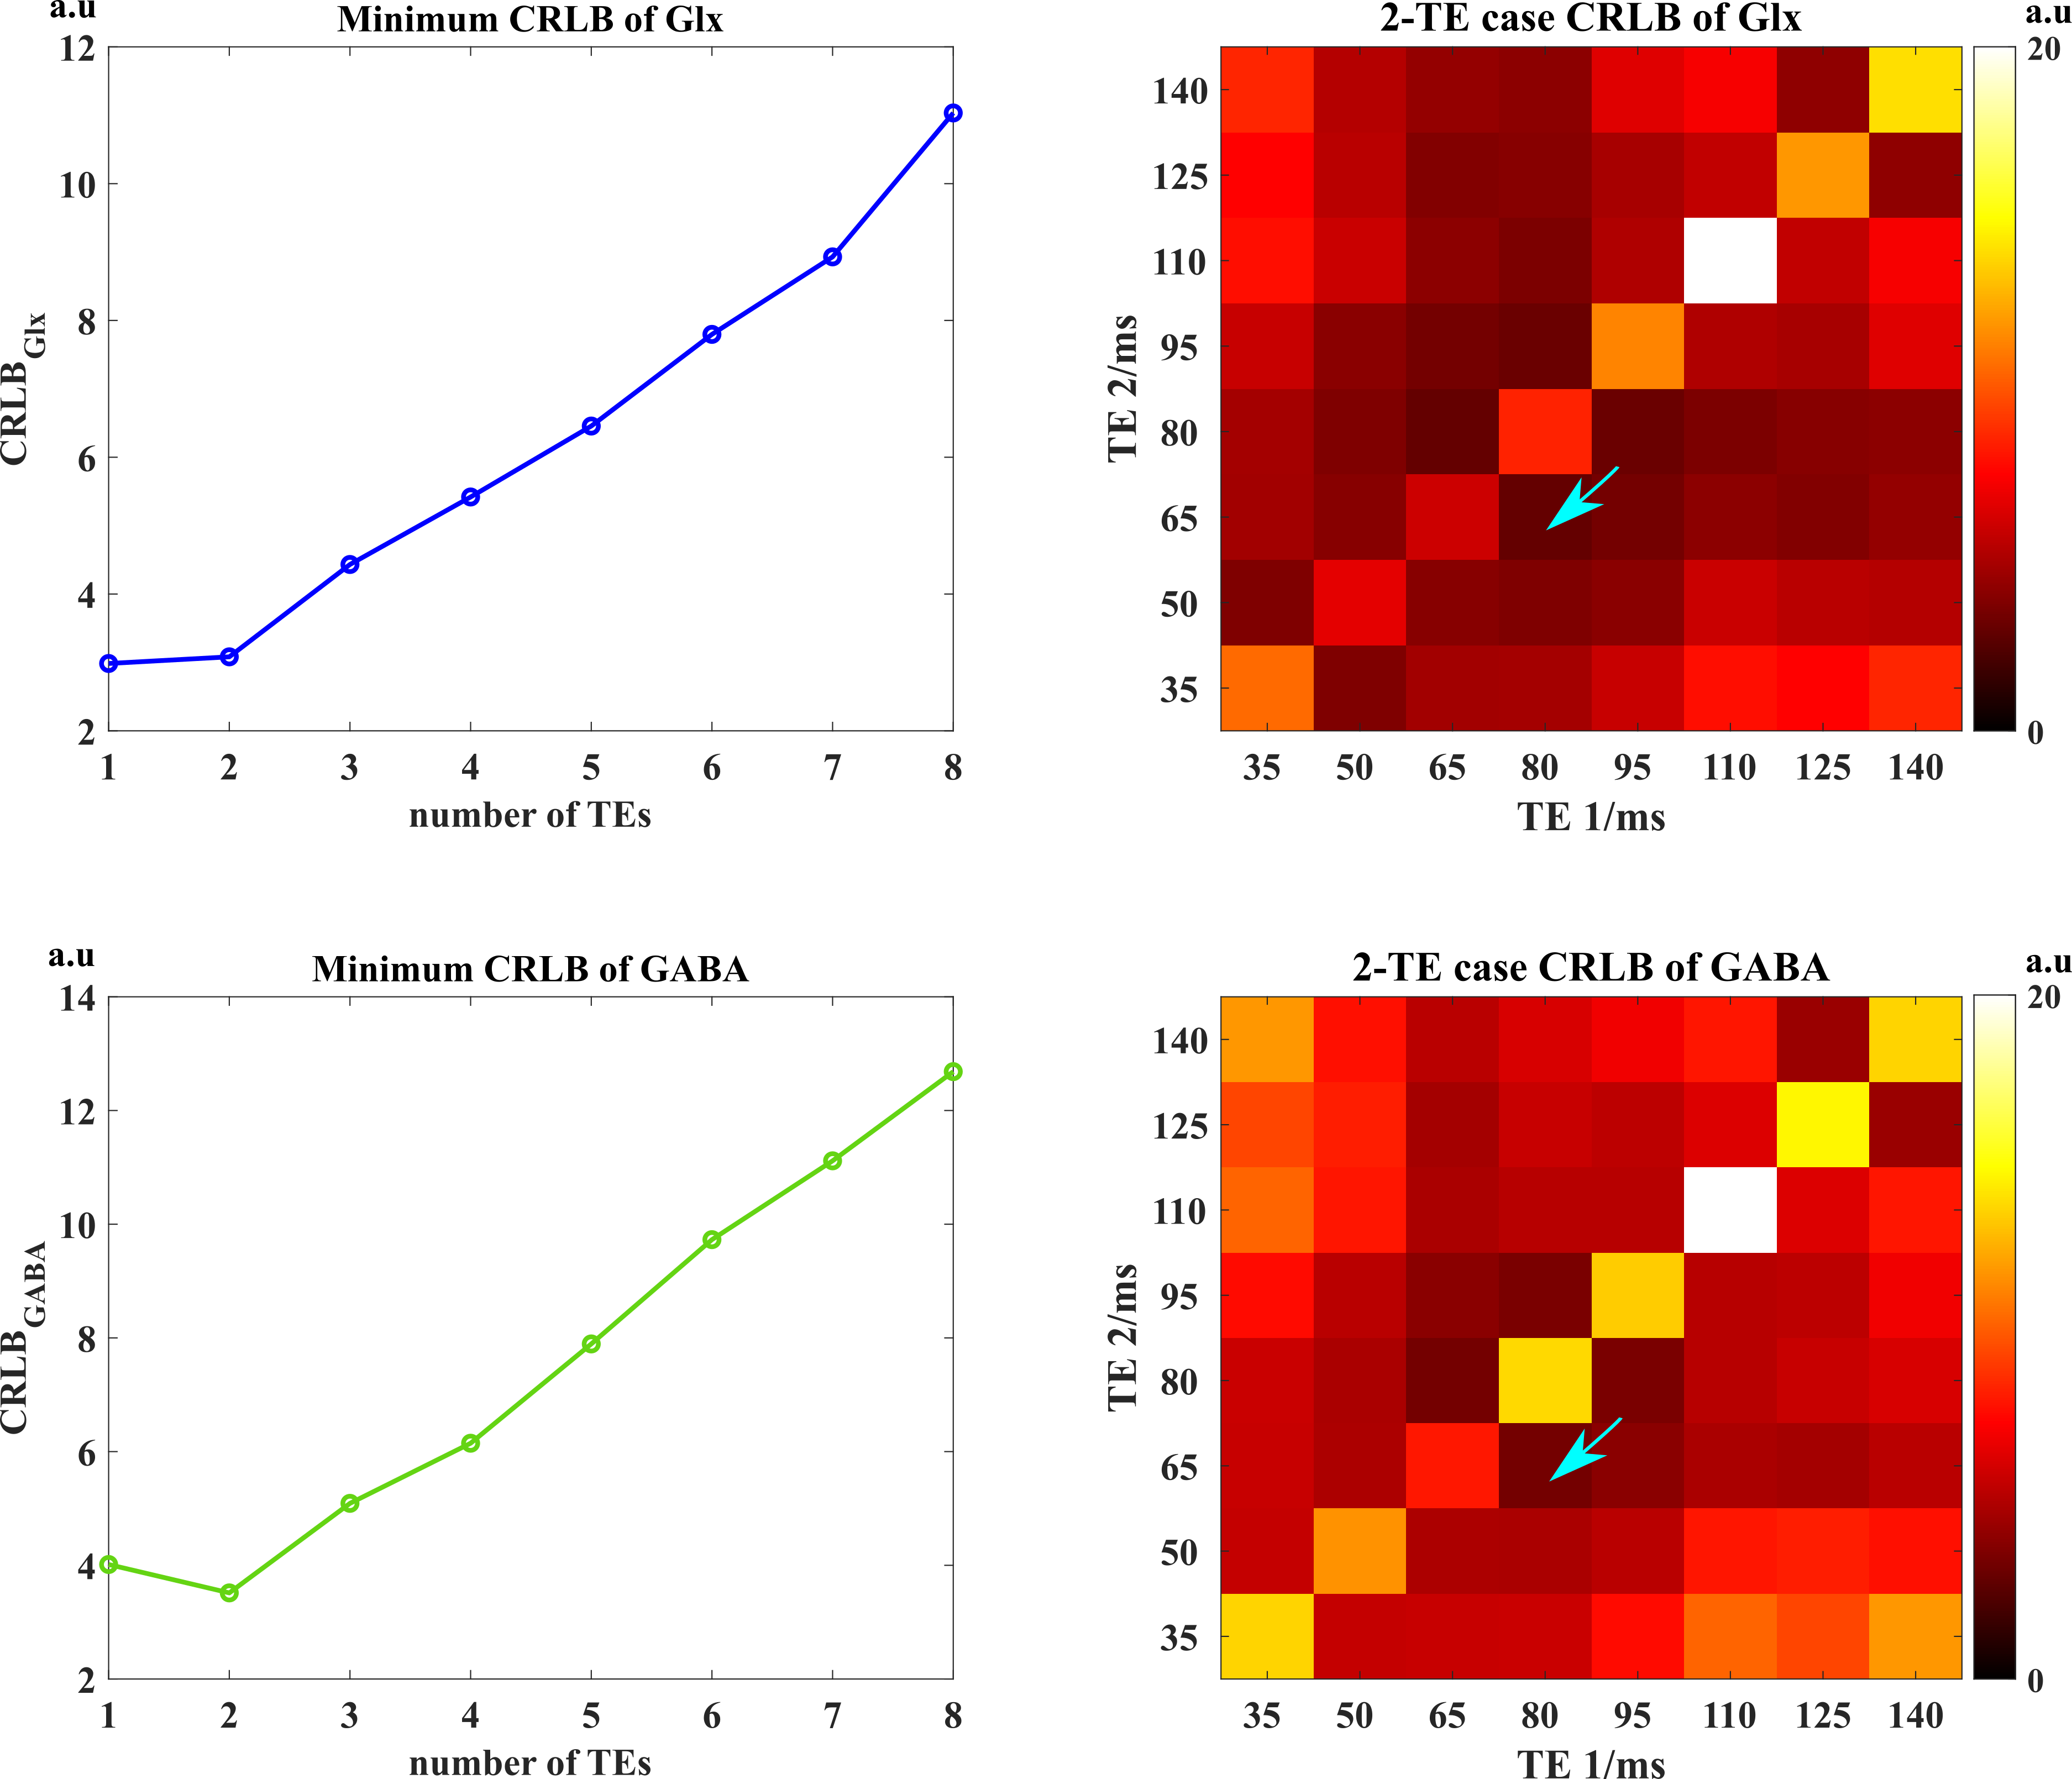
where $$$ {\delta^{2}} (\textbf{V}^{H}\textbf{V})^{-1}$$$ is inverse Fisher Information Matrix (iFIM). The CRLB for individual component estimates can then be obtained by summing up the diagonal elements in the iFIM that match the indices of metabolite, Glx, and GABA basis, respectively. Then, we can choose TEs by minimizing the CRLBs. More specifically, we use a greedy algorithm to gradually add TE to our selected subset until the minimum CRLB does not decrease further (under an equivalent-time comparison as in 8-10). This efficient scheme yielded very similar minimum CRLB by exhausting arbitrary combinations, and the same results for a 2-TE case (Fig. 1). Note that in contrast to the CRLB analysis using the spectral quantification model8-10, our optimization is done directly for the UoSS model used for reconstruction and targeted specifically for the problem of metabolite/neurotransmitter separation. The effects of other molecular parameters, e.g., T2, are embedded in the learned subspaces. The reconstruction was done using a subspace constrained and joint-sparsity regularized formulation, similarly described in 7(algorithmic details omitted here)
Results
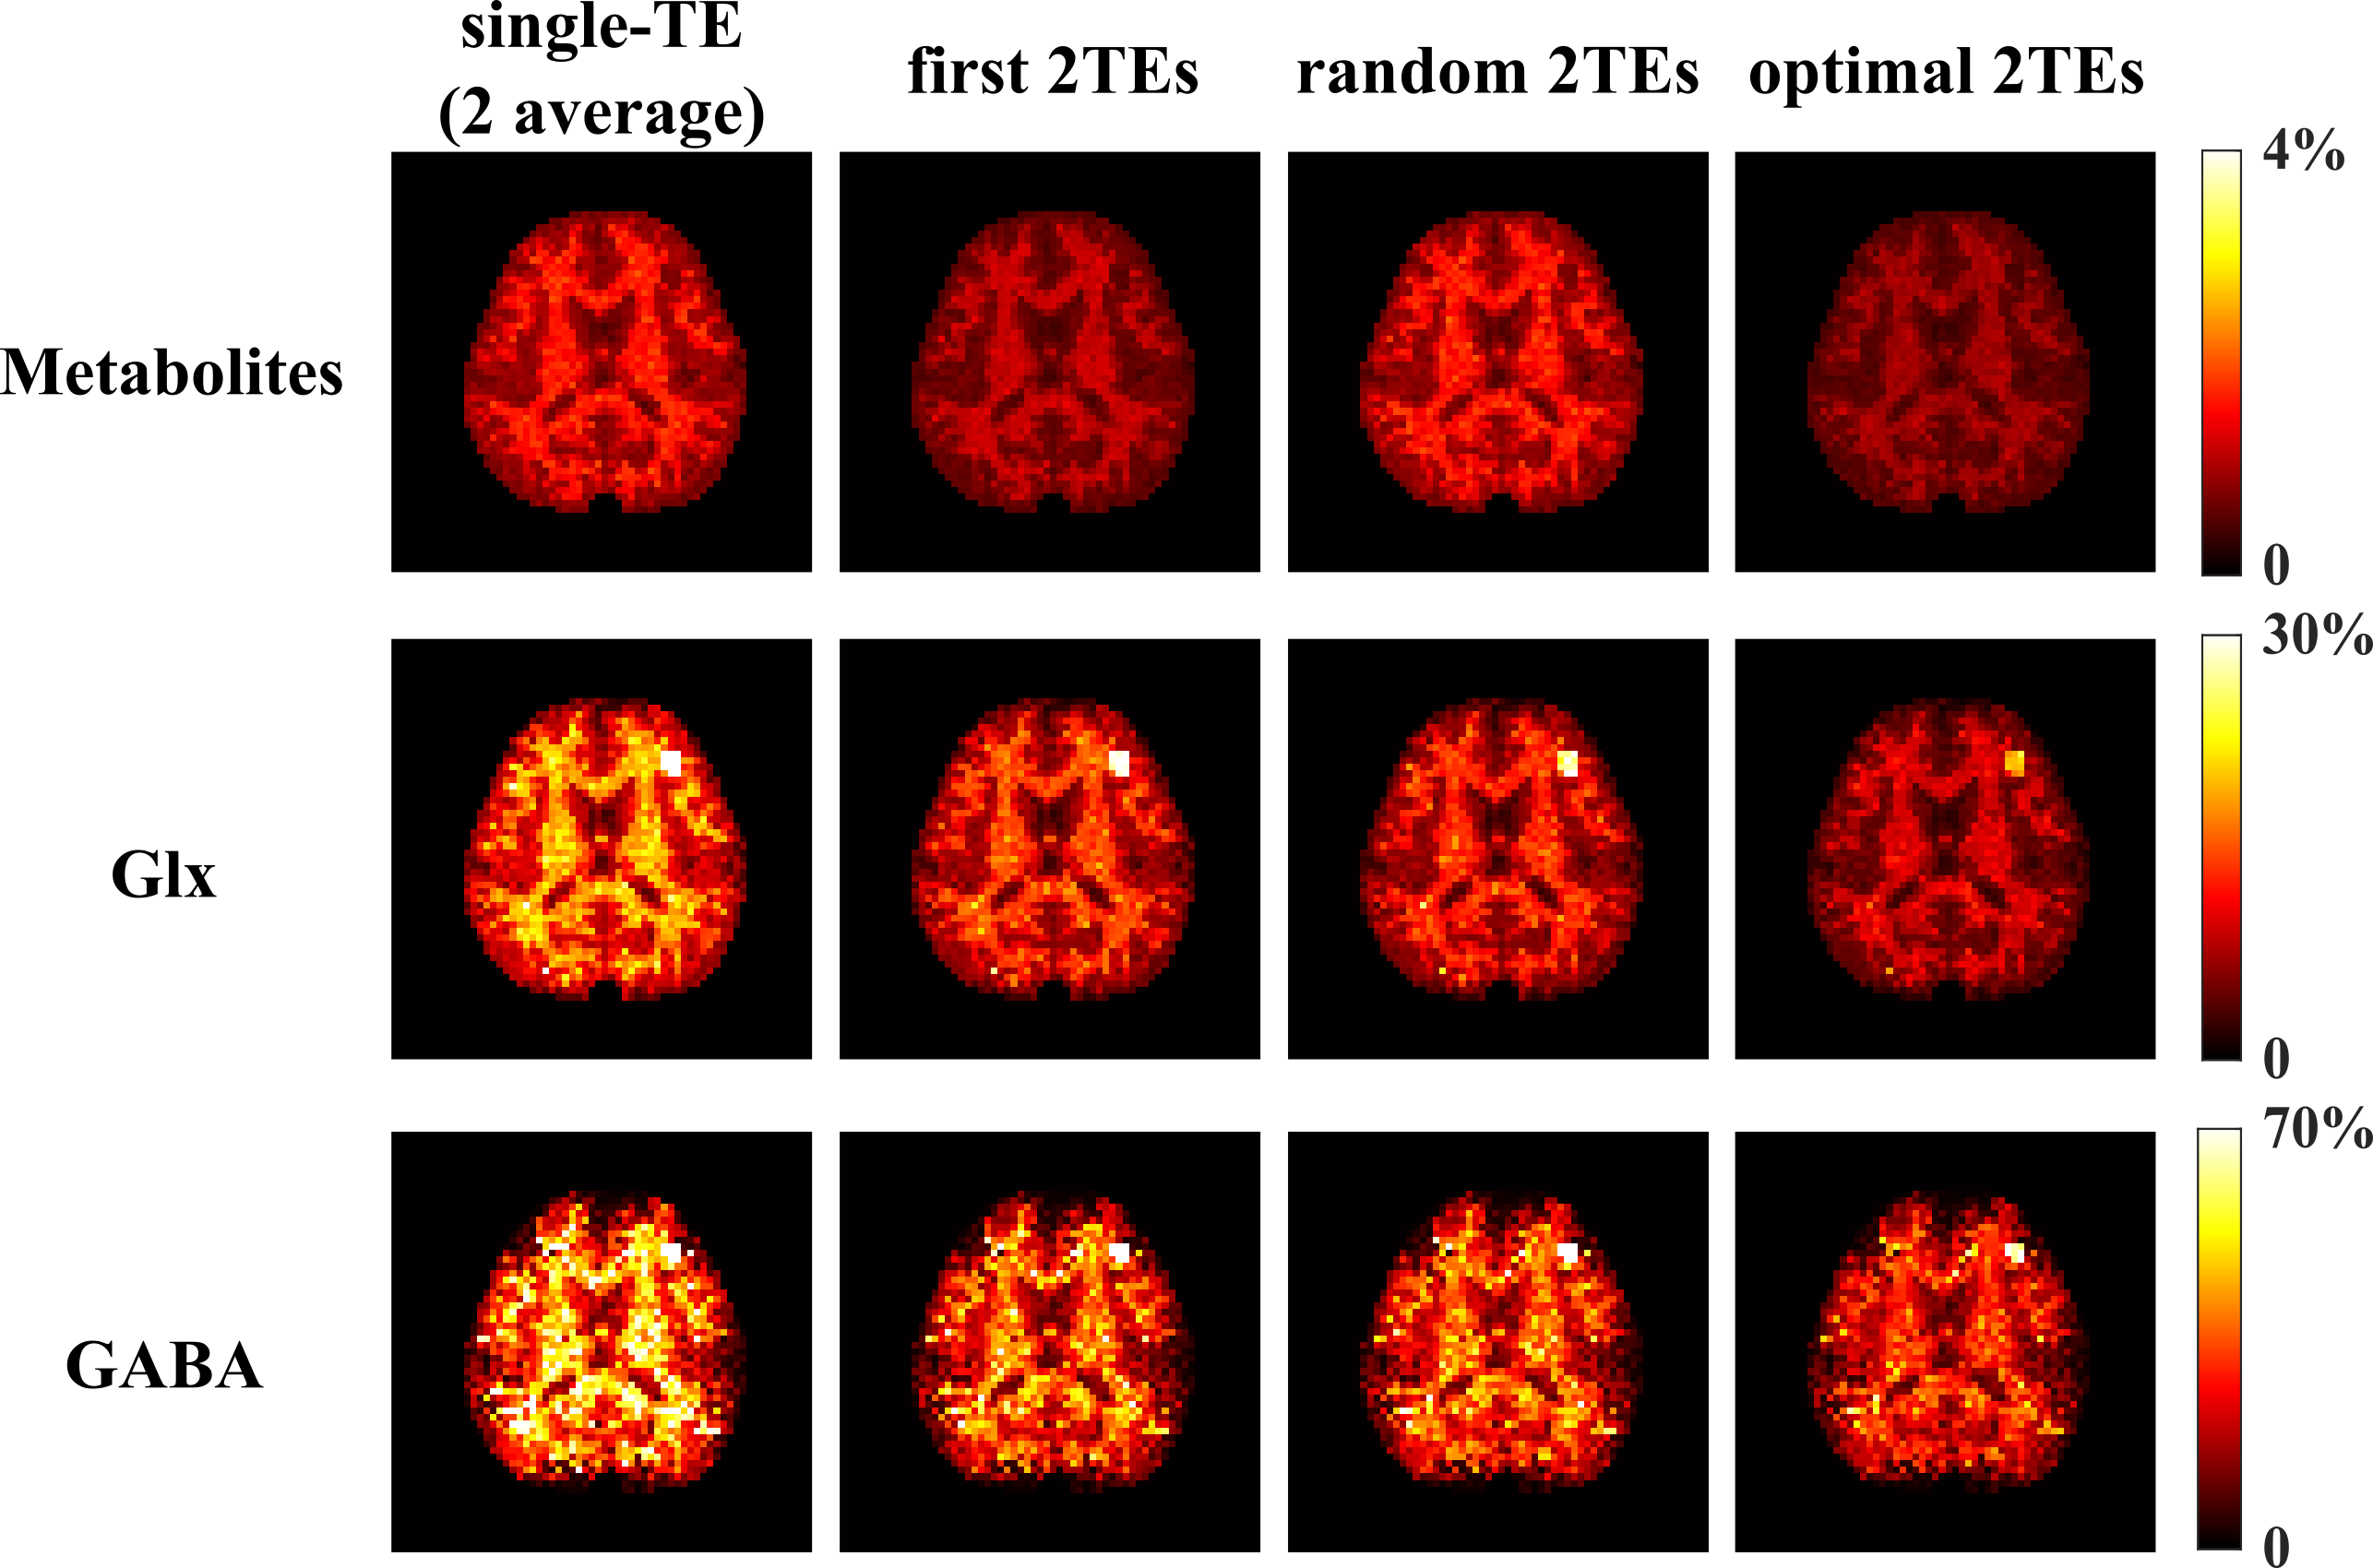
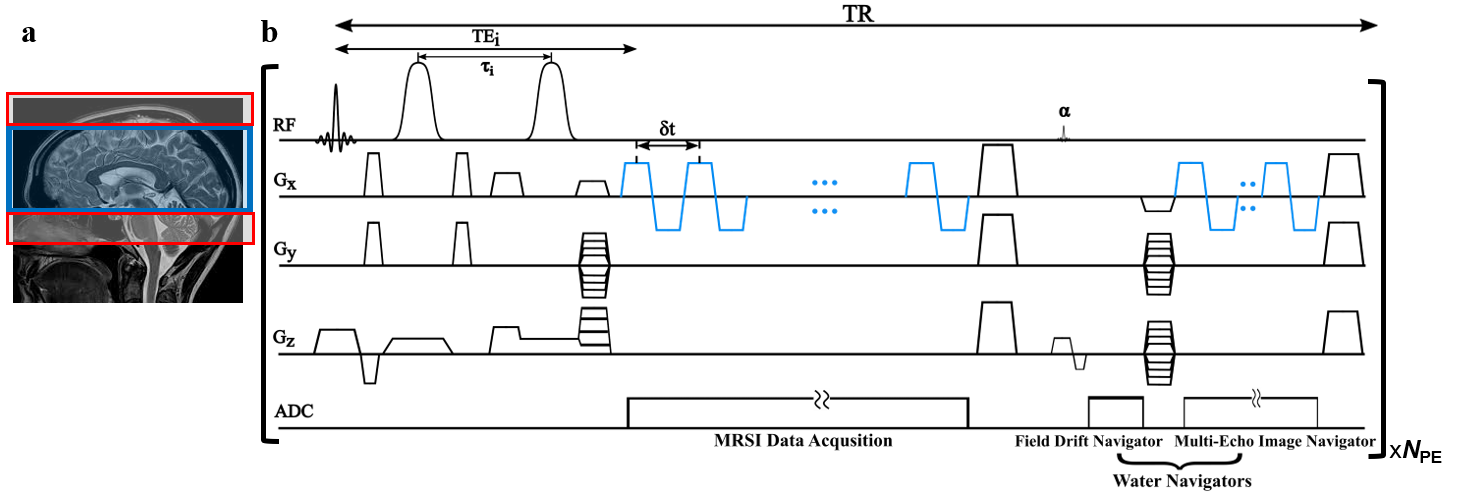
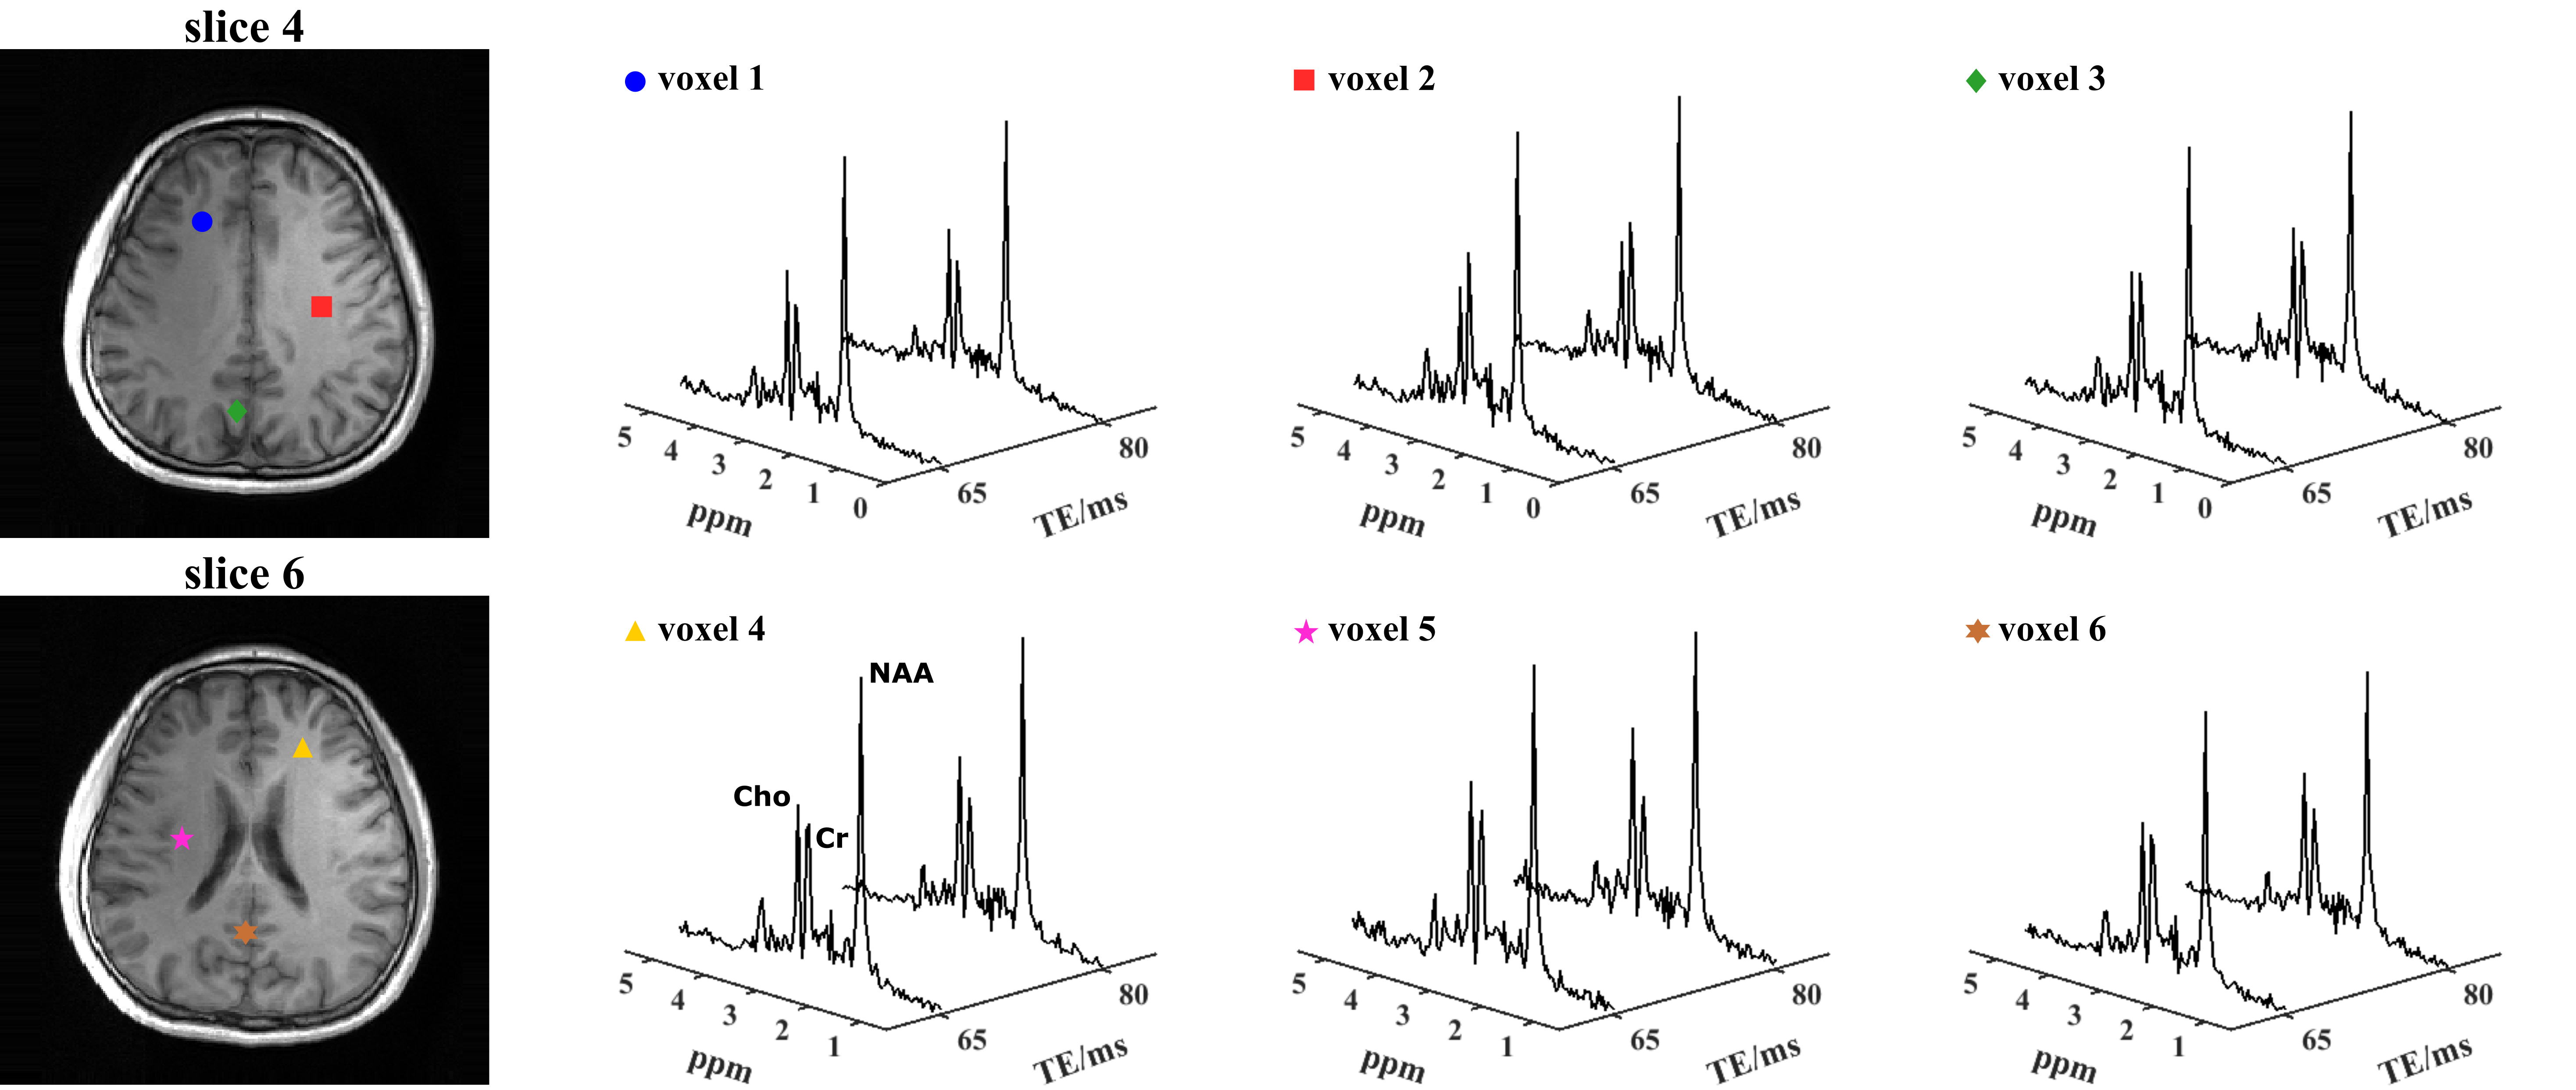
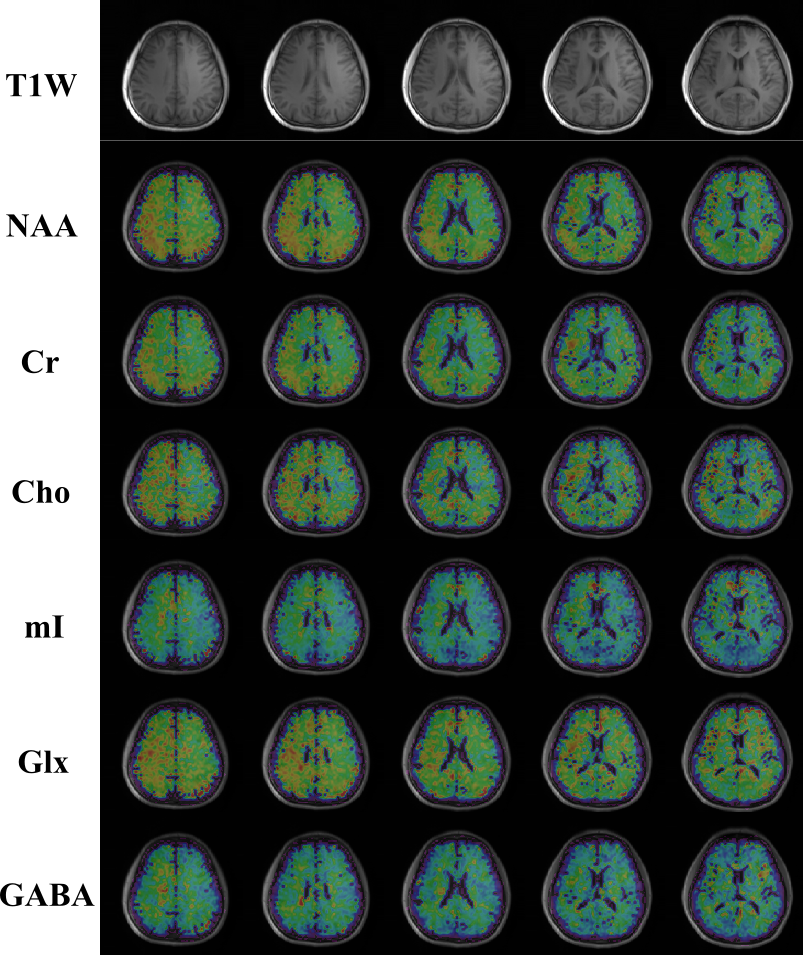
We evaluated the proposed method using both simulations and experimental data. A computational J-resolved MRSI phantom was constructed by extending the design in Ref. 8. Monte-Carlo simulations with independent noisy data realizations were performed to validate our optimized TE choices. Simulation results demonstrate the feasibility of selecting optimal TEs using greedy-search in the 2-TE case (Fig. 1). The comparison of normalized standard deviation maps of the coefficient estimates coefficient for metabolite, Glx, and GABA components under different alternative TE choices confirm the improvement (reduction in estimation variances) offered by the optimized TEs.High-resolution, 3D brain data were acquired on a Prisma 3T (IRB approved) scanner using a fast MRSI sequence previously described13, with different TEs realized by changing the delays between the pair of adiabatic refocusing pulses. The sequence also enables interleaved water navigators for B0 drift correction, B0 mapping, and sensitivity estimation, allowing the generation of 3D J-resolved MRSI data at optimized TE of 65+80ms in about 13.8mins. Figures 4-5 show reconstruction from the in vivo data, demonstrating high-quality TE-dependent spectra and high-resolution, high-SNR maps of both metabolites, Glx and GABA.
Conclusion
We proposed a new method to further optimize J-resolved MRSI using estimation-theoretic analysis of a union-of-subspaces model. TE combinations are optimized by minimizing CRLB using a greedy search. Monte-Carlo analysis validated the optimized TE selection. High-SNR, 3D metabolite, and neurotransmitter maps with a nominal voxel size of 3.4×3.4×5.3 mm3 can be simultaneously produced within 14mins using the optimized TEs.Acknowledgements
No acknowledgement found.References
[1] Adalsteinsson E, Spielman DM. Spatially resolved two-dimensional spectroscopy. Magn Reson Med. 1999;41:8-12.
[2] Schulte RF, Lange T, Beck J, Meier D, Boesiger P. Improved two‐dimensional J‐resolved spectroscopy. NMR Biomed. 2006;19:264-70.
[3] Li Y, Chen AP, Crane JC, et al., Three-dimensional J-resolved H-1 magnetic resonance spectroscopic imaging of volunteers and patients with brain tumors at 3T. Magn Reson Med, 2007;58:886-892.
[4] Wilson NE, Iqbal Z, Burns BL, et al. Accelerated five-dimensional echo planar J-resolved spectroscopic imaging: Implementation and pilot validation in human brain. Magn Reson Med. 2016;75:42-51.
[5] Bogner W, Hangel G, Esmaeili M, Andronesi OC, 1D-spectral editing and 2D multispectral in vivo 1H-MRS and 1H-MRSI - Methods and applications, Analytical Biochemistry, 2017;529:48-64.
[6] Ma C, Lam F, Liu Q, and Liang ZP, Accelerated high-resolution multidimensional 1H-MRSI using low-rank tensors. ISMRM, 2016, p. 379.
[7] Lam F, Cheng B, Liang ZP, Accelerated J-resolved MRSI using joint subspace and sparsity constraints, ISMRM, 2017, p. 1202.
[8] Tang L, Zhao Y, Li Y, et al., Accelerated J‐resolved 1H‐MRSI with limited and sparse sampling of (‐space. Magnetic Resonance in Medicine. 2019;85:30-41.
[9] Zhao Y, Li Y, Xiong J, et al., Rapid High-Resolution Mapping of Brain Metabolites and Neurotransmitters Using Hybrid FID/SE-J-Resolved Spectroscopic Signals. ISMRM, 2020. p. 0366.
[10] Bolliger CS, Boesch C, and Kreis R, On the use of Cramér–Rao minimum variance bounds for the design of magnetic resonance spectroscopy experiments. NeuroImage, 2013;83:1031-1040.
[11] Ma C, Lam F, Johnson CL, Liang ZP. Removal of nuisance signals from limited and sparse 1H MRSI data using a union-of-subspaces model. Magn Reson Med. 2016;75:488‐497.
[12] Li Y, Lam F, Clifford B, Liang ZP. A subspace approach to spectral quantification for MR spectroscopic imaging. IEEE Transactions on Biomedical Engineering. 2017;64:2486-2489.
[13] Ho RJ, Lam F, High-resolution 3D spin-echo MRSI using interleaved water navigators, sparse sampling and subspace-based processing, IEEE-EMBC, 2020, pp. 1465-1468.
Figures