0062
Radiomics model based on MAGIC acquisition for predicting neoadjuvant systemic treatment response in triple-negative breast cancer.
Nabil Elshafeey1, Gaiane M. Rauch2, Aikaterini Kotrotsou3, Beatriz E. Adrada1, Rosalind P. Candelaria1, Abeer H. Abdelhafez1, Huiqin Chen4, Jia Sun4, Medine Boge1, Rania M. M Mohamed1, Benjamin C. Musall5, Jong Bum Son5, Shu Zhang6, Jason B. White7, Brandy Willis5, Elizabeth Ravenberg7, Wei Peng4, Stacy L. Moulder7, Wei Yang1, Mark D. Pagel6, Jingfei Ma5, and Ken-Pin Hwang5
1Breast Imaging, The University of Texas MD Anderson Cancer Center, Houston, TX, United States, 2Breast and Abdominal imaging, The University of Texas MD Anderson Cancer Center, Houston, TX, United States, 3The University of Texas MD Anderson Cancer Center, Houston, TX, United States, 4Biostatistics, The University of Texas MD Anderson Cancer Center, Houston, TX, United States, 5Imaging Physics, The University of Texas MD Anderson Cancer Center, Houston, TX, United States, 6Cancer Systems Imaging, The University of Texas MD Anderson Cancer Center, Houston, TX, United States, 7Breast Medical Oncology, The University of Texas MD Anderson Cancer Center, Houston, TX, United States
1Breast Imaging, The University of Texas MD Anderson Cancer Center, Houston, TX, United States, 2Breast and Abdominal imaging, The University of Texas MD Anderson Cancer Center, Houston, TX, United States, 3The University of Texas MD Anderson Cancer Center, Houston, TX, United States, 4Biostatistics, The University of Texas MD Anderson Cancer Center, Houston, TX, United States, 5Imaging Physics, The University of Texas MD Anderson Cancer Center, Houston, TX, United States, 6Cancer Systems Imaging, The University of Texas MD Anderson Cancer Center, Houston, TX, United States, 7Breast Medical Oncology, The University of Texas MD Anderson Cancer Center, Houston, TX, United States
Synopsis
Early identification of treatment response to neoadjuvant systemic therapy (NAST) in Triple Negative Breast Cancer (TNBC) patients is important for appropriate treatment selection and response monitoring. In this study we evaluated the ability of a radiomic model extracted from a novel sequence, Magnetic Resonance Image Compilation (MAGIC), acquired before treatment initiation, to predict NAST response in TNBC. Our results showed that the radiomic signature derived from MAGIC maps (T1, PD and T2) can help differentiate responders from non-responders at baseline evaluation.
Introduction
Magnetic Resonance Image Compilation (MAGIC) is capable of simultaneous quantitation of several tissue water properties including longitudinal (T1) and transverse (T2) relaxation times, and proton density (PD). Performing radiomic analysis on these quantitative maps may be advantageous because most MR images are non-quantitative and subject to image intensity variations from scan parameter changes and shading. In this study, we developed a MAGIC-based radiomics model for predicting NAST response in TNBC.Methods
This IRB approved prospective ARTEMIS trial (NCT02276443) study included 80 women (61 training dataset, 19 testing dataset) diagnosed with stage I-III TNBC. All patients were scanned with MAGIC on a 3T scanner prior to NAST. Scan parameters were: TR=4000, ETL=12, slice thickness/spacing=4mm/1mm, FOV=340-360, matrix=320x256, ASSET acceleration factor=2. Total scan time was typically 6:08 for 30 slices. T1, T2 and PD maps were generated from the source images using SyMRI (SyntheticMR, Linkoping, Sweden). Histopathology at surgery was used to determine pathologic complete response (pCR) or non-pCR to NAST. 3D contouring of the tumors was performed by a breast radiologist. Using an in-house toolbox, 310 statistical and textural features were extracted from each of 3 maps (T1, T2, PD), resulting in a total of 930 features per patient. Radiomic features were compared between pCR and non-pCR using Wilcoxon Rank Sum test and Fisher’s exact test. To build a multivariate, predictive model, logistic regression with elastic net regularization was performed for texture feature selection. The elastic net is a regularized regression method that linearly combines the penalties of the lasso and ridge methods. The tuning parameter was optimized using 5-fold cross-validation based on the average area under curve (AUC) of each fold of a cross-validation using training data. Then the testing data were used to compare the models by AUC and accuracy. Accuracy was defined as a fraction of correct predictions of our model over total number of predictions. All statistical analyses were performed using R software.Results
15 PD, 8 T1 and 6 T2 radiomic features (Table 1-3) were able to predict pCR status with AUC >65% in both training and testing cohort. The top performing radiomic features for PD map were Variance and Sum average. The top performing radiomic features for T2 and T1 maps were Cluster prominence, Correlation and Energy. The radiomic signature of T2-volume map that included 17 features had best performance, with an AUC of 0.724 and 0.7 with 95% CI (0.421 - 0.979) in training and testing cohort, respectively. The radiomic signature based on T2-map that included 20 features had AUC of 0.735 and 0.756 with 95% CI (0.512 - 0.999) in both training and testing cohort, respectively (figure 2). Multivariate T1and PD-based model did not achieve statistical significance.Discussion
Our study showed that a MAGIC-based radiomics signature could potentially predict NAST response in TNBC before treatment. To the best of our knowledge, this is the first application of MAGIC in breast. By acquiring multiple images with multiple contrasts, fitting quantitative relaxation parameters enables correction of several system- and patient-dependent variables affecting image intensity. Thus statistical and radiomic analysis of the pixel intensity values may more accurately reflect the intrinsic properties of tissue. However, the acquisition of MAGIC is usually longer and the images tend to be more sensitive to motion when compared to conventional sequences. Although still preliminary and requiring further validation, our findings show to the potential application of MAGIC in improving response assessment in TNBC.Conclusion
MAGIC-based radiomic features are potentially useful to identify a NAST response phenotype in TNBC before the initiation of the treatmentAcknowledgements
No acknowledgement found.References
No reference found.Figures
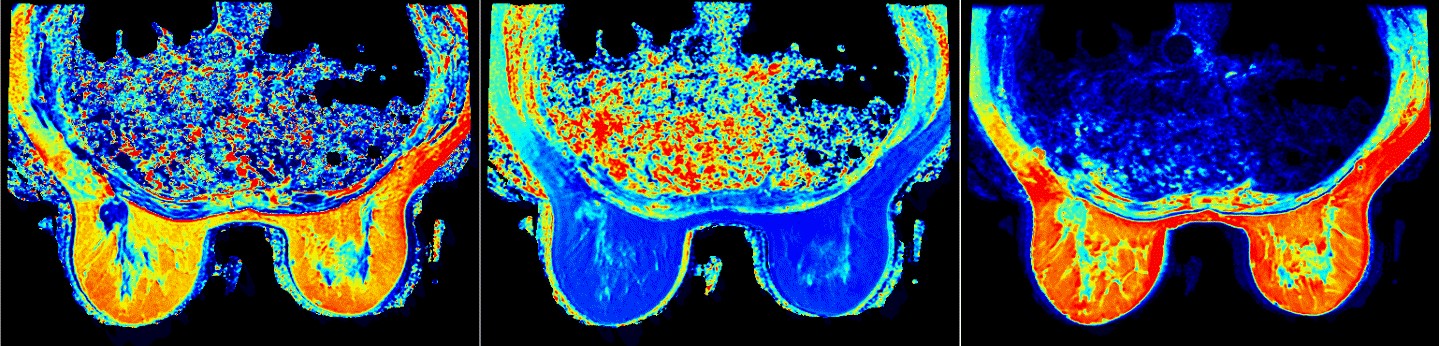
Figure 1: Example T1, T2, and
PD maps processed from the MAGIC sequence using SyMRI
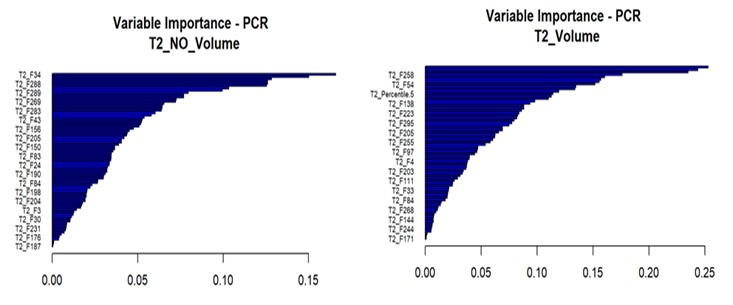
Figure 2: The variable importance features within the T2 radiomic model
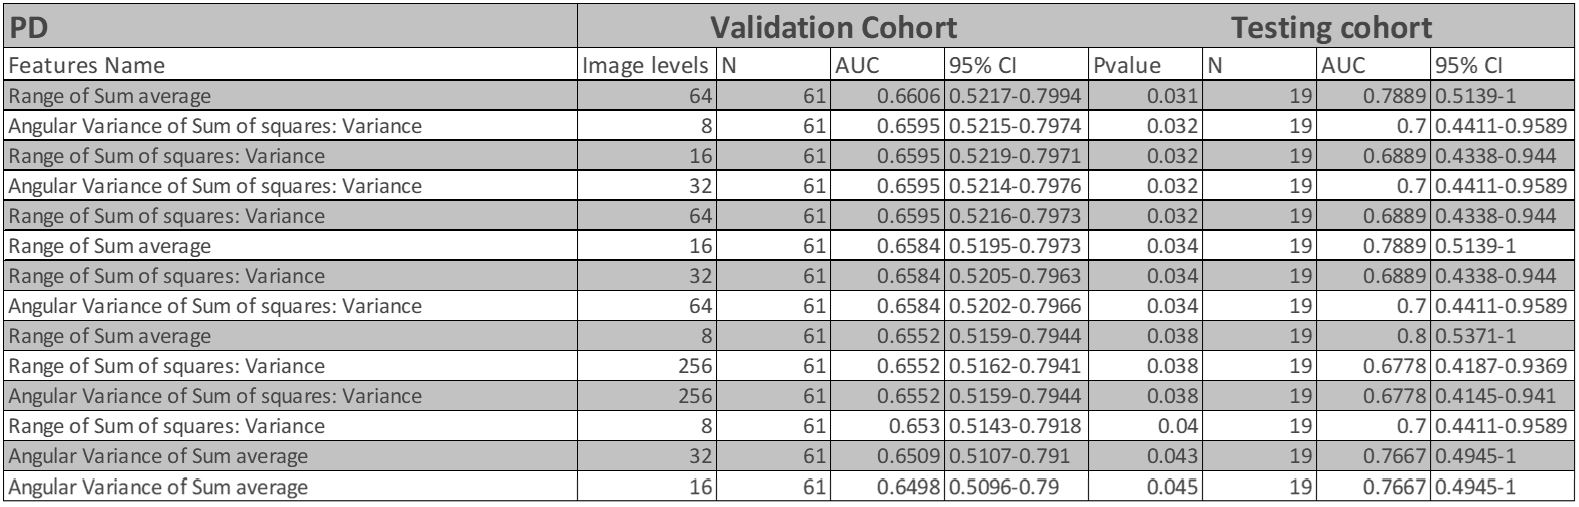
Table 1:The AUC and 95% CI of both training and testing cohort in PD radiomic map
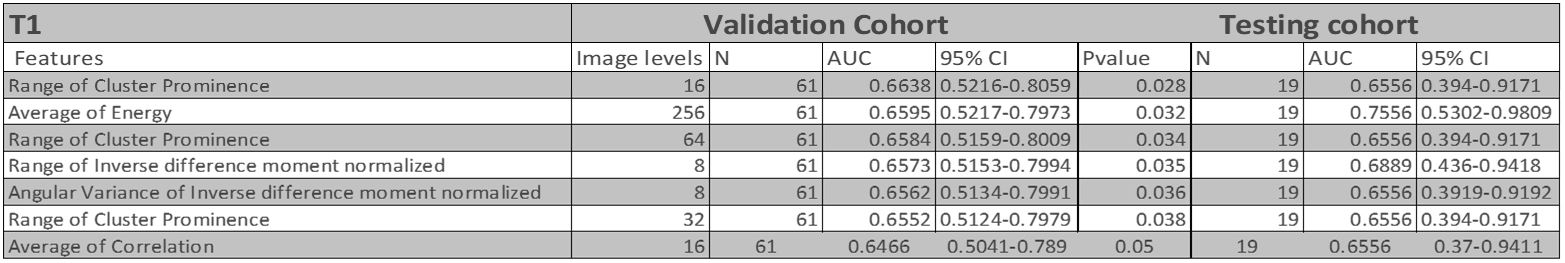
Table 2: The AUC and 95% CI of both training and testing cohort in T1 radiomic map
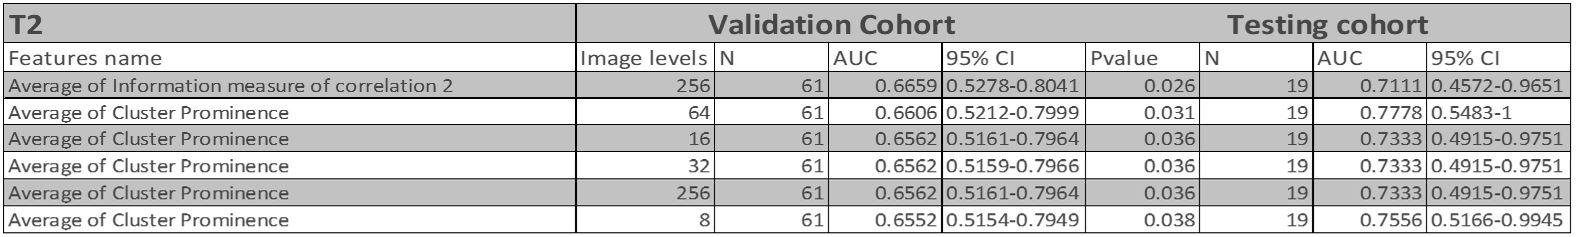
Table 3: The AUC and 95% CI of both training and testing cohort in T2 radiomic map