0059
Radiomics based classification of breast mass with a multiparametric MRI protocol with DCE-MRI, T2, and DWI1Shanghai key lab of magnetic resonance, shanghai, China, 2Tongji Medical College, Huazhong University of Science and Technology, Department of Radiology,Tongji Hospital, Wuhan, Hubei Province, China, 3Siemens Healthcare, MR Scientific Marketing, shanghai, China
Synopsis
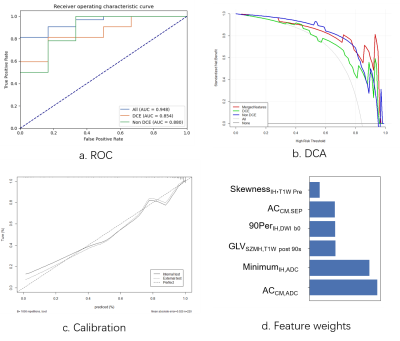
DCE is the most useful MRI sequence for breast cancer diagnosis, but it often suffers from a high rate of false positive. To overcome this problem, we combined radiomics features from DCE, T2W, and DWI images to build a new machine learning model for differentiation of breast cancer. Our model achieved an AUC of 0.948 in an internal test cohort and 0.944 in an external test cohort, and reduced the false positive rate effectively. It was also found, first-order and texture features from ADC map made significant contributions to the model, suggesting the value ADC in breast cancer classification.
INTRODUCTION
Breast cancer is the most commonly diagnosed cancer in females, accounting for 11.6% of new cancer cases in 2018 (19.2% for Chinese females) 1, 2. MRI is a common imaging modality for breast cancer detection 3, and previous studies showed that dynamic contrast material-enhanced (DCE) MRI achieved the highest sensitivity in identifying malignant breast cancers by using a standard protocol and kinetic data processing4, 5. However, DCE also suffered from a high false-positive rate. Thus, we built a radiomics model based on multi-parametric MRI images for better differentiation between benign and malignant breast cancers.METHODS
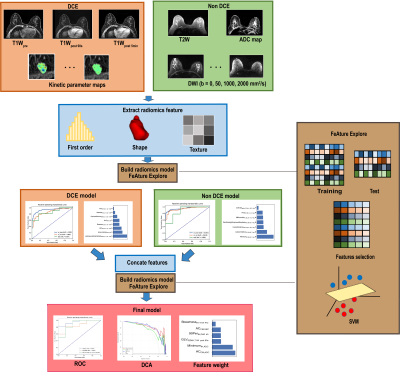
Data: 196 pathologically confirmed cases with 221 lesions (malignant 152/benign 69) were included in this study. The dataset was split to a training cohort (151) and an internal test cohort (38) by scanning date. 33 cases scanned with a slightly different set of parameters were used as an external test cohort. T2W, diffusion-weighted imaging (DWI), apparent diffusion coefficient (ADC) map, DCE, and 6 kinetic maps were scanned or calculated for all cases.Analysis: All images were registered to T1Wpost 90s with lesion segmented by a radiologist. We used an open-source software FeatureExplorer(6) for feature extraction and model building. FeatureExplorer uses PyRadiomics as the backend for feature extraction, and allows for easy comparison of different combinations of algorithms and hyper-parameters to find the best classification model. After feature normalization, Pearson Correlation Coefficient was used to remove redundant features. Recursive feature elimination (RFE) was used for feature selection with 5-fold cross-validation in the training cohort. Both supported vector machine (SVM) and logistic regression (LR) were used as classifiers and one that yielded the best performance was chosen as the final model.
Evaluation: Model performance was evaluated with receiver operating characteristic (ROC) curve analysis, and calibration curve.
RESULTS
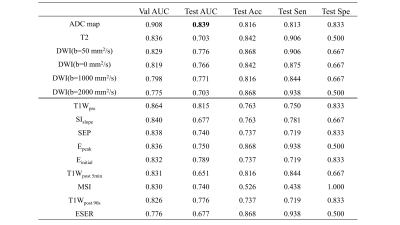
107 features were extracted from each of T1W, kinetic parameter maps, T2W, ADC map, and DWI. The ADC model archived an highest AUC (0.839 in the internal test cohort) in all images. The final model, which combined features from DCE model and Non-DCE DWI, achieved the highest AUCs (0.948 and 0.944 in internal and external test cohort, respectively), together with increased accuracy, positive predictive value, specificity, and decreased false-positive rate. Features from ADC map have higher weight for classification. DCA also showed better performance of the union model. Prediction reliability was also confirmed in the calibration curve.DISCUSSION
The AUC value of the non-DCE model is a little higher than that of the DCE model, indicating the value of DWI images for the diagnosis. The combined model achieved the best performance with an increased AUC of 0.948, and a decreased false-positive rate. The performance of the combined model was also validated with an external test cohort. DCA curves also shows the combined model yielded greater benefit for breast cancer patients in a substantial range of threshold probability, compared with the “treat all” or “treat none” strategies. The performance of ADC model and the contribution of ADC features in the combined model all suggest ADC map as a strong candidate for breast cancer classification, which may be attributed to its sensitivity to tissue microstructural changes.CONCLUSION
In summary, a combined radiomics model using features from multi-parametric MRI, especially those from DCE and ADC, can be used to accurately differentiate malignant and benign breast cancers, with an increased accuracy and a decreased false positive rate.Acknowledgements
No acknowledgement found.References
1. Bray F, Ferlay J, Soerjomataram I, Siegel RL, Torre LA, Jemal A. Global cancer statistics 2018: GLOBOCAN estimates of incidence and mortality worldwide for 36 cancers in 185 countries. CA Cancer J Clin 2018;68(6):394-424. doi: 10.3322/caac.21492
2. Feng RM, Zong YN, Cao SM, Xu RH. Current cancer situation in China: good or bad news from the 2018 Global Cancer Statistics? Cancer Commun (Lond) 2019;39(1):22. doi: 10.1186/s40880-019-0368-6
3. Mann RM, Cho N, Moy L. Breast MRI: State of the Art. Radiology 2019;292(3):520-536. doi: 10.1148/radiol.2019182947
4. Qiao M, Li C, Suo S, Cheng F, Hua J, Xue D, Guo Y, Xu J, Wang Y. Breast DCE-MRI radiomics: a robust computer-aided system based on reproducible BI-RADS features across the influence of datasets bias and segmentation methods. Int J Comput Assist Radiol Surg 2020;15(6):921-930. doi: 10.1007/s11548-020-02177-0
5. Chen X, Chen X, Yang J, Li Y, Fan W, Yang Z. Combining Dynamic Contrast-Enhanced Magnetic Resonance Imaging and Apparent Diffusion Coefficient Maps for a Radiomics Nomogram to Predict Pathological Complete Response to Neoadjuvant Chemotherapy in Breast Cancer Patients. J Comput Assist Tomogr 2020;44(2):275-283. doi: 10.1097/RCT.0000000000000978
6. Song Y, Zhang J, Zhang YD, Hou Y, Yan X, Wang Y, Zhou M, Yao YF, Yang G. FeAture Explorer (FAE): A tool for developing and comparing radiomics models. PLoS One 2020;15(8):e0237587. doi: 10.1371/journal.pone.0237587
Figures


