0058
BI-RADS Reading of Non-Mass Lesions on DCE-MRI and Differential Diagnosis Performed by Radiomics and Deep Learning
Jiejie Zhou1, Yan-Lin Liu2, Yang Zhang2, Jeon-Hor Chen2,3, Freddie J. Combs2, Ritesh Parajuli4, Rita S. Mehta4, Huiru Liu1, Zhongwei Chen1, Youfan Zhao1, Meihao Wang1, and Min-Ying Su2
1Department of Radiology, First Affiliated Hospital of Wenzhou Medical University, Wenzhou, China, 2Department of Radiological Sciences, University of California, Irvine, CA, United States, 3Department of Radiology, E-Da Hospital and I-Shou University, Kaohsiung, Taiwan, 4Department of Medicine, University of California, Irvine, CA, United States
1Department of Radiology, First Affiliated Hospital of Wenzhou Medical University, Wenzhou, China, 2Department of Radiological Sciences, University of California, Irvine, CA, United States, 3Department of Radiology, E-Da Hospital and I-Shou University, Kaohsiung, Taiwan, 4Department of Medicine, University of California, Irvine, CA, United States
Synopsis
A total of 150 lesions, 104 malignant and 46 benign, presenting as non-mass-like enhancements were analyzed. Three radiologists performed BI-RADS reading for the morphological distribution and internal enhancement pattern. For each case, the 3D tumor mask was generated using Fuzzy-C-Means segmentation. Three DCE parametric maps were generated, and PyRadiomics was applied to extract features. The radiomics model was built using 5 different machine learning algorithms. ResNet50 was implemented using three parametric maps as input. SVM yielded the highest accuracy of 80.4% in training, 77.5% in testing datasets. ResNet50 had better diagnostic performance, 91.5% in training, and 83.3% in testing datasets.
Introduction
Clinical diagnosis on MRI is usually conducted by radiologists based on evaluation of morphological features and DCE kinetic patterns, which is subjective and varies with radiologists' experience [1]. Breast lesions on MRI are divided into three categories, i.e. focus, mass, and non-mass enhancement (NME) [2]. While mass lesions can be easily detected by all imaging modalities and diagnosed with high accuracy, the detection and diagnosis of NME lesions are more challenging [3]. For NME, the fifth edition of BI-RADS has further revised the categories for morphological distribution and internal enhancement pattern (IEP). However, there was a substantial overlap of some descriptor between malignant and benign lesions and difficult to make an accurate diagnosis. In recent years, radiomics and machine learning have been extensively applied in the medical field, which may provide a feasible tool [4-5]. The goal of this study was to implement radiomics and deep learning using ResNet50 to build diagnostic models for distinguishing malignant from benign NME on MRI, and the results are compared to the model built based on radiologists’ reading.Methods
A total of 150 patients showing non-mass lesions without clear boundary on MRI were analyzed, including 104 malignant and 46 benign tumors, all confirmed by histopathology. DCE scan was acquired using the volume imaging for breast assessment sequence, consisted of 6 frames: one pre-contrast (F1) and 5 post-contrast (F2-F6). Three radiologists gave the BI-RADS reading for the morphological distribution and IEP. Tumors were segmented based on contrast-enhanced maps using FCM clustering algorithm. After segmentation, the ROIs from all imaging slices containing this lesion were combined. Then 3D connected-component labeling was applied to remove scattered voxels not connecting to the main lesion, and then the hole-filling algorithm was applied to generate the final 3D ROI mask [6-7]. Three heuristic DCE parametric maps were generated according to: the early wash-in signal enhancement (SE) ratio [(F2-F1)/F1]; the maximum SE ratio = [(F3-F1)/F1]; the wash-out slope [(F6-F3)/F3] [5]. Three cases are illustrated in Figures 1 to 2. The radiomics analysis was performed using the PyRadiomics. The analysis flow chart is shown in Figure 3. The sequential feature selection process was utilized via constructing multiple support vector machine (SVM) classifiers. After features were selected, several machine learning algorithms were applied for classification, including SVM with the Gaussian kernel, Decision Tree, K-Nearest Neighbor (KNN), Linear Discriminant, Naïve Bayes [8-10]. The diagnostic performance was evaluated using 10-fold cross-validation in the training dataset, and then the developed final model was applied to the held-out testing dataset. Deep learning was performed using Residual Networks, ResNet50, following the procedures previously applied to diagnose mass lesions. Deep learning was performed using each slice as independent input. After the slice-based analysis was completed, the highest probability among all slices of a lesion was assigned to that lesion.Results
A total of 8 radiomics features were selected. In the training dataset, the achieved accuracy was 80.4%, 77.3%, 75.3%, 75.3%, 71.1% for SVM, Decision Tree, KNN, Linear Discriminant, Naïve Bayes, respectively. The ROC curves for all models were generated and shown in Figure 4. When these models were applied to the held-out testing dataset, the accuracy was 77.5%, 75.0%, 67.5%, 70.0%, 62.5%. For morphological distribution, ĸ = 0.83, 95% confidence interval [0.81-0.84]; and for internal enhancement pattern k = 0.52, 95% confidence interval [0.51-0.53]. The results combining the distribution and enhancement are shown in Table 1. In the training dataset, the sensitivity = 95.4%, specificity = 82.8%, accuracy = 91.5% with AUC of 0.97. When the developed model was applied to the held-out testing dataset, the sensitivity = 88.9%, specificity = 66.7%, accuracy = 83.3%.Discussion
The detection and diagnosis of NME have been known as a more challenging problem compared to mass lesions, which may be addressed by advanced machine learning methods [3]. Our reading results showed that regional and segmental were the two dominating types, and the inter-observer agreement was excellent with a kappa value of 0.83. For the internal enhancement pattern, the inter-observer agreement was only moderate with a kappa value of 0.52. The two main enhancement categories were heterogeneous and clumped, but the readers could not reach a good agreement between them. There was no clear graphical depiction similar to those illustrating morphological distribution for readers to follow [11]. Besides, even with precise classification of distribution and enhancement patterns, they were not related to a clear distinction between malignant and benign lesions NME was known to present heterogeneous enhancements. Whether it was clumped or not was related to the degree of heterogeneity, i.e. whether there was presence of aggregated bright spots, and it was subjective. Therefore, and more advanced CAD methods are needed. Our results showed that there was a substantial overlap between malignant and benign lesions. Radiomics and deep learning methods were implemented to investigate their potential as a machine-learning based CAD tool. Deep learning could achieve 91.5% accuracy in training and 80% accuracy in the held-out testing dataset, better than radiomics. The results suggest that computer-aided methods with sophisticated machine learning and deep learning algorithms can be further developed to help solving the difficult problem in the diagnosis of NME on MRI.Acknowledgements
This work was supported in part by Research Incubation Project of First Affiliated Hospital of Wenzhou Medical University (No. FHY2019085), Medical Health Science and Technology Project of Zhejiang Province Health Commission (No. 2019KY102), and NIH/NCI R01 CA127927 and R21 CA208938References
[1]. Lehman CD, J Blume JD, DeMartini WB, Hylton NM, Herman B, Schnall MD (2013) Accuracy and Interpretation Time of Computer-Aided Detection Among Novice and Experienced Breast MRI Readers. AJR Am J Roentgenol. 200(6):W683-9. [2]. D’Orsi CJ, Sickles EA, Mendelson EB, Morris EA (2013) ACR BI-RADS® Atlas, Breast Imaging Reporting and Data System. 5th edn. Reston, VA: American College of Radiology. [3]. Meyer-Base A, Morra L, Tahmassebi A, Lobbes M, Meyer-Base U, Pinker K (2020) AI-Enhanced Diagnosis of Challenging Lesions in Breast MRI: A Methodology and Application Primer. J Magn Reson Imaging doi: 10.1002/jmri.27332. [4]. Ji Y, Li H, Edwards AV, et al (2019) Independent validation of machine learning in diagnosing breast Cancer on magnetic resonance imaging within a single institution. Cancer Imaging 19(1):64. [5]. Zhou J, Zhang Y, Chang KT, et al (2020) Diagnosis of Benign and Malignant Breast Lesions on DCE-MRI by Using Radiomics and Deep Learning With Consideration of Peritumor Tissue. J Magn Reson Imaging 51(3):798-809. [6] Nie K, Chen JH, Yu HJ, Chu Y, Nalcioglu O, Su MY. Quantitative Analysis of Lesion Morphology and Texture Features for Diagnostic Prediction in Breast MRI. Acad Radiol 2008;15:1513–1525. [7]. Newell D, Nie K, Chen JH, Hsu CC, Yu HJ, Nalcioglu O, Su MY. Selection of diagnostic features on breast MRI to differentiate between malignant and benign lesions using computer-aided diagnosis: differences in lesions presenting as mass and non-mass-like enhancement. Eur Radiol. 2010;20(4):771-781. [8] Nasrabadi NM (2007) Pattern recognition and machine learning. Journal of electronic imaging 16:049901, [9] Fusco R, Sansone M, Filice S, et al (2016) Pattern Recognition Approaches for Breast Cancer DCE-MRI Classification: A Systematic Review. J Med Biol Eng. 36(4):449-459. [10] Tahmassebi A, Wengert GJ, Helbich TH, et al (2019) Impact of Machine Learning With Multiparametric Magnetic Resonance Imaging of the Breast for Early Prediction of Response to Neoadjuvant. [11] Lunkiewicz M, Forte S, Freiwald B, Singer G, Leo C, Kubik-Huch RA (2020) Interobserver variability and likelihood of malignancy for fifth edition BI-RADS MRI descriptors in non-mass breast lesions. Eur Radiol. 30(1):77-86.Figures
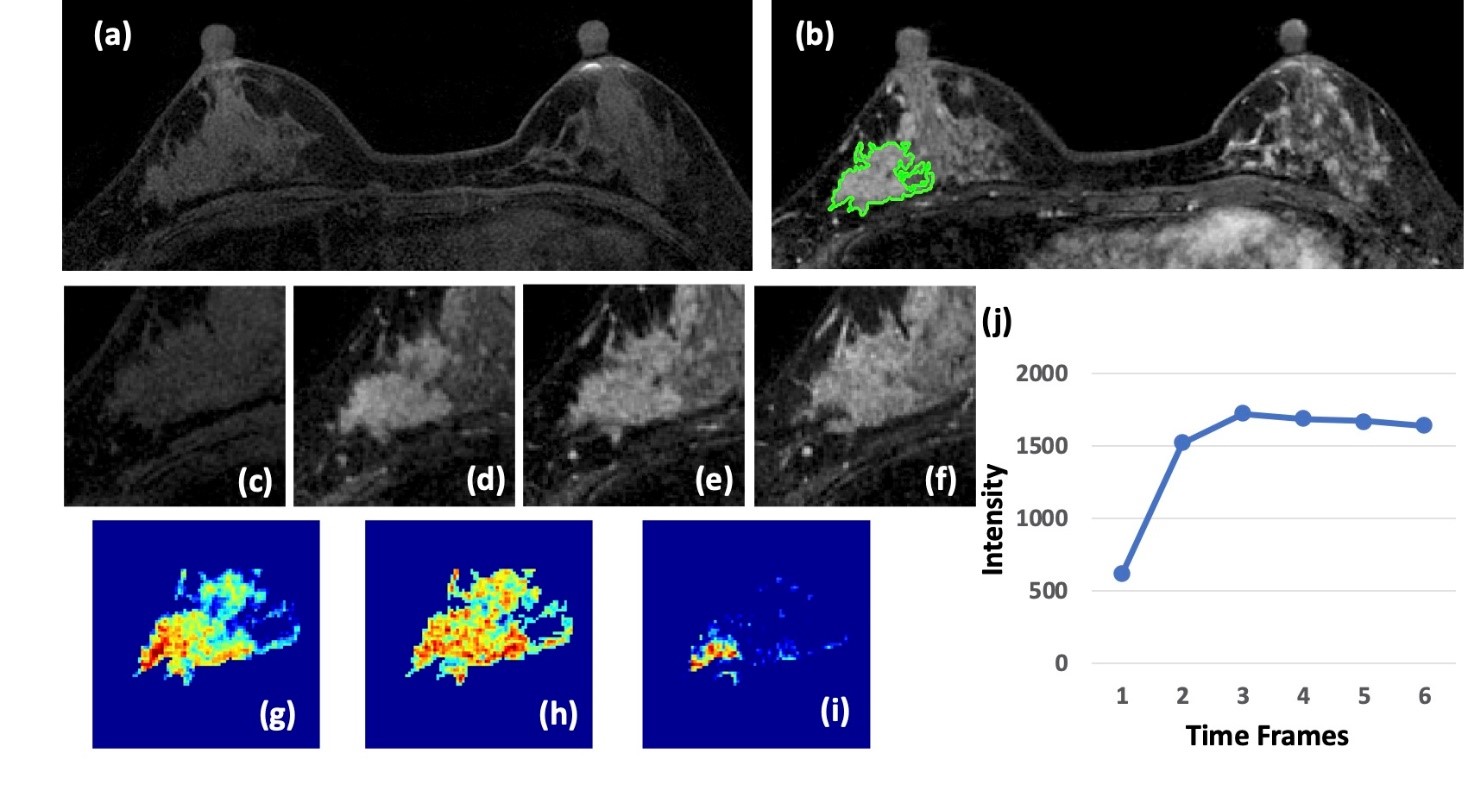
Figure 1: A 41-year-old patient with a DCIS. (a) F1 Pre-contrast image.
(b) F2 post-contrast image. (c-i): The zoom-in smallest bounding box containing
the tumor. (c) F1 pre-contrast, (d) F2 post-contrast, (e) F3 post-contrast, (f)
The last F6 post-contrast image, showing a comparable enhancement as in F3. (g)
The wash-in signal enhancement map F2-F1, (h) The maximum F3-F1 signal
enhancement map, (i) The wash-out F6-F3 map. A small portion of the tumor shows
the wash-out pattern. (J) The DCE time course shows a plateau pattern, after
reaching the maximum in F3.
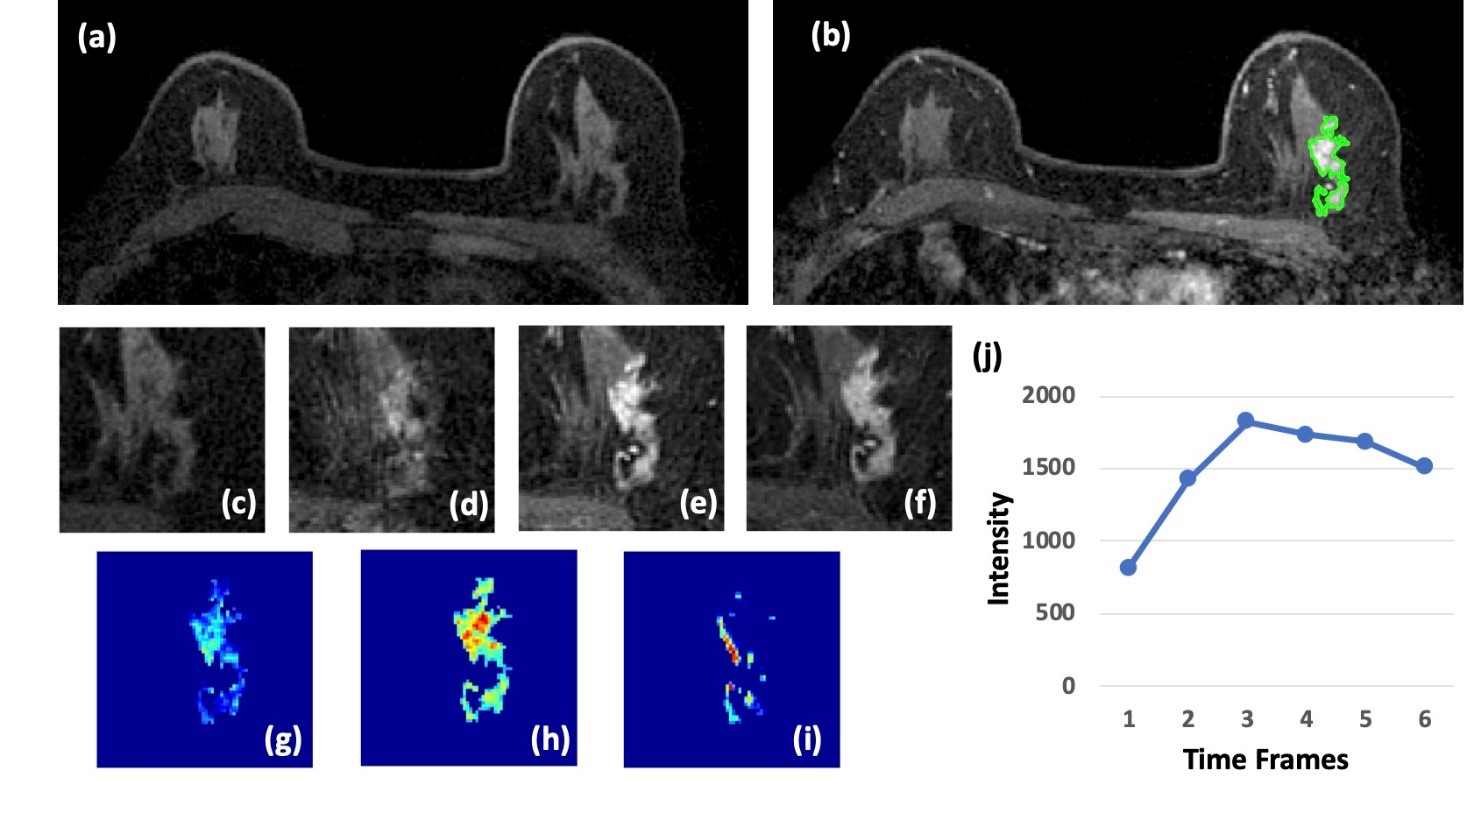
Figure 2: A 63-year-old patient with an invasive ductal cancer (IDC). (a)
F1 Pre-contrast image. (b) F2 post-contrast image. (c) F1 pre-contrast, (d) F2
post-contrast, (e) F3 post-contrast, (f) The last F6 post-contrast image,
showing wash-out DCE pattern with decreased intensity after reaching maximum in
F3. (g) The wash-in signal enhancement map F2-F1, (h) The maximum F3-F1 signal
enhancement map, (i) The wash-out F6-F3 map. (j) The DCE time course shows a
typical wash-out pattern, reaching maximum in F3, followed by decreased
intensity from F4 to F6.
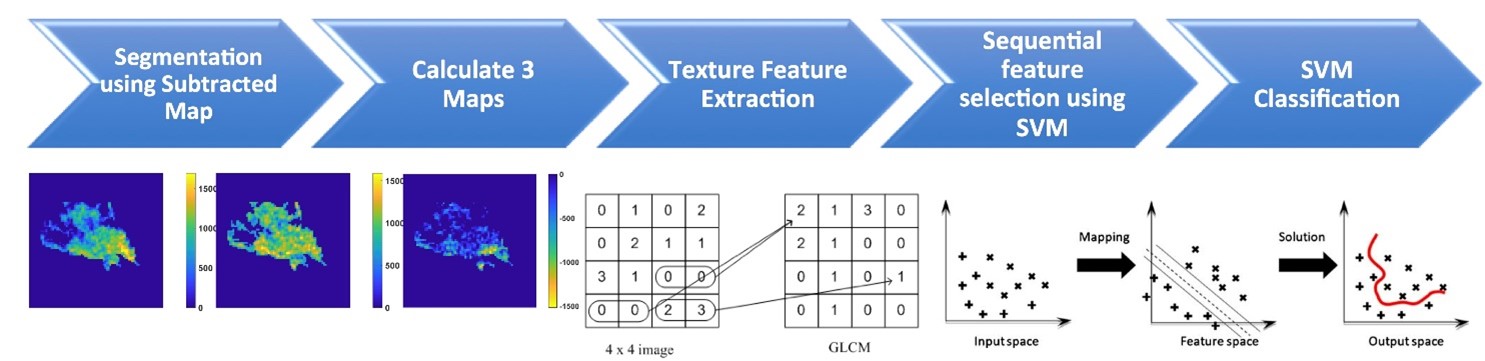
Figure 3: The flowchart of the analysis
procedures. The tumor is first segmented on F2 post-contrast image, and then
the tumor ROI is mapped to 3 generated DCE parametric maps. On each map, 32 first-order
and 75 texture parameters are extracted using the PyRadiomics. For each case, a
total of 321 features are obtained from 3 maps. They are used to develop the SVM
classification model to differentiate benign from malignant lesions.
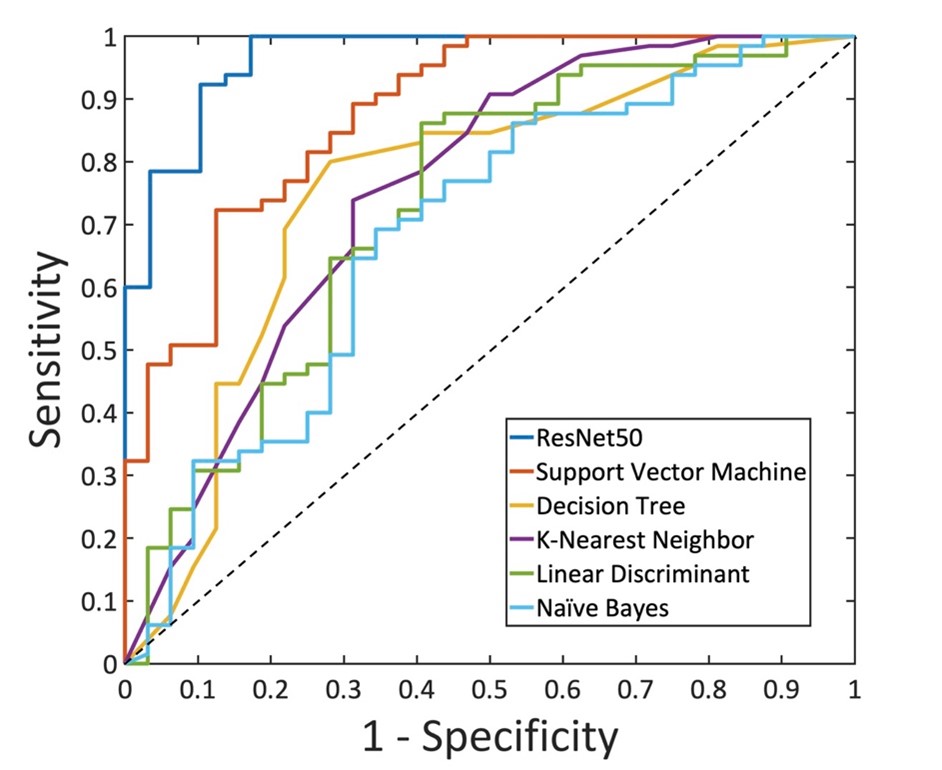
Figure 4: The ROC
curves generated by using the predicted per-lesion malignancy probability in the
training dataset using ResNet50 and the five radiomics models built using different
machine learning algorithms: Support Vector Machine, Decision Tree, K-Nearest Neighbor,
Linear Discriminant, and Naïve Bayes.
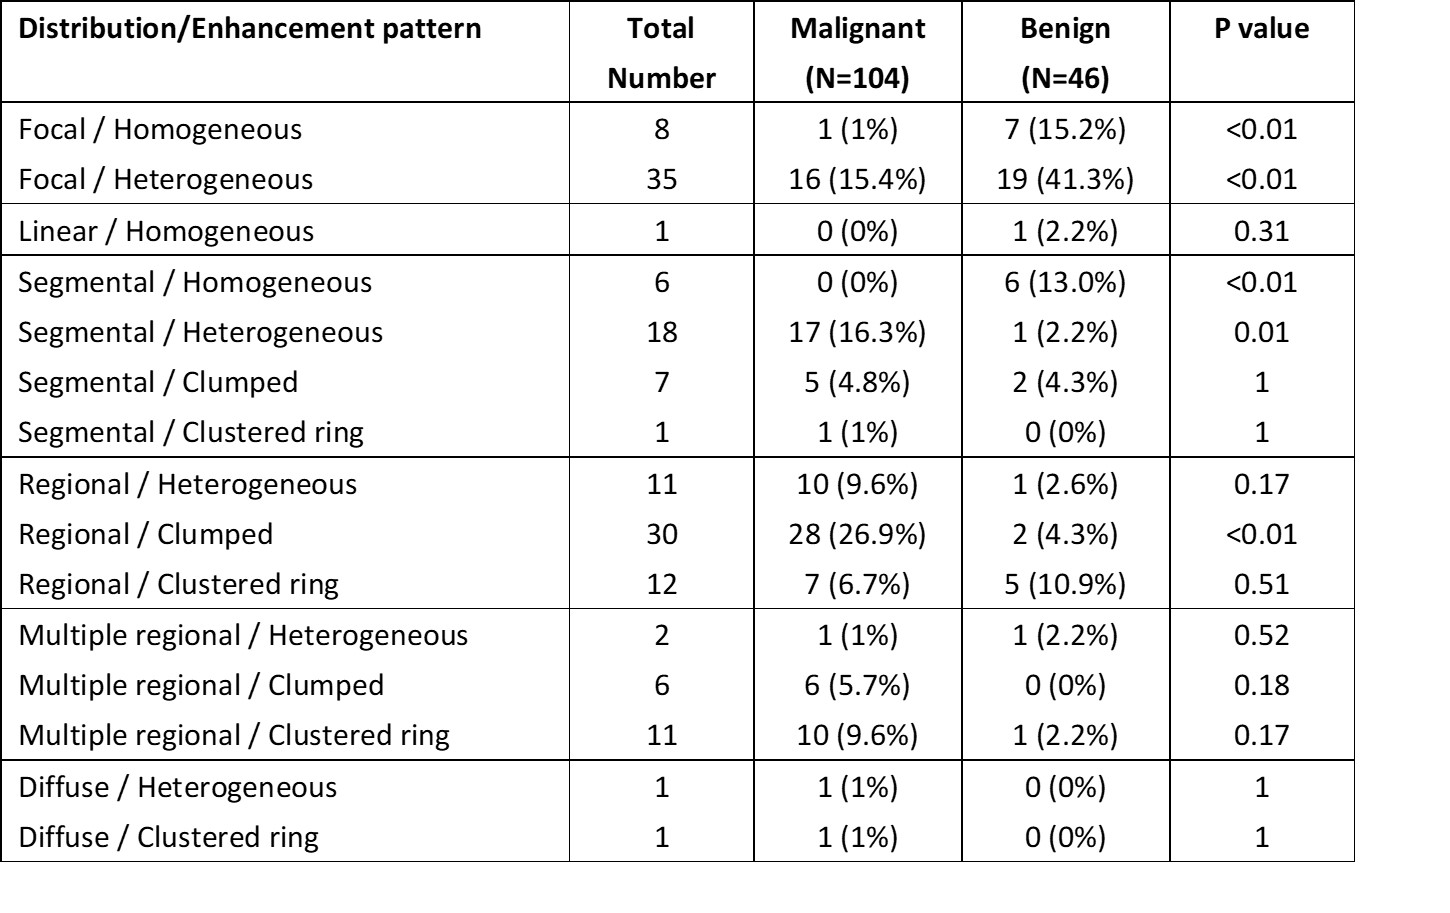
Table 1. Combined distribution and internal
enhancement pattern in malignant and benign groups