0055
Breast MRI functional tumor volume segmentation quality may impact the prediction of pathological complete response1Department of Radiology & Biomedical Imaging, University of California, San Francisco, San Francisco, CA, United States, 2Department of Surgery, University of California, San Francisco, San Francisco, CA, United States, 3Quantum Leap Healthcare Collaborative, San Francisco, CA, United States
Synopsis
In the I-SPY2 neoadjuvant breast cancer trial, functional tumor volume (FTV) derived from dynamic contrast-enhanced MRI serves as a key marker. Participants in I-SPY2 have the option to “de-escalate” therapy if achievement of pathological complete response (pCR) is highly likely at inter-regimen time point. A model combining FTV-based predictive probabilities with inter-regimen core-biopsy pathology is central to select candidates for this option. This retrospective study compared the performance of longitudinal FTVs in predicting pCR between optimal and non-optimal FTV segmentation groups. The results suggest that improvements to FTV segmentation can improve FTV’s ability to provide predictive guidance for treatment de-escalation.
INTRODUCTION
Functional tumor volume (FTV) is a quantitative measure of tumor burden derived from dynamic contrast-enhanced breast MRI1, 2. In the I-SPY 2 breast cancer trial, FTV is measured during neoadjuvant chemotherapy (NAC) at pre-treatment (T0), early-treatment (T1, 3 weeks), inter-regimen (T2, 12 weeks), and pre-surgery (T3) time points. Participants receive 12 cycles of weekly paclitaxel with or without addition of experimental agents, followed by 4 cycles of anthracycline-cyclophosphamide (AC) prior to surgery. A de-escalation strategy currently being introduced in I-SPY 2 will give patients the option to skip AC if achievement of pathological complete response (pCR) is highly likely at the inter-regimen time point (T2) (Figure 1). To guide selection of candidates for this option, a model combining FTV-based predictive probabilities with inter-regimen percutaneous core biopsy pathology has been developed. According to the current prospective rules for measuring longitudinal FTVs, enhancement thresholds and bounding box dimensions defined at T0 are kept constant for all subsequent exams. To refine the FTV-based prediction, we hypothesize that retrospective modification of the FTV measurements, based on knowledge of the course of response, would improve the performance. This retrospective simulation study aimed to investigate the impact of FTV segmentation quality on the performance of longitudinal FTVs in predicting pCR.METHODS
A cohort of 863 patients with locally advanced breast cancer enrolled in the I-SPY 2 trial was available for this study. Half of the cohort (n=432) matched by subtype and outcome were randomly sampled for the main analysis. One quarter of the main analysis cohort (n=108) was similarly sampled for a multi-reader sub-analysis.Using in-house software developed in IDL (Exelis Visual Information Solutions, Boulder, CO), FTV was calculated by summing all voxels with early percent enhancement (PE, ~150 s post contrast injection) above 70% and signal enhancement ratio above zero within a manually delineated 3-dimensional bounding box as described in the literature3. For each MRI, 4 representative slices were selected using an automated computer algorithm for the evaluation of FTV segmentation quality. In the main analysis cohort, a breast radiologist (Reader 1, 9 years of experience) reviewed the 4 slices showing the FTV segmentation as color-map overlaid on the early phase images and ranked the quality using a 5-point scale: 1, under-segmentation; 2, slight under-segmentation; 3, no modification required; 4, slight over-segmentation; 5, over-segmentation. Under current best practices in I-SPY 2, slight under-segmentation of tumor volume is considered acceptable for tracking longitudinal change in FTV. Thus, FTV segmentation with the rank “3 no modification required” or “2 slight under-segmentation” were considered as optimal. FTV segmentations ranked 1, 4 or 5 were considered as non-optimal.
We defined FTV at T0 as FTV0. FTV change from T0 to T1 and T2 was defined as ∆FTV1 and ∆FTV2, respectively. Based on the segmentation quality ranking, each FTV0, ∆FTV1 and ∆FTV2 was stratified into optimal or non-optimal. In order for FTV change (∆FTV1 or ∆FTV2) to be stratified as optimal, both FTV0 and FTV at a given timepoint (T1 or T2) had to be optimal. The above process was repeated by two additional trained readers in the I-SPY 2 Imaging Core Lab (Reader 2, 14 years of experience; Reader 3, 1 year of experience) for the sub-analysis cohort.
Logistic regression modeling with cross-validation to predict pCR was performed for each of FTV0, ∆FTV1, ∆FTV2, and the combination (multivariable model). The areas under the ROC curve (AUCs) were used to evaluate the models. The AUCs were compared between the optimal and non-optimal segmentation group with 2000 bootstrap replicates. In the sub-analysis cohort, the Kendall’s coefficients were calculated between the three readers to evaluate inter-reader agreement for FTV segmentation quality ranking.
RESULTS
Results of the FTV segmentation quality ranking are shown in Figure 2. AUC values for the prediction of pCR were higher for the optimal segmentation group versus non-optimal group for ∆FTV1, ∆FTV2 and the multivariable model (0.68 vs. 0.66, 0.70 vs. 0.62, and 0.84 vs. 0.64, respectively), with the difference reaching statistical significance for the multivariable model (Figure 3).The inter-reader agreement between the three readers was moderate with the Kendall’s coefficient of 0.40 at T0, 0.44 at T1, and 0.40 at T2. In Reader 2’s review of the sub-analysis cohort, AUC values for the prediction of pCR were higher for the optimal segmentation group versus non-optimal group for FTV0, ∆FTV2 and the multivariable model (0.62 vs. 0.47, 0.72 vs. 0.50, and 0.78 vs. 0.44, respectively), with the difference reaching statistical significance for the multivariable model (Figure 4). In Reader 3’s review of the sub-analysis cohort, AUC values for the prediction of pCR were higher for the optimal segmentation group versus non-optimal group at both for FTV0, ∆FTV1 and ∆FTV2 (0.60 vs. 0.36, 0.67 vs. 0.50, and 0.71 vs. 0.43, respectively), although the differences did not reach statistical significance (Figure 5).
DISCUSSION
The results suggest that FTV segmentation quality influences the performance of longitudinal FTVs in predicting pCR, and support the hypothesis that retrospective modification of FTV measurement, based on knowledge of the course of response, may improve the predictive guidance for de-escalation. These analyses are being used to refine FTV measurement methods and acceptance criteria in the ongoing I-SPY2 trial.Acknowledgements
This work was supported by NIH U01 CA225427, NIH R01 CA132870, and NIH P01 CA210961.References
1. Hylton NM, Blume JD, Bernreuter WK, et al: Locally advanced breast cancer: MR imaging for prediction of response to neoadjuvant chemotherapy--results from ACRIN 6657/I-SPY TRIAL. Radiology 263:663–672, 2012
2. Hylton NM, Gatsonis CA, Rosen MA, et al: Neoadjuvant Chemotherapy for Breast Cancer: Functional Tumor Volume by MR Imaging Predicts Recurrence-free Survival-Results from the ACRIN 6657/CALGB 150007 I-SPY 1 TRIAL. Radiology 279:44–55, 2016
3. Hylton NM: Vascularity assessment of breast lesions with gadolinium-enhanced MR imaging. Magn Reson Imaging Clin N Am 7:411–20, 1999
Figures
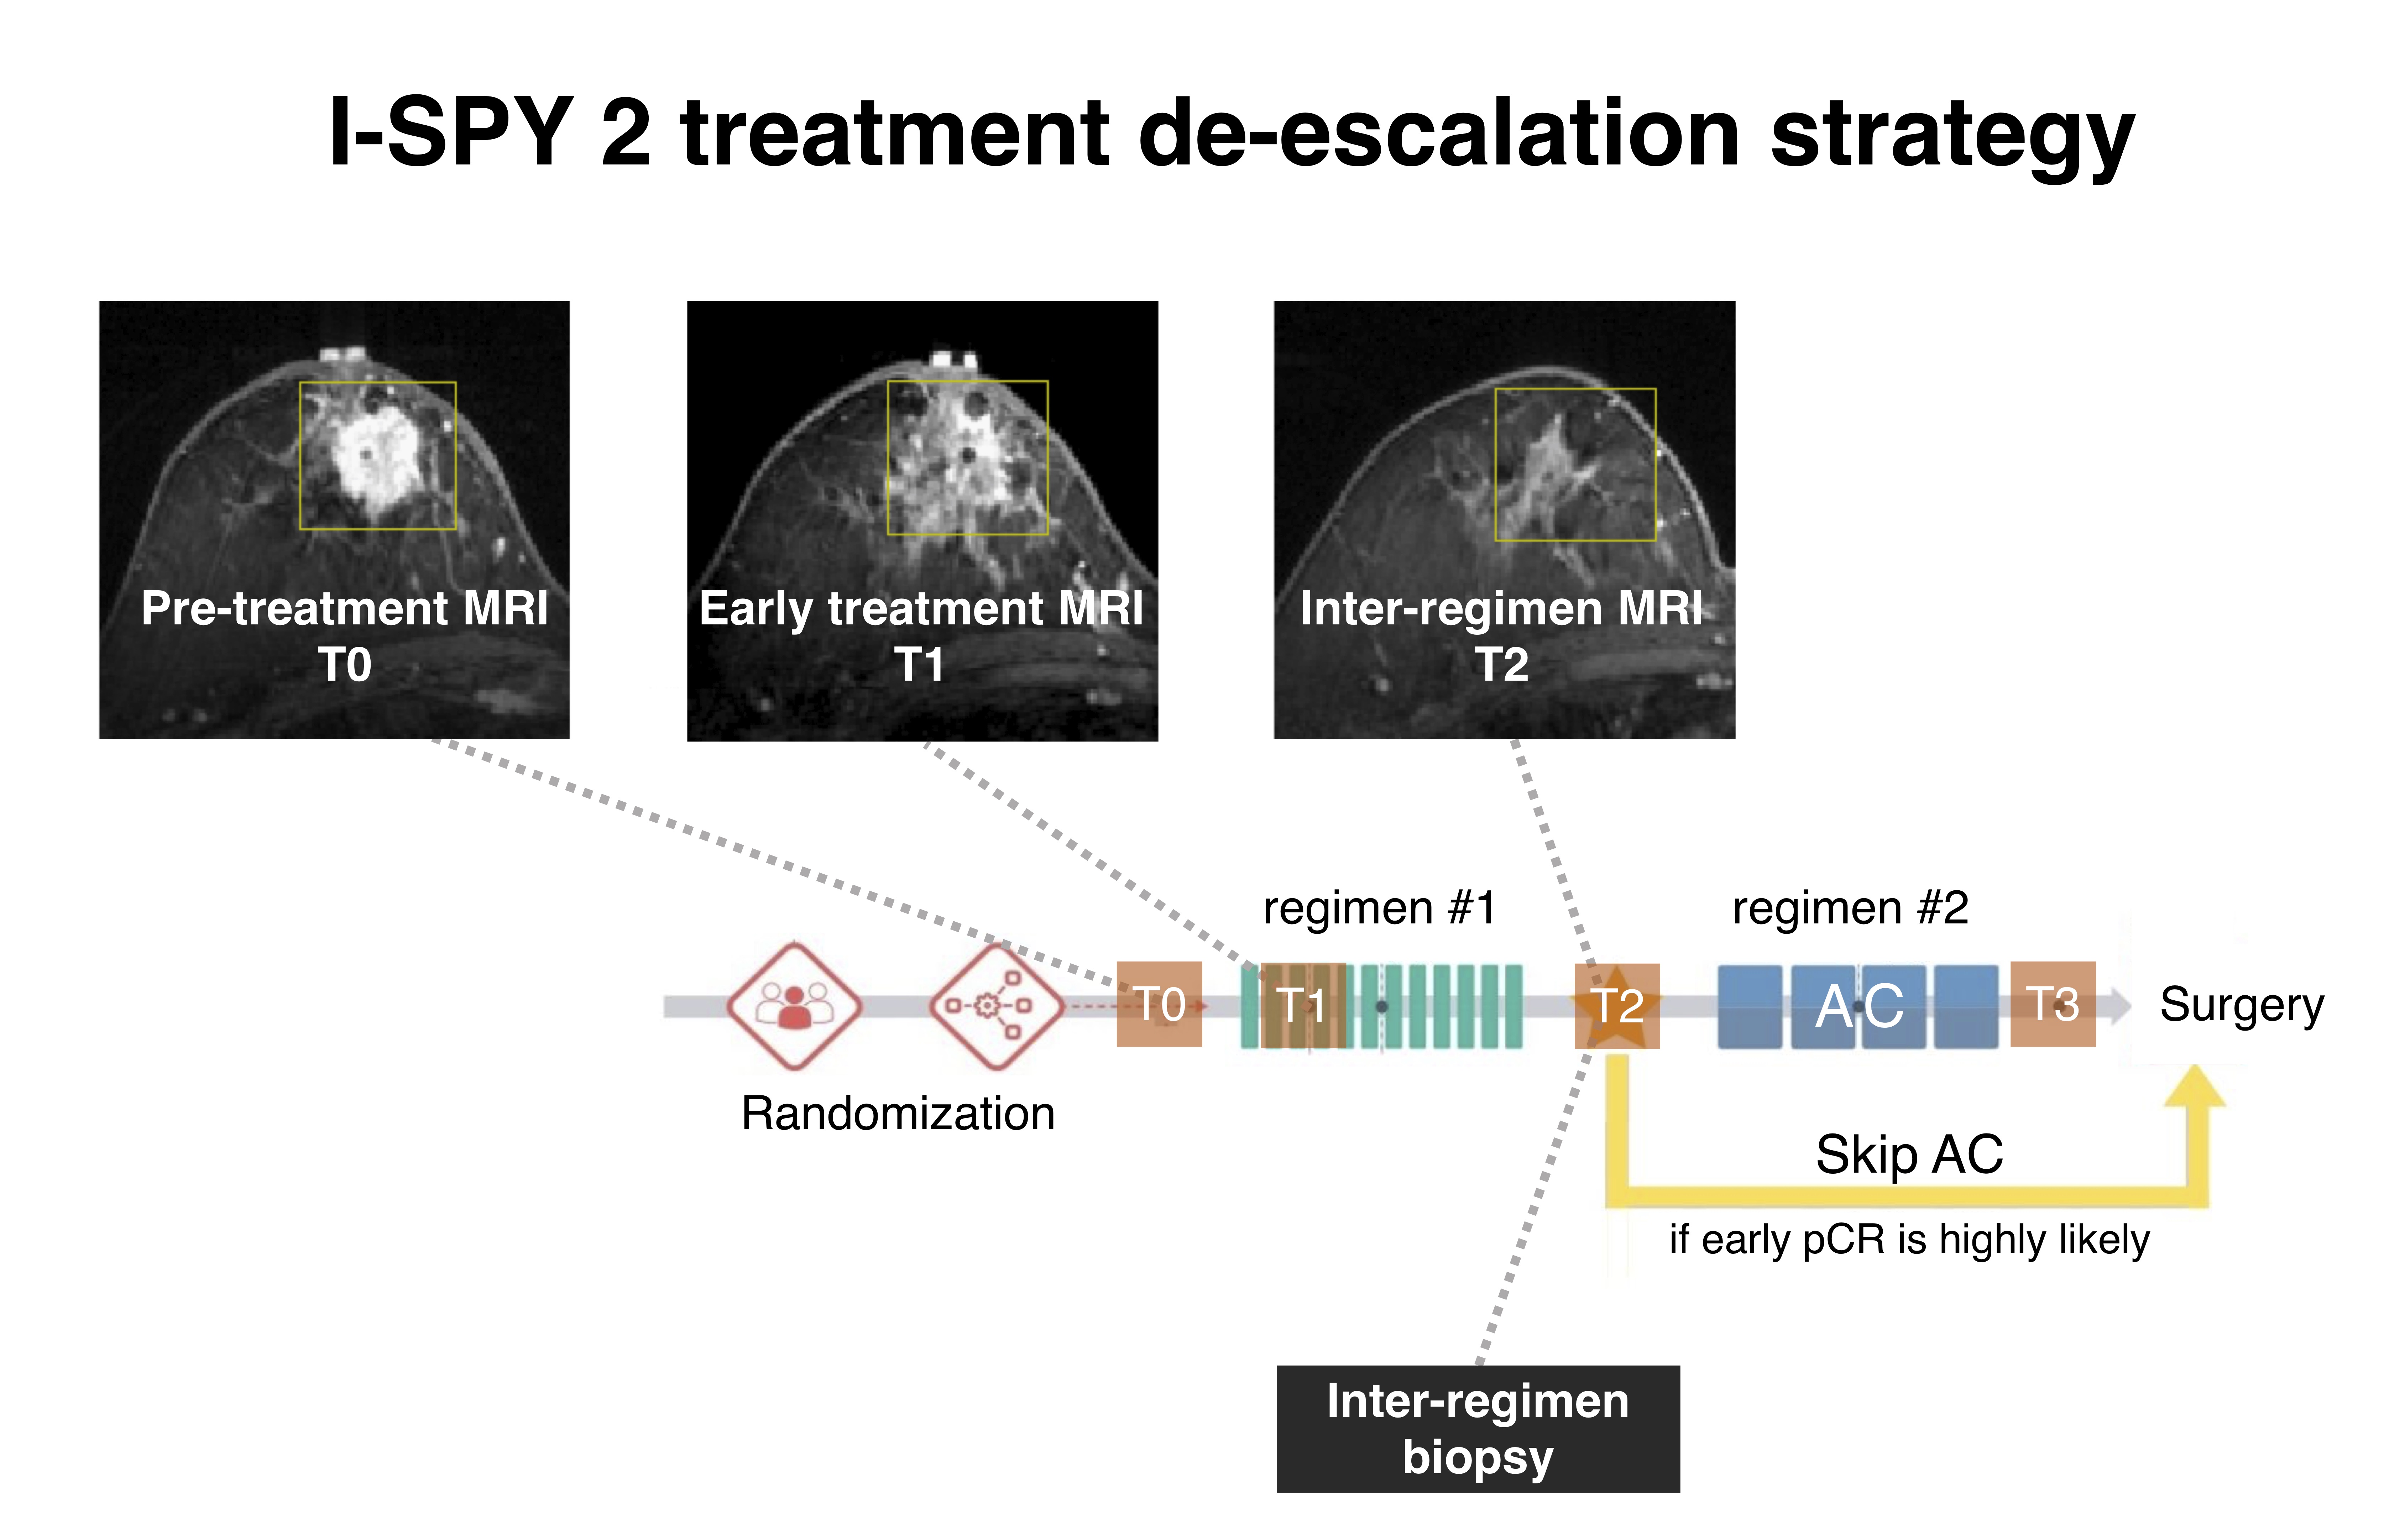
Figure 1: I-SPY 2 treatment de-escalation strategy
The treatment de-escalation decision will be made at T2 based on combined MRI and biopsy results. Qualified subjects will be given the option to skip anthracycline-cyclophosphamide (AC) treatment and proceed directly to surgery.
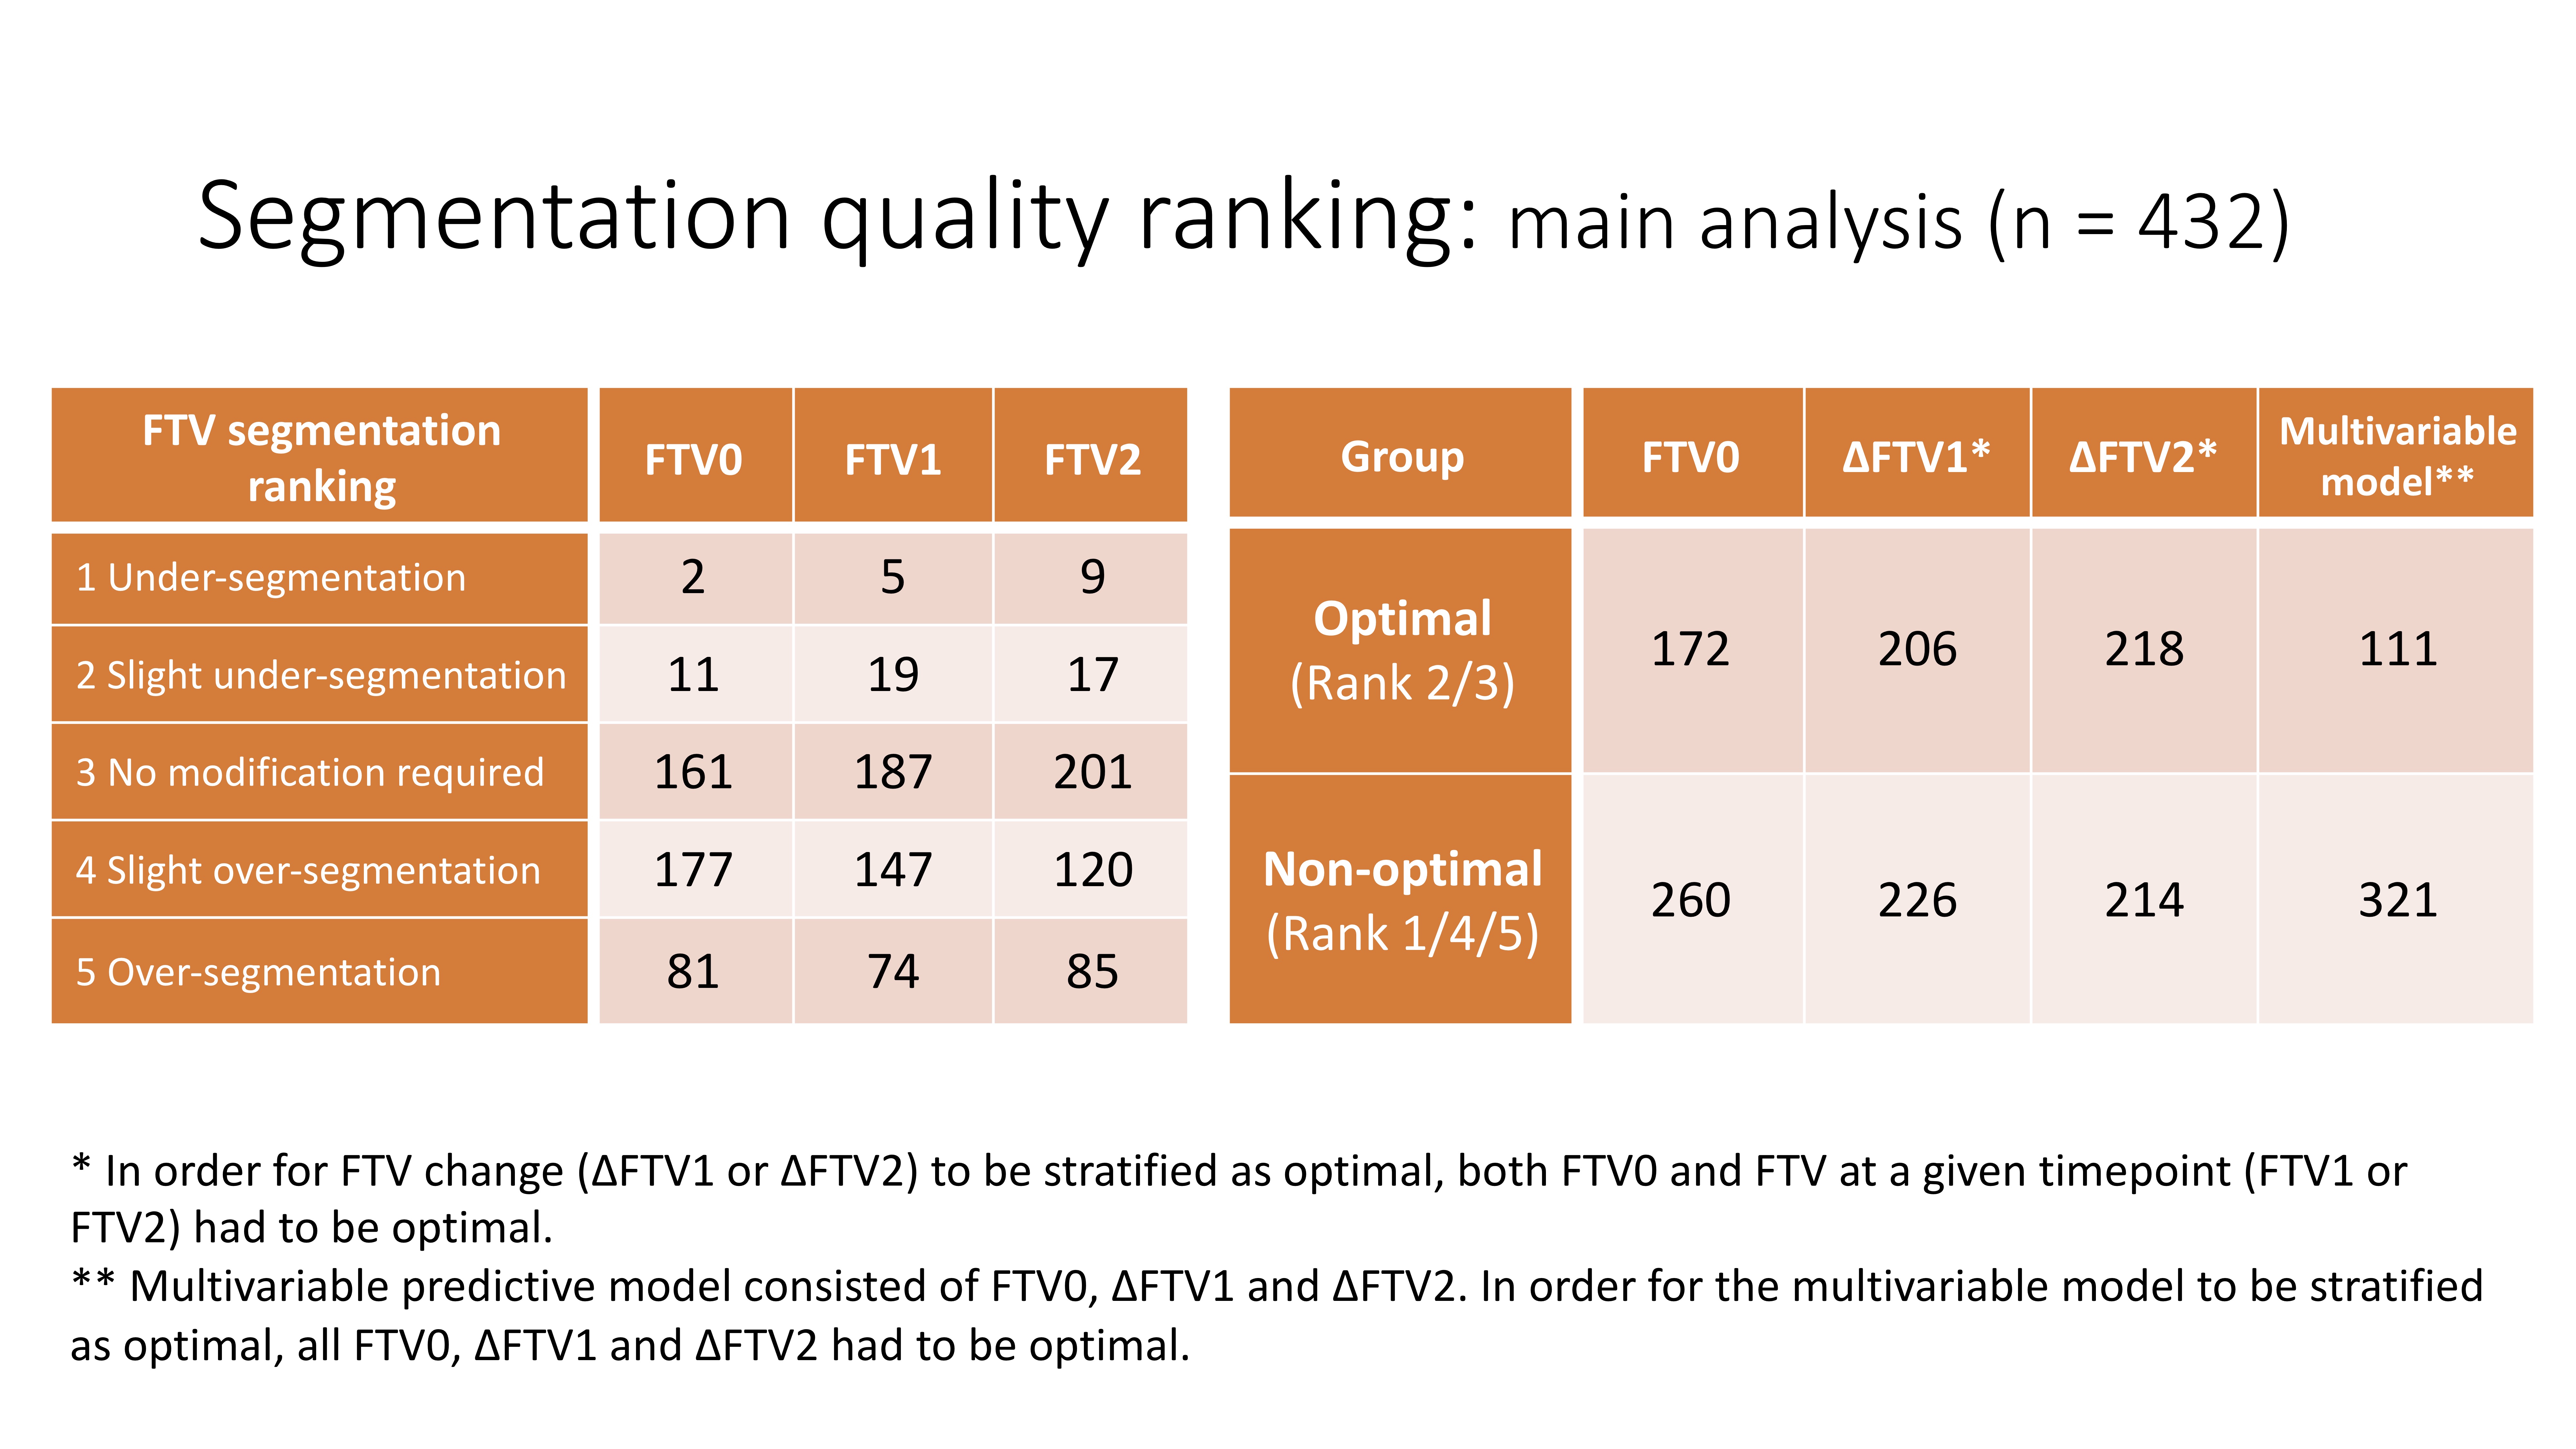
Figure 2: Functional tumor volume (FTV) segmentation quality ranking
* In order for FTV change (∆FTV1 or ∆FTV2) to be stratified as optimal, both FTV0 and FTV at a given timepoint (FTV1 or FTV2) had to be optimal.
** Multivariable predictive model consisted of FTV0, ∆FTV1 and ∆FTV2. In order for the multivariable model to be stratified as optimal, all FTV0, ∆FTV1 and ∆FTV2 had to be optimal.
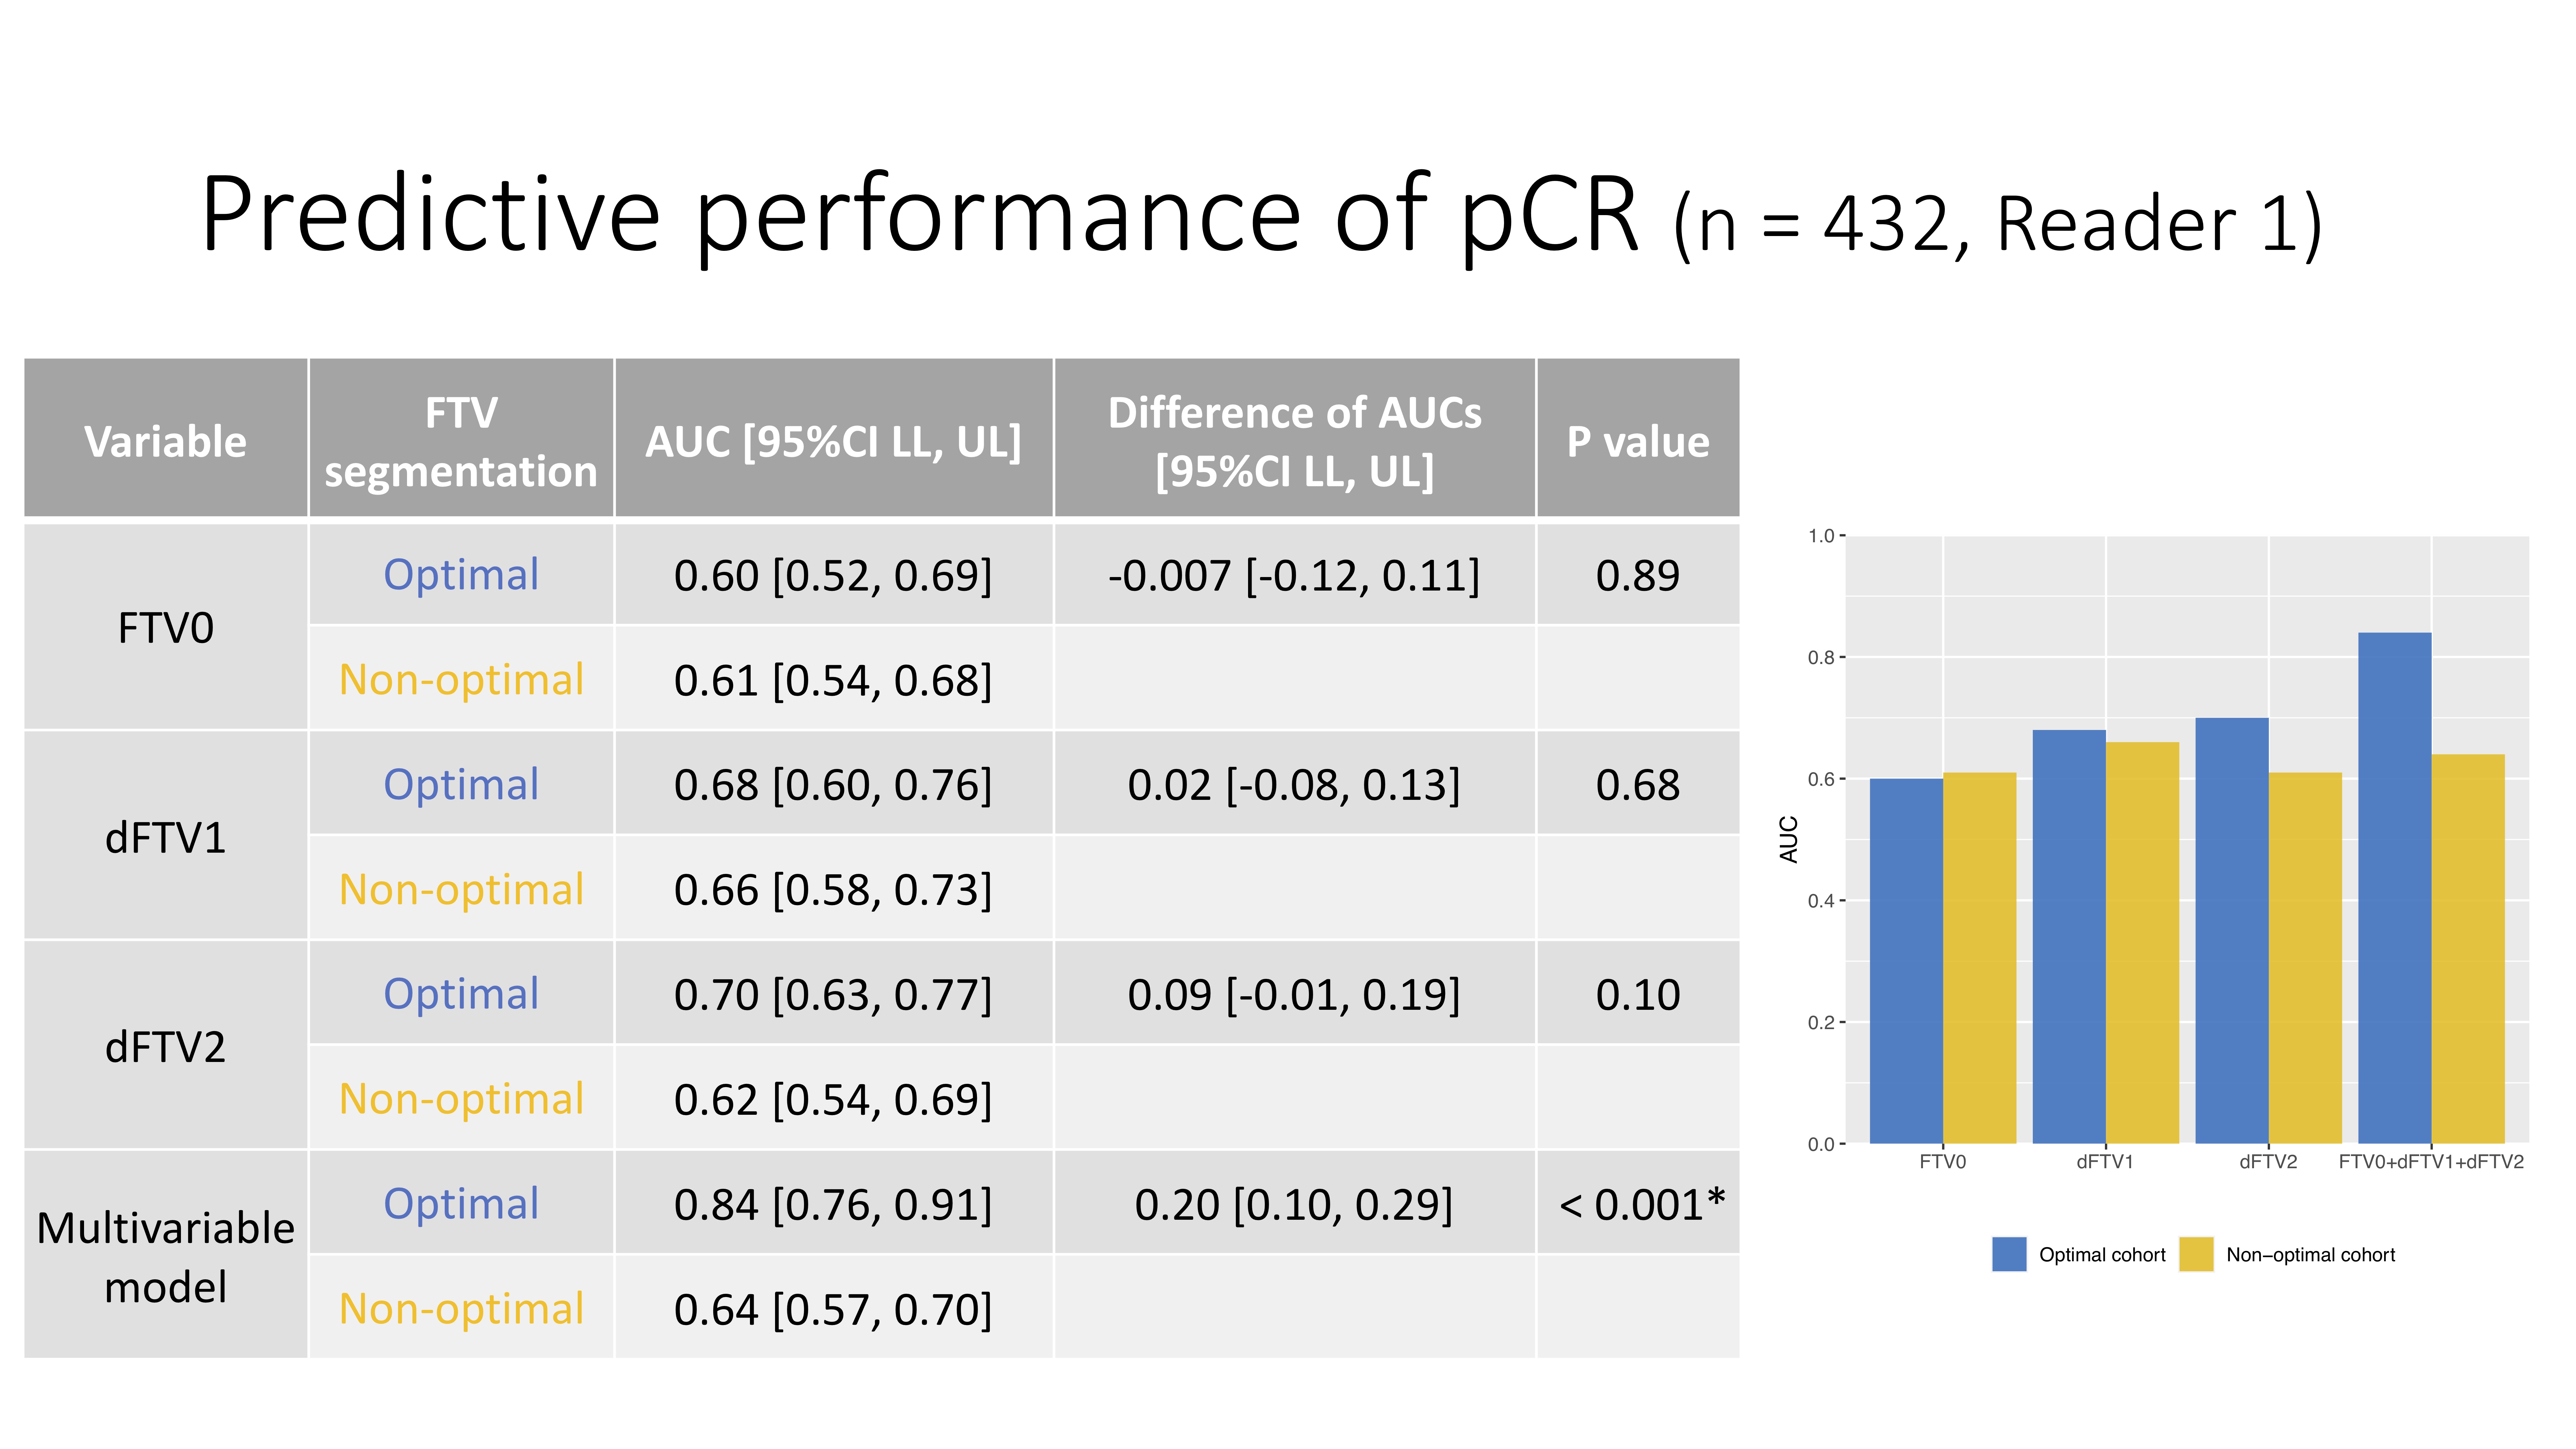
Figure 3: Predictive performance of pCR in the optimal and non-optimal segmentation groups (Main analysis: Reader 1)
AUC values for the prediction of pCR were higher for the optimal segmentation group versus non-optimal group for ∆FTV1, ∆FTV2 and the multivariable model (0.68 vs. 0.66, 0.70 vs. 0.62, and 0.84 vs. 0.64, respectively), with the difference reaching statistical significance for the multivariable model.
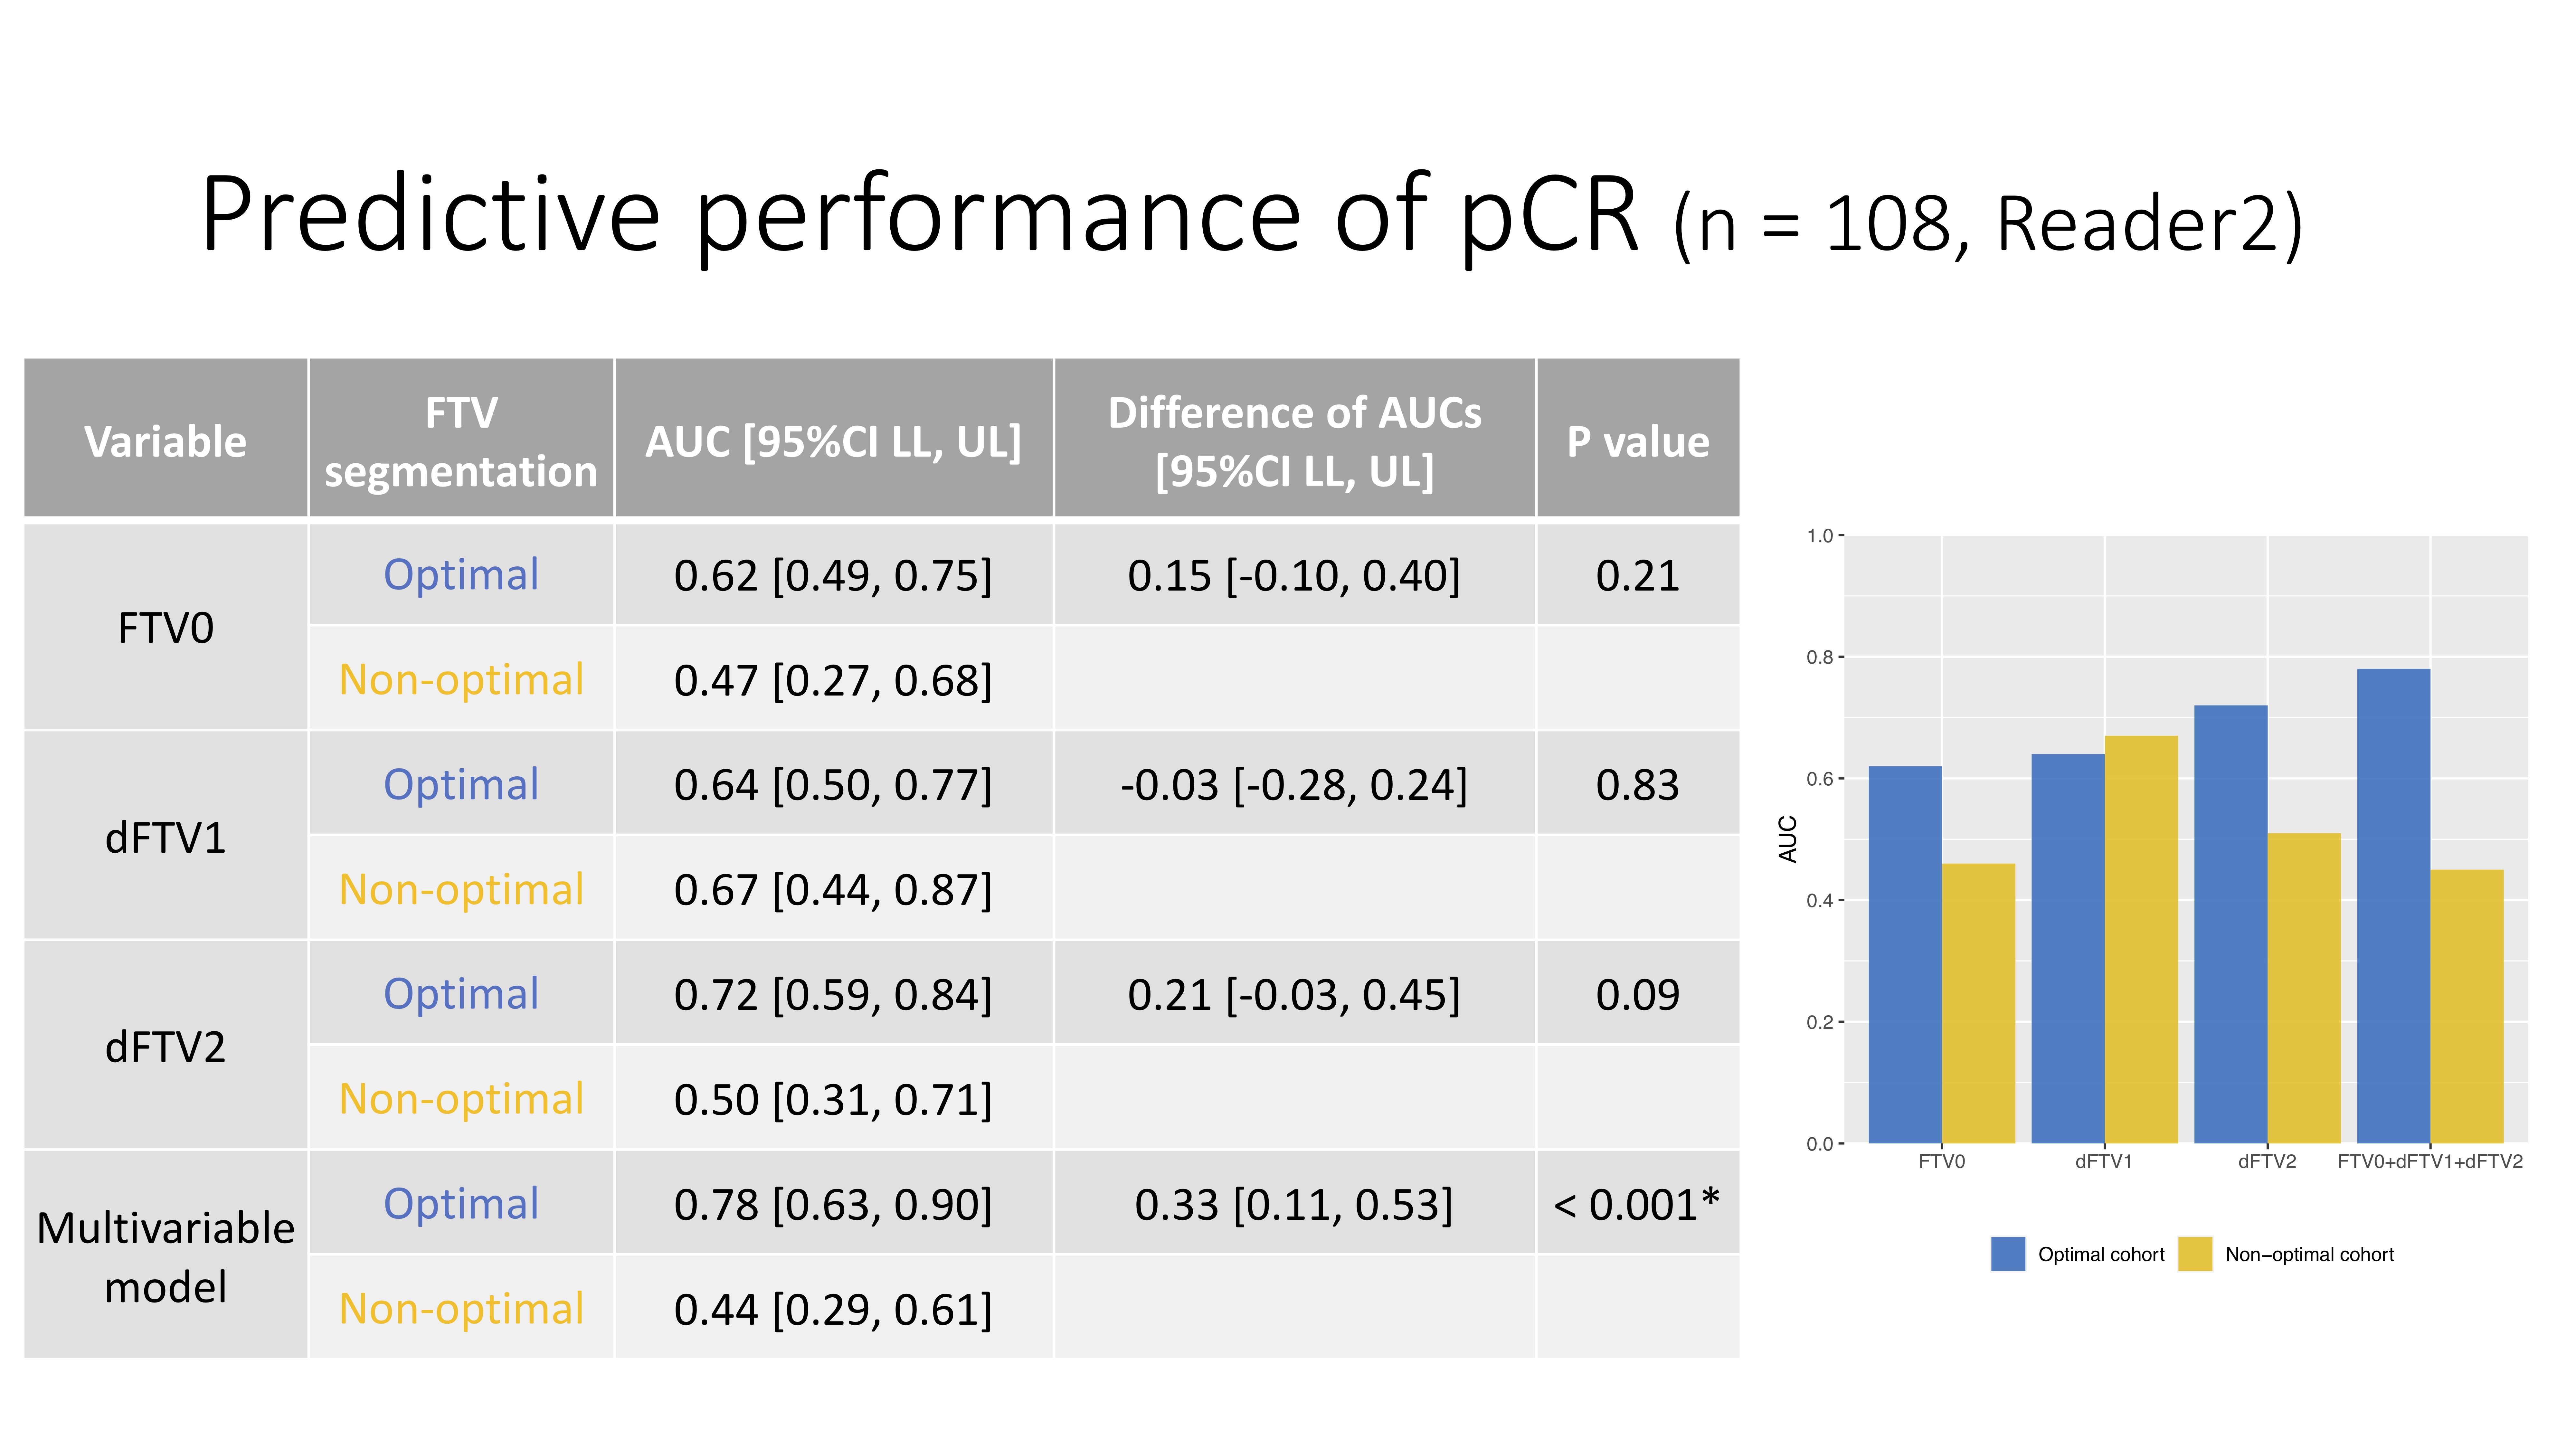
Figure 4: Predictive performance of pCR in the optimal and non-optimal segmentation groups (Sub analysis: Reader 2)
AUC values for the prediction of pCR were higher for the optimal segmentation group versus non-optimal group for FTV0, ∆FTV2 and the multivariable model (0.62 vs. 0.47, 0.72 vs. 0.50, and 0.78 vs. 0.44, respectively), with the difference reaching statistical significance for the multivariable model.
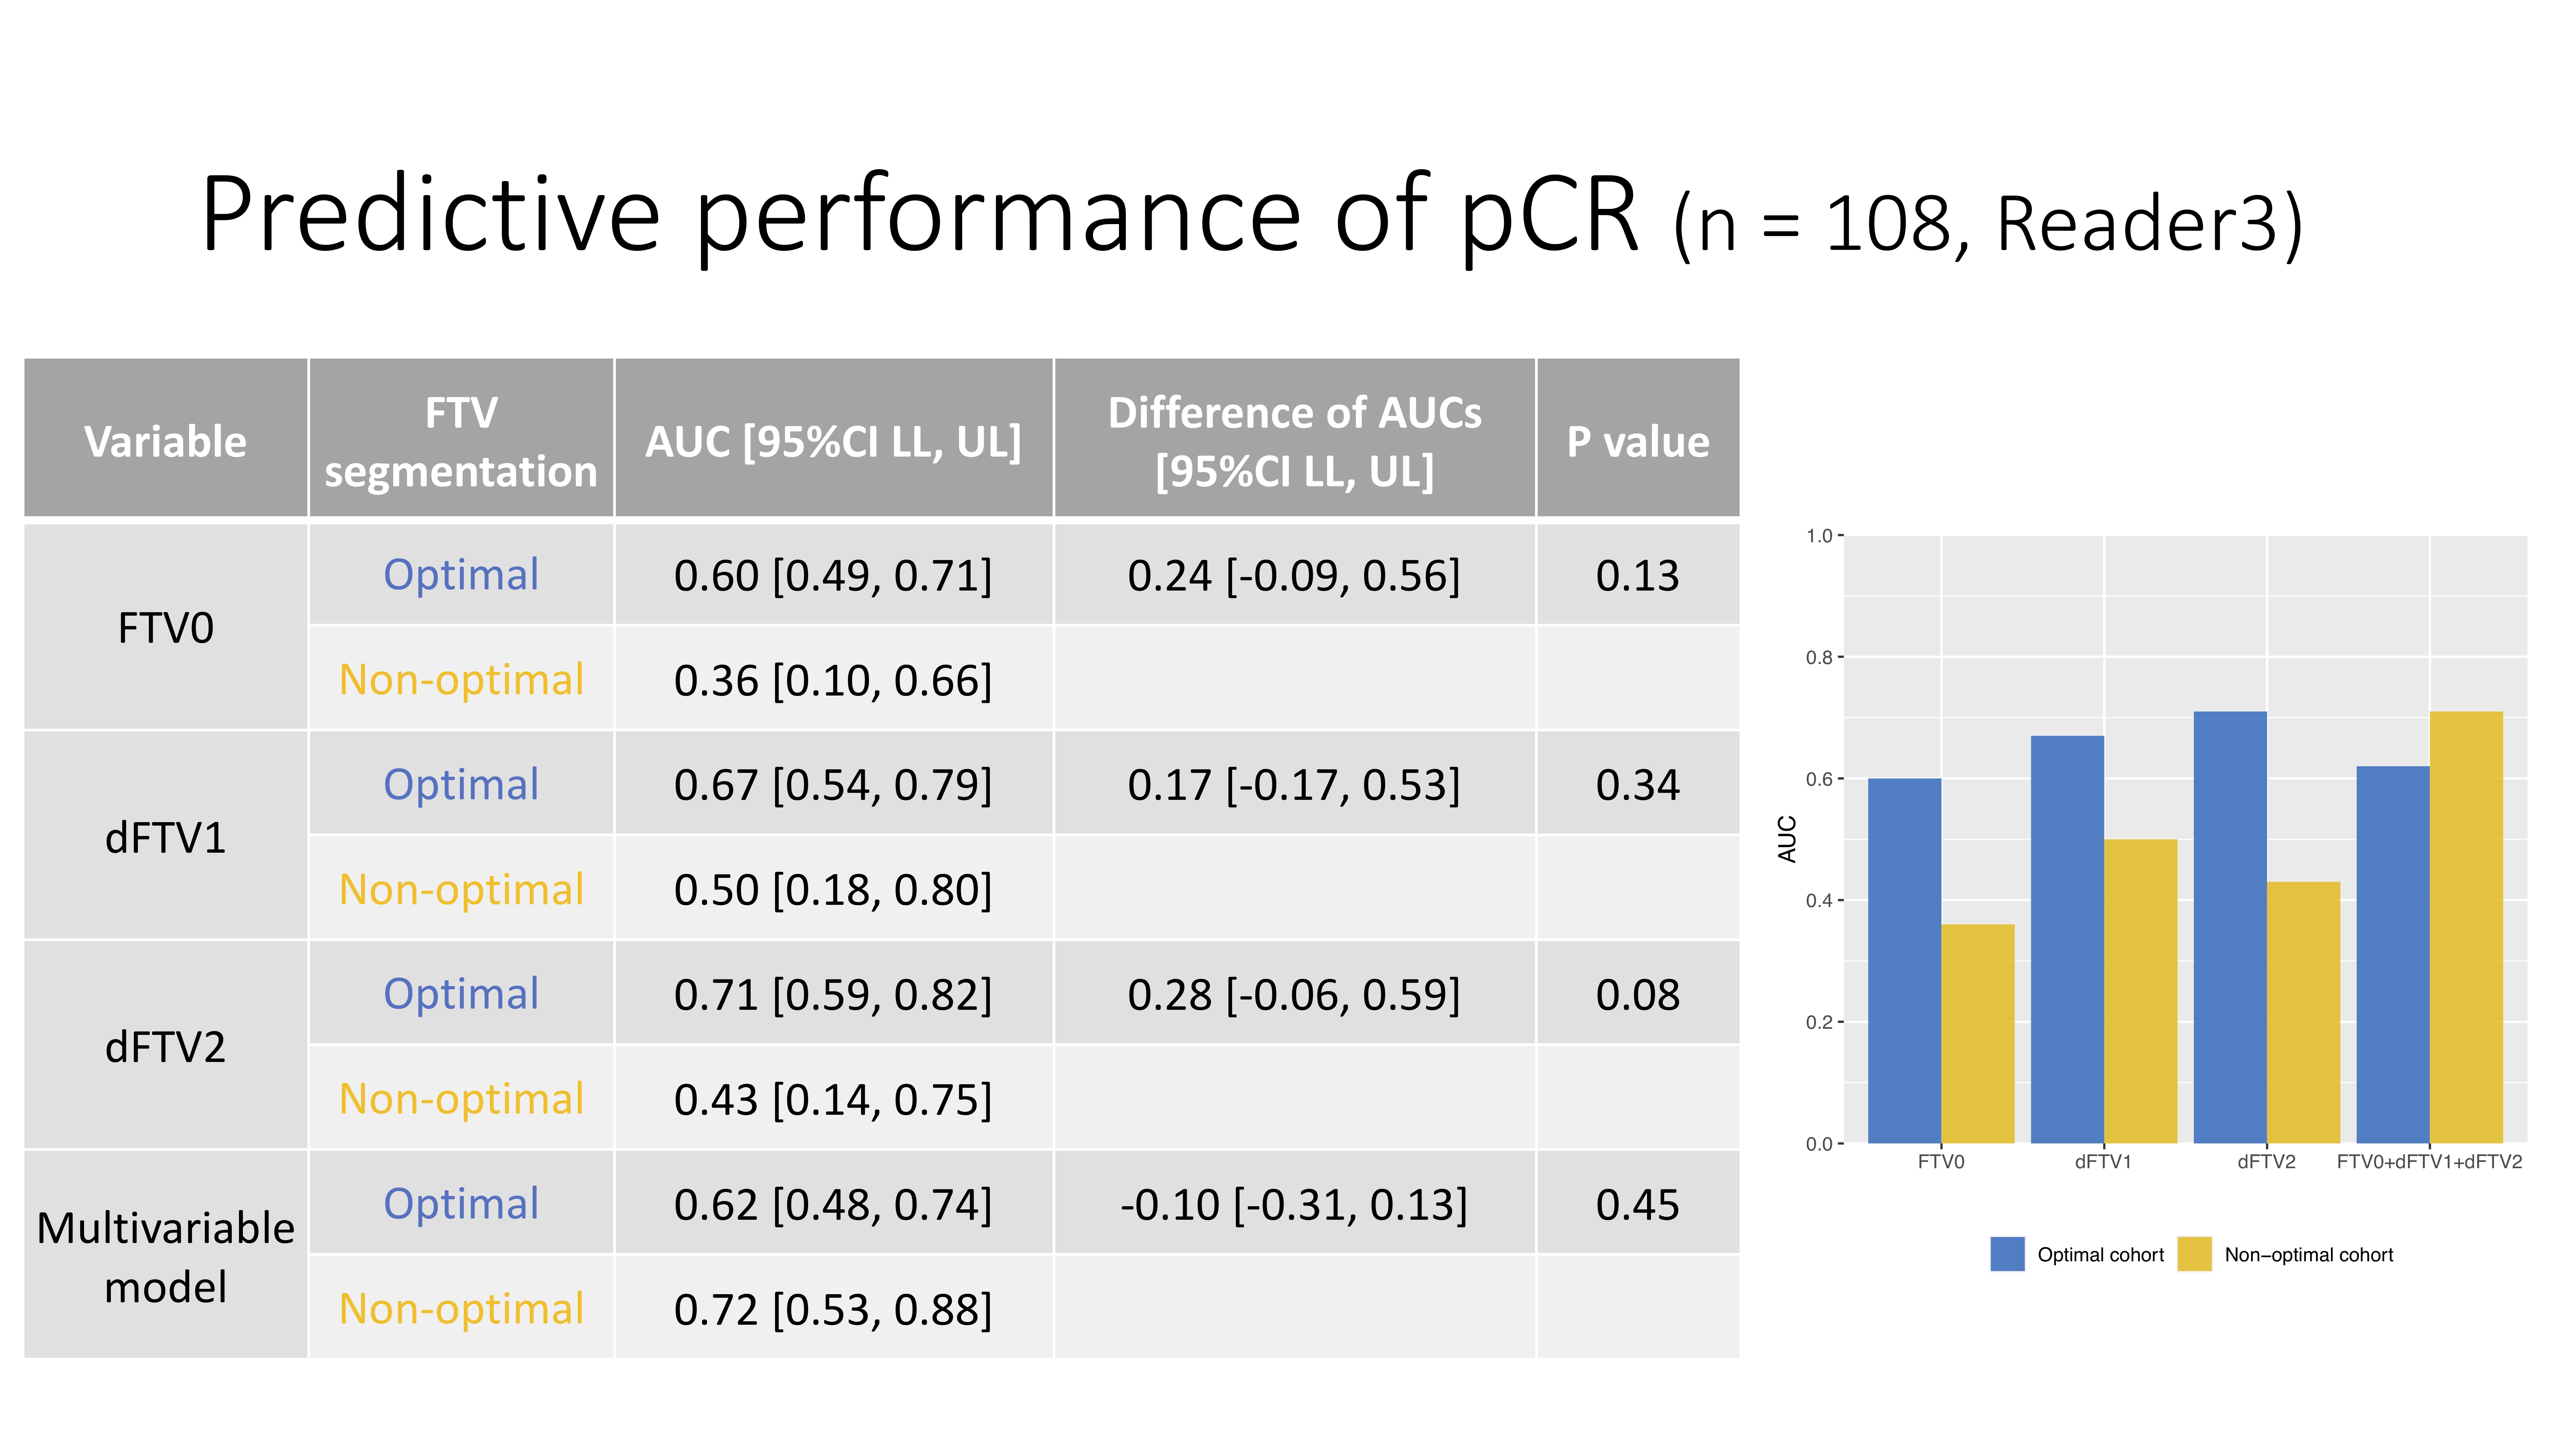
Figure 5: Predictive performance of pCR in the optimal and non-optimal segmentation groups (Sub analysis: Reader 3)
AUC values for the prediction of pCR were higher for the optimal segmentation group versus non-optimal group at both for FTV0, ∆FTV1 and ∆FTV2 (0.60 vs. 0.36, 0.67 vs. 0.50, and 0.71 vs. 0.43, respectively), although the differences did not reach statistical significance