0054
Impact of retrospective gradient nonlinearity correction on lesion ADCs and performance in the ECOG-ACRIN A6702 multicenter breast DWI trial1Radiology, University of Washington, Seattle, WA, United States, 2Center for Statistical Sciences, Brown University, Providence, RI, United States, 3Radiology, University of Michigan, Ann Arbor, MI, United States, 4Biomedical and Health Informatics, University of Washington, Seattle, WA, United States, 5Radiology and Biomedical Imaging, University of California San Francisco, San Francisco, CA, United States
Synopsis
Gradient nonlinearity (GNL) correction shows potential to improve the accuracy of ADC values collected across different MRI platforms. Here, we retrospectively applied GNL correction to breast DWI datasets collected in the ECOG-ACRIN A6702 trial by pixel-wise scaling of the ADC map with correction factor map. Our findings confirm that GNL significantly impacts multicenter breast lesion ADC values, and that GNL-based ADC errors vary significantly across MRI vendors and gradient systems. Therefore, GNL correction is important for implementation of generalizable ADC thresholds for separating benign and malignant lesions.
Introduction
Diffusion-weighted MRI (DWI) has shown clear potential for multiple breast applications including improving accuracy of breast MRI examinations, monitoring response to therapy, as well as a standalone non-contrast MRI technique for breast cancer detection [1]. The ECOG-ACRIN Cancer Research Group A6702 prospective multisite breast imaging trial recently reported promising primary findings on the performance of apparent diffusion coefficient (ADC) values to reduce unnecessary biopsies [2,3]. A strength of this study was it was performed across multiple practice sites and MRI platforms using a standardized breast DWI protocol. Previous studies have shown improvement in the accuracy of ADC measures by applying correction for system specific gradient nonlinearity (GNL), including for breast DWI [4, 5]. In this study, we evaluated the impact of GNL correction on breast lesion ADC measures and optimal ADC cutoffs for differentiation of benign and malignant breast lesions in this multi-vendor, multi-platform, multi-site clinical trial dataset.Materials and Methods
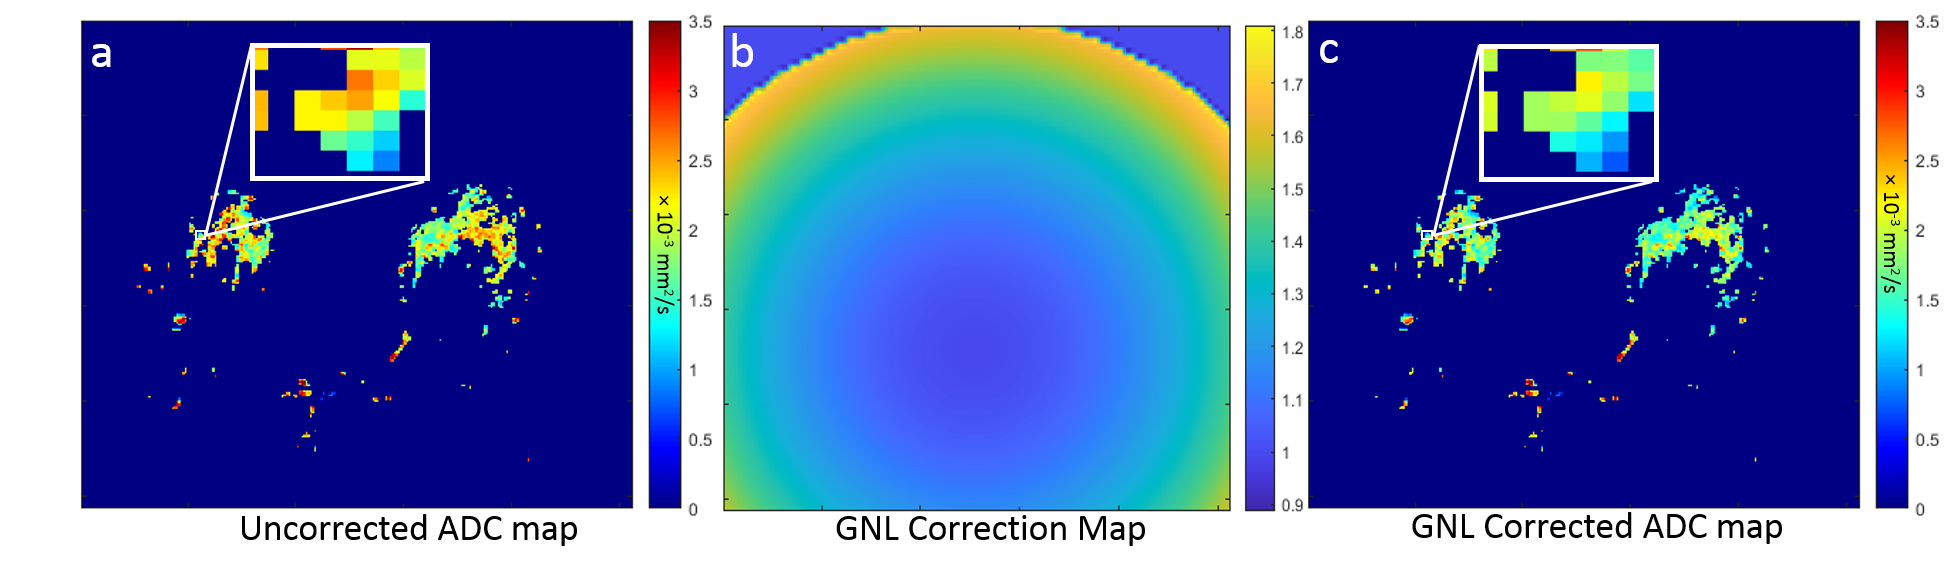
Data Acquisition and Analysis: The A6702 IRB approved imaging trial was performed at ten institutions on multiple 1.5T and 3T MRI platforms (Philips, GE, Siemens); all the scanners underwent initial DWI qualification and ongoing QC for the trial [2]. Over 1000 women consented and underwent the protocol-specified DWI scan during their clinical MRI exams from March 2014 to April 2015. A standardized single-shot DW EPI sequence with parallel imaging, fat suppression and b = 0, 100, 600, 800 s/mm2 was acquired for all the consented patients. As previously described, 107 participants had at least one BI-RADS 3, 4, or 5 lesion detected on conventional MRI, of which 67 were included in the primary analysis (13 patients were excluded for lack of reference standard, 23 for insufficient DWI quality, and 4 were ineligible or withdrew) [2]. During centralized analysis, ADC was measured for a small hotspot region-of-interest (target size 3x3 voxels) drawn on the darkest tumor region on the ADC map calculated using all the b-values and a mono-exponential diffusion model [3].System GNL correction: Gradient channel design spherical harmonics (SPH) coefficients and normalization conventions were provided by the vendors. Direction-averaged corrector maps, Cb(r)=Tr[Luk (Luk)T], were then constructed as has been previously described [5]. ADC map correction was then performed by pixel-wise scaling, ADCGNC =ADC/Cave. An example is shown in Fig 1.
Statistical Analysis: The mean ADC values before and after GNL correction were compared using a two-tailed z-test after fitting a linear regression model with generalized estimation equations and an exchangeable working correlation structure; a vendor-adjusted comparison was also performed. Benign vs. malignant lesion outcomes were determined by reference standard of tissue sampling or imaging follow-up, as appropriate [2]. Diagnostic performance was evaluated by calculating the lesion-level area under the receiver operating characteristic curve (AUC) along with bootstrapped 95% confidence intervals (CIs). An ADC cutoff was chosen to maximize sensitivity while maintaining 100% sensitivity (i.e., the highest malignant ADC value) in all the lesions; unnecessary biopsy reduction and overall biopsy reduction were calculated by applying the cutoff to benign BI-RADS 4 and 5 lesions and all BI-RADS 4 and 5 lesions, respectively.
Results
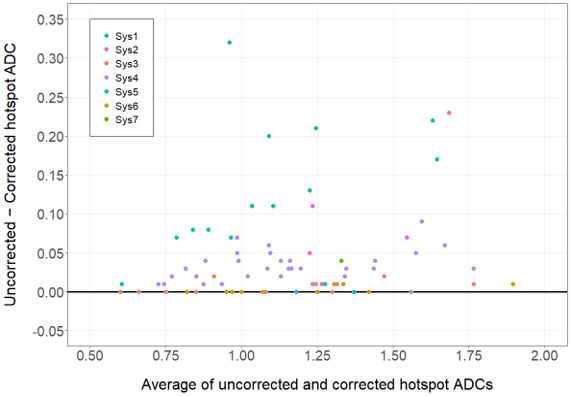
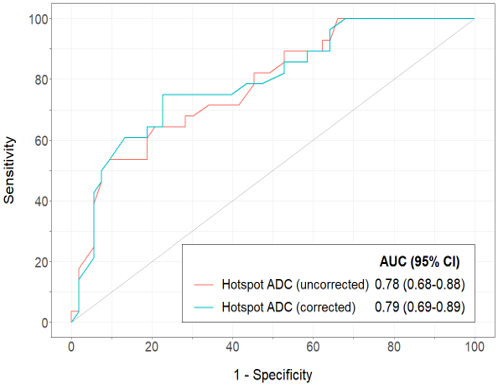
The study evaluated 81 breast lesions (53 benign, 28 malignant) in 67 women (median age: 49 years; range 24 – 75 years). The lesion BI-RADS assessments were 3 (n=14), 4 (n=63), 5 (n=4). The scans were performed on 9 different MRI scanners representing 7 distinct gradient systems (3 vendors, 2 field strengths). GNL-corrected lesion ADCs were significantly different from the uncorrected ADCs (mean ADCGNC = 1.12 ± 0.29 vs. uncorrected ADC = 1.17 ± 0.30 x10⁻³ mm2/s, p<0.001). GNL error in breast lesion ADCs varied across gradient systems (Fig 2), with mean ∆ADCs (uncorrected-corrected) of 0.14 ±0.08, 0.03 ±0.02, 0.004 ±0.01 for vendor A (2 gradient systems), B (2 gradient systems) and C (3 gradient systems), respectively, p<0.001. GNL correction affected both benign and malignant lesion ADC values (mean ∆ADC = 0.04 x10⁻³ mm2/s for both lesion types) and did not change diagnostic performance, with AUC = 0.78 (95% CI 0.68-0.88) for uncorrected vs. 0.79 (95% CI 0.69-0.89) for corrected, p=0.22 (Fig 3). GNL correction would result in a slightly lower hotspot ADC cutoff (1.33 vs. 1.35 x10⁻³ mm2/sec), and both cutoffs could reduce unnecessary biopsies by 30.8% (12/39 benign lesions) and the overall biopsy rate by 17.9% (12/67 lesions).Conclusion and Discussion
This study showed GNL substantially affects lesion ADC measures, with significant variability across vendor MRI platforms. While significant effects on diagnostic performance were not identified, results suggest that clinical implementation of absolute ADC cutoffs to improve MRI accuracy and reduce unnecessary biopsies will have variable performance levels based on MRI gradient platform if not correcting for GNL. GNL correction should be implemented across all scanner platforms to ensure uniformity and consistency of diagnostic breast lesion ADC measures, particularly if considering incorporation of ADC as a quantitative marker in standardized breast MRI interpretation strategies (e.g. BI-RADS) or for multi-vendor multi-platform clinical studies.Acknowledgements
Supported by NIH grants U10CA180820, U10CA180794, UG1CA233160, UG1CA233328, R01CA207290, R01CA190299, U01CA225427, R01CA203883References
1. Partridge SC, Nissan N, Rahbar H, Kitsch AE, Sigmund EE. Diffusion-weighted breast MRI: Clinical applications and emerging techniques. J Magn Reson Imaging. 2017 Feb:45(2):337-355.
2. Rahbar H, et al. Utility of diffusion-weighted imaging to decrease unnecessary biopsies prompted by breast MRI: a trial of the ECOG-ACRIN Cancer Research Group (A6702). Clin Cancer Res 2019;25(6):1756–1765.
3. McDonald ES at al Mean Apparent Diffusion Coefficient Is a Sufficient Conventional Diffusion-weighted MRI Metric to Improve Breast MRI Diagnostic Performance: Results from the ECOG-ACRIN Cancer Research Group A6702 Diffusion Imaging Trial. Radiology 2020; 00:1–11
4. Newitt DC, Tan ET, Wilmes LJ, Chenevert TL, Kornak J, Marinelli L, and Hylton N. Gradient Nonlinearity Correction to Improve Apparent Diffusion Coefficient Accuracy and Standardization in the American College of Radiology Imaging Network 6698 Breast Cancer Trial. J Magn Reson Imaging. 2015;42(4):908-19
5. Malyarenko DI et al Retrospective Correction of ADC for Gradient Nonlinearity Errors in Multicenter Breast DWI Trials: ACRIN6698 Multiplatform Feasibility Study Tomography. 2020;6(2):86-92
Figures