0053
Diffusion weighted and kurtosis breast cancer imaging for b=0-1800 s/mm2: Comparisons to dynamic contrast enhanced MRI1Weizmann Institute of Science, Rehovot, Israel, 2Sheba Medical Center, Ramat Gan, Israel, 3Kaplan Medical Center, Rehovot, Israel, 4Ben Gurion University Hospital, Beer Sheba, Israel, 5Tel Aviv University, Tel Aviv, Israel
Synopsis
Spatiotemporal encoding (SPEN) is an alternative ultrafast imaging technique which allows to overcome distortions otherwise observed along EPI’s phase-encoded dimension, and to perform self-referenced phase corrections in interleaved diffusion weighted imaging (DWI) scans. This study compares SPEN’s performance against multishot read-out segmented EPI (RESOLVE), with an emphasis on high-b-valued DWI and diffusion kurtosis imaging in the context of breast cancer imaging. The results show SPEN’s advantages for delivering kurtosis maps that provide a separation between cancerous and healthy tissues. The potential of using SPEN DW images acquired with high b-values as an alternative to DCE subtractions is also assessed.
Introduction
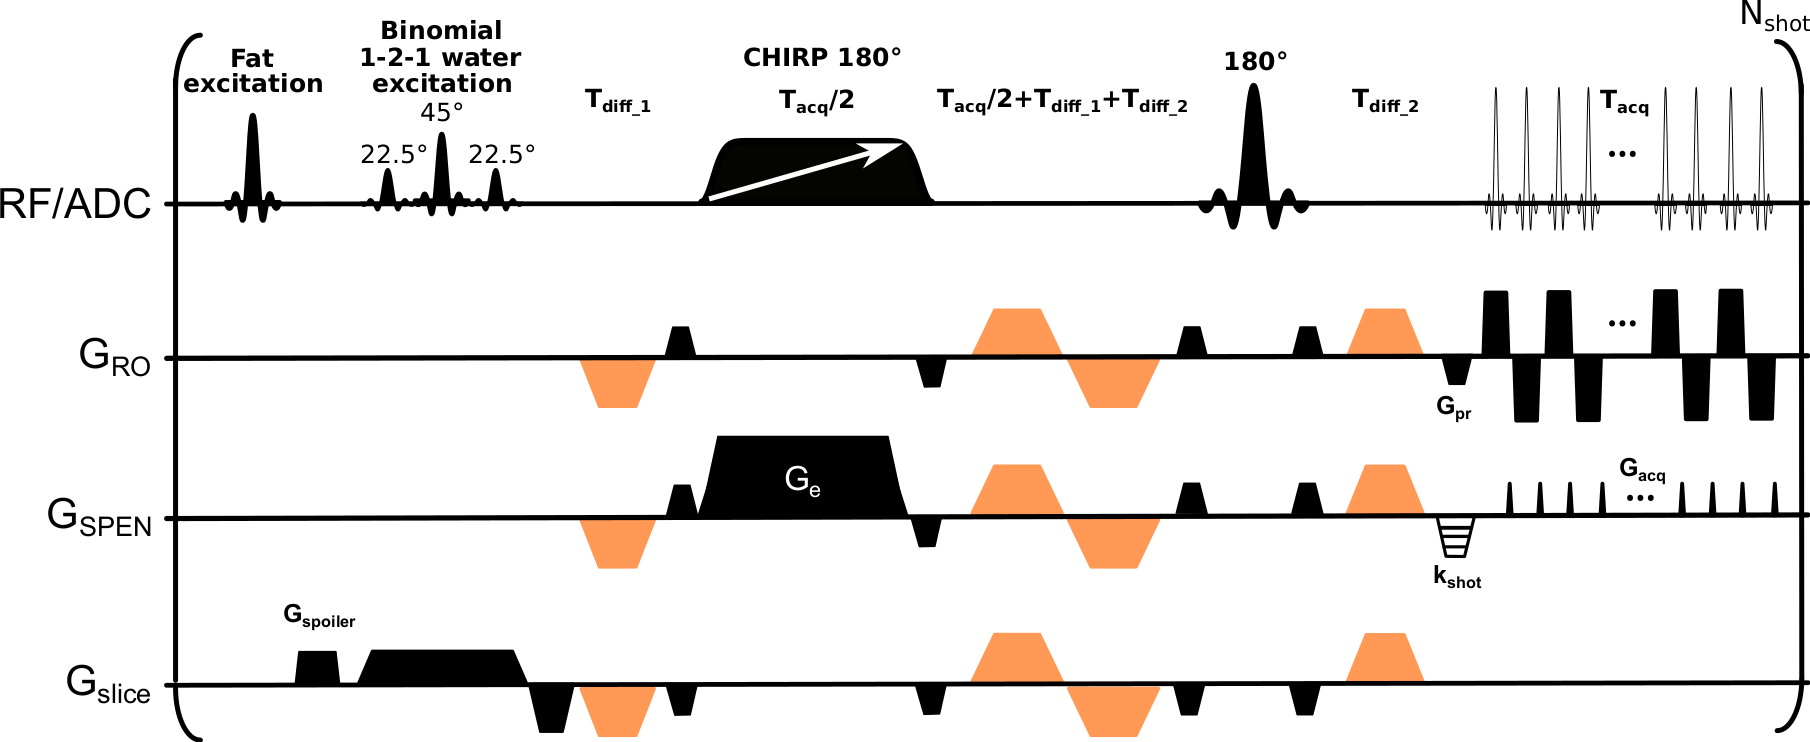
Diagnosis of cancerous breast lesions by MRI typically relies on dynamic contrast enhanced (DCE) protocols. Despite numerous advantages, DCE faces a number of limitations.1 Diffusion-weighted imaging (DWI) is emerging as a promising technique to help DCE in diagnosing and delineate the extent of breast cancers.2,3 DWI relies on the contrast provided by moderate (b≈800 s/mm2) diffusion weightings, and on apparent diffusion coefficient (ADC) maps derived using monoexponential signal decay models as a function of b. Due to their use of bipolar diffusion-weighting gradients these experiments use single-shot echo-planar imaging (EPI) techniques, that avoid motion induced phase inconsistencies associated with multi-shot data. EPI’s limitations often constrain the resolution achievable in these studies, leading to distortions along the phase-encoding (PE) direction and to susceptibility and fat/water artifacts.Herein we explore the potential of spatiotemporal encoding4 (SPEN, Figure 1) in high-b-valued breast cancer studies. SPEN enjoys a number of advantages vs EPI: it can perform self-referenced phase corrections in interleaved acquisitions, it allows one “tuning” the PE bandwidth (BW) to cope with image distortions, and can operate in a “full-refocusing” mode leading to reduced field distortions. SPEN’s potential to examine breast lesions using strong diffusion weightings is here explored within the contexts of kurtosis imaging, and compared to that of multi-shot read-out segmented EPI (RESOLVE) sequences.5 The benefits of SPEN to deliver kurtosis maps highlighting the cancers are demonstrated, and its potential to “light-up” lesions with high b-weighting in a manner akin to that of subtracted DCE imaging, is shown.
Methods
13 patients with biopsy-confirmed breast cancers –8 with invasive ductal carcinoma (IDC) and 5 with invasive lobular carcinoma (ILC)– were prospectively enrolled in the study after signing suitable written consents. Images were acquired at 3T on a Siemens Prisma scanner using a 16-channel bilateral receiving breast coil. The clinical protocol included T2-weighted 2D Turbo Spin-Echo and T1-weighted 3D GRE sequences with Dotarem® injected for the DCE studies.DWI consisted of reduced field-of-view acquisitions using RESOLVE and SPEN recorded at 1x1x3 mm3 resolution, targeting three slices in an axial orientation using the following nominal b-values (and repetitions): 0 (1), 500 (1), 850 (3), 1200 (6) and 1800 (6) s/mm2. Three orthogonal diffusion directions with ~3 kHz BWs along the PE direction and using three interleaved scans along the low (PE) and high (readout) bandwidth directions, were acquired for SPEN and RESOLVE, respectively.
ADC values were fitted as per $$$S(b)=S_{0}exp(-b\times ADC)$$$ and kurtosis coefficients K, mean diffusivities MD, were fitted as per $$$𝑆(𝑏) = S_{0} 𝑒𝑥𝑝(−𝑏\times 𝑀𝐷+b^{2}\times MD^{2}×𝐾/6)$$$, where S(b) and S0 denote signal intensities with and without DW gradients.
Results & Discussion
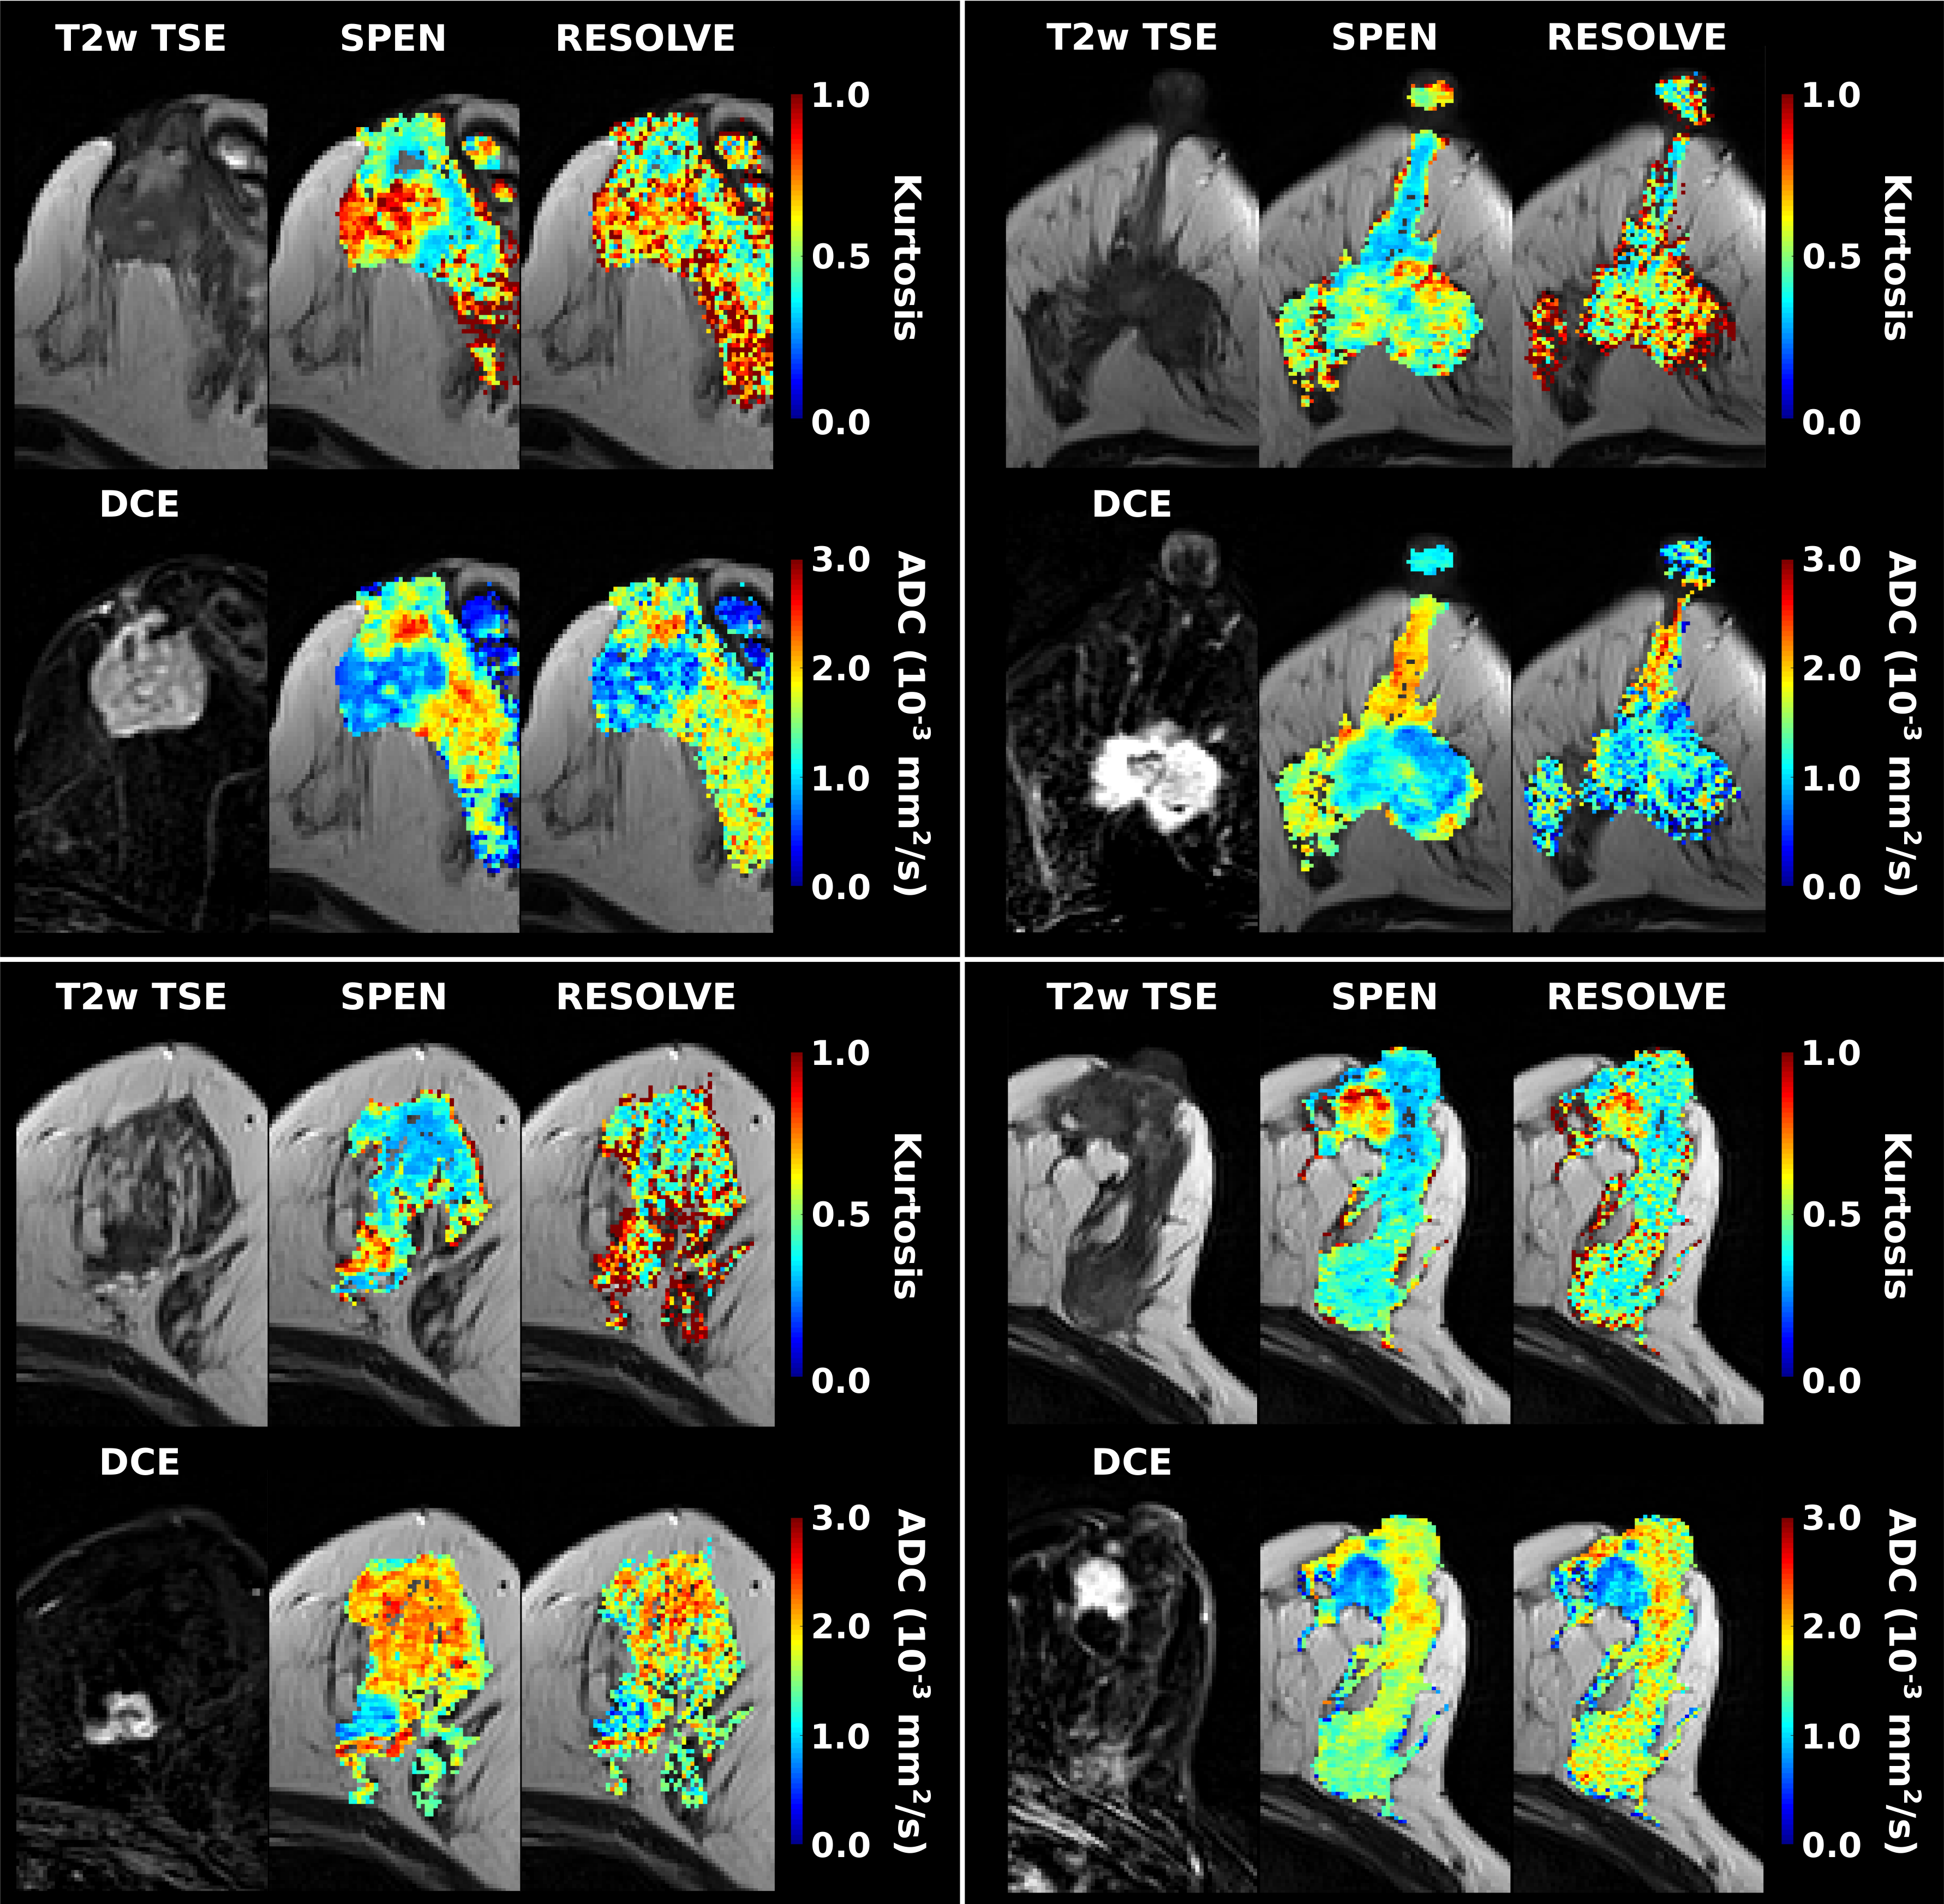
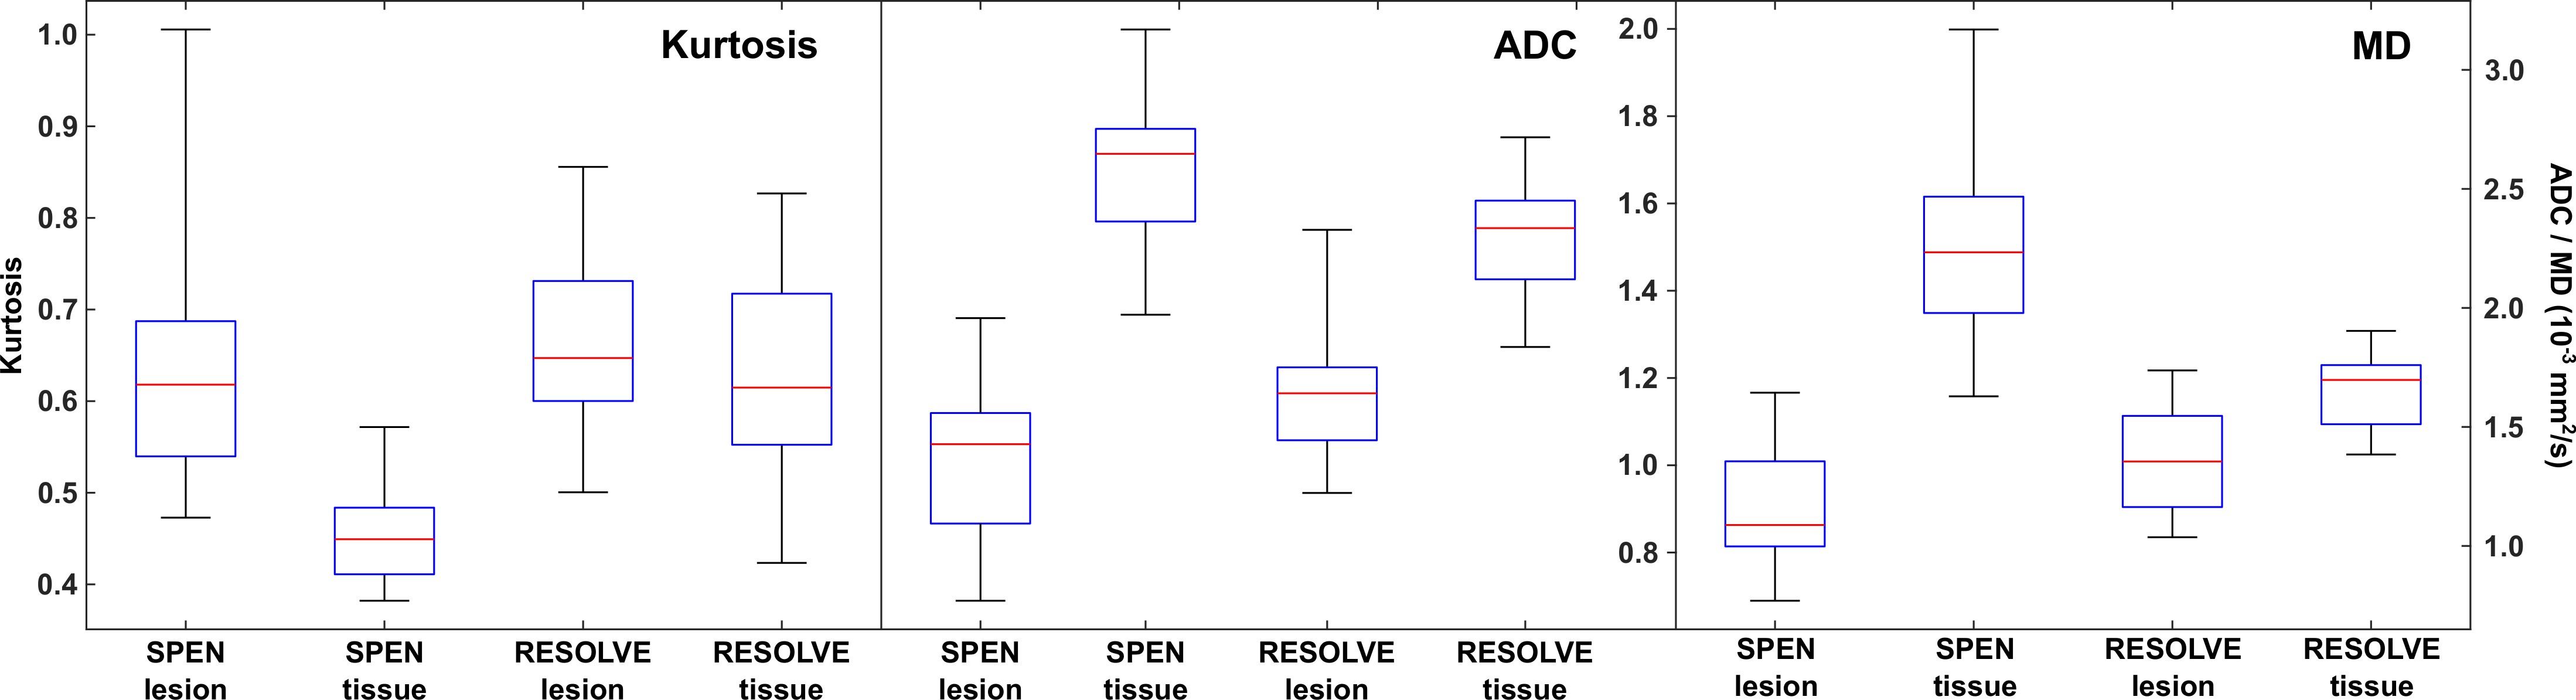
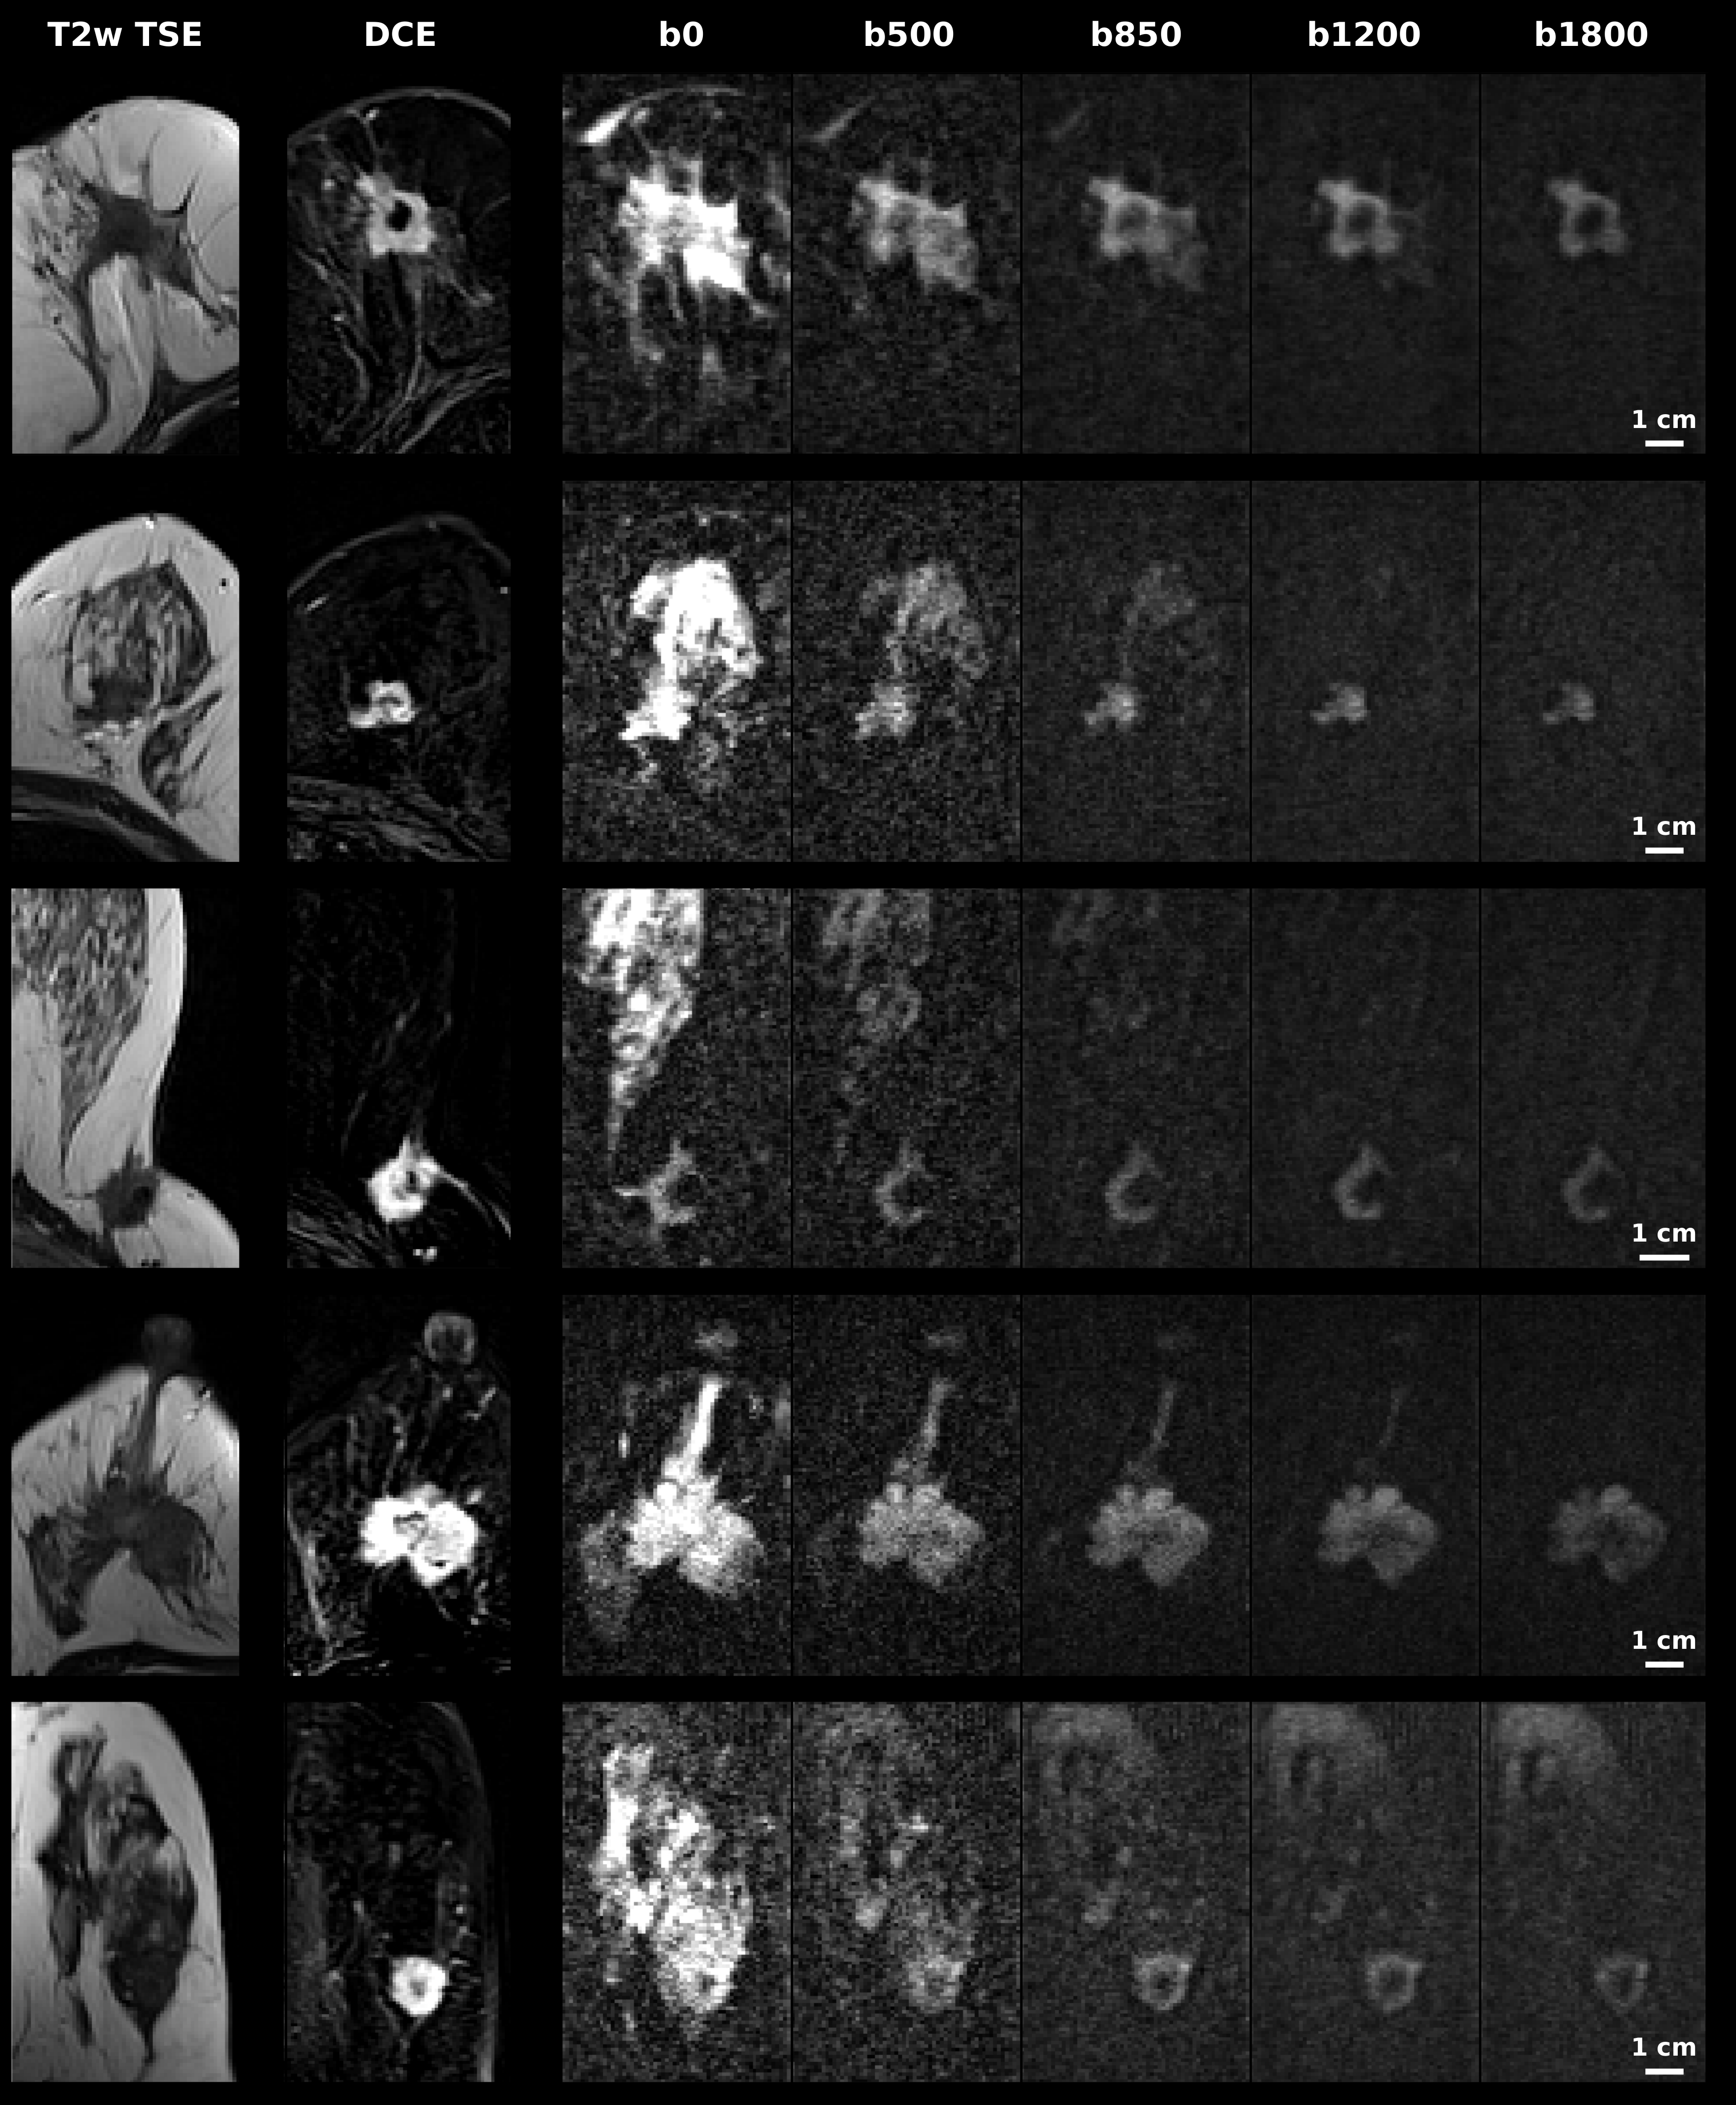
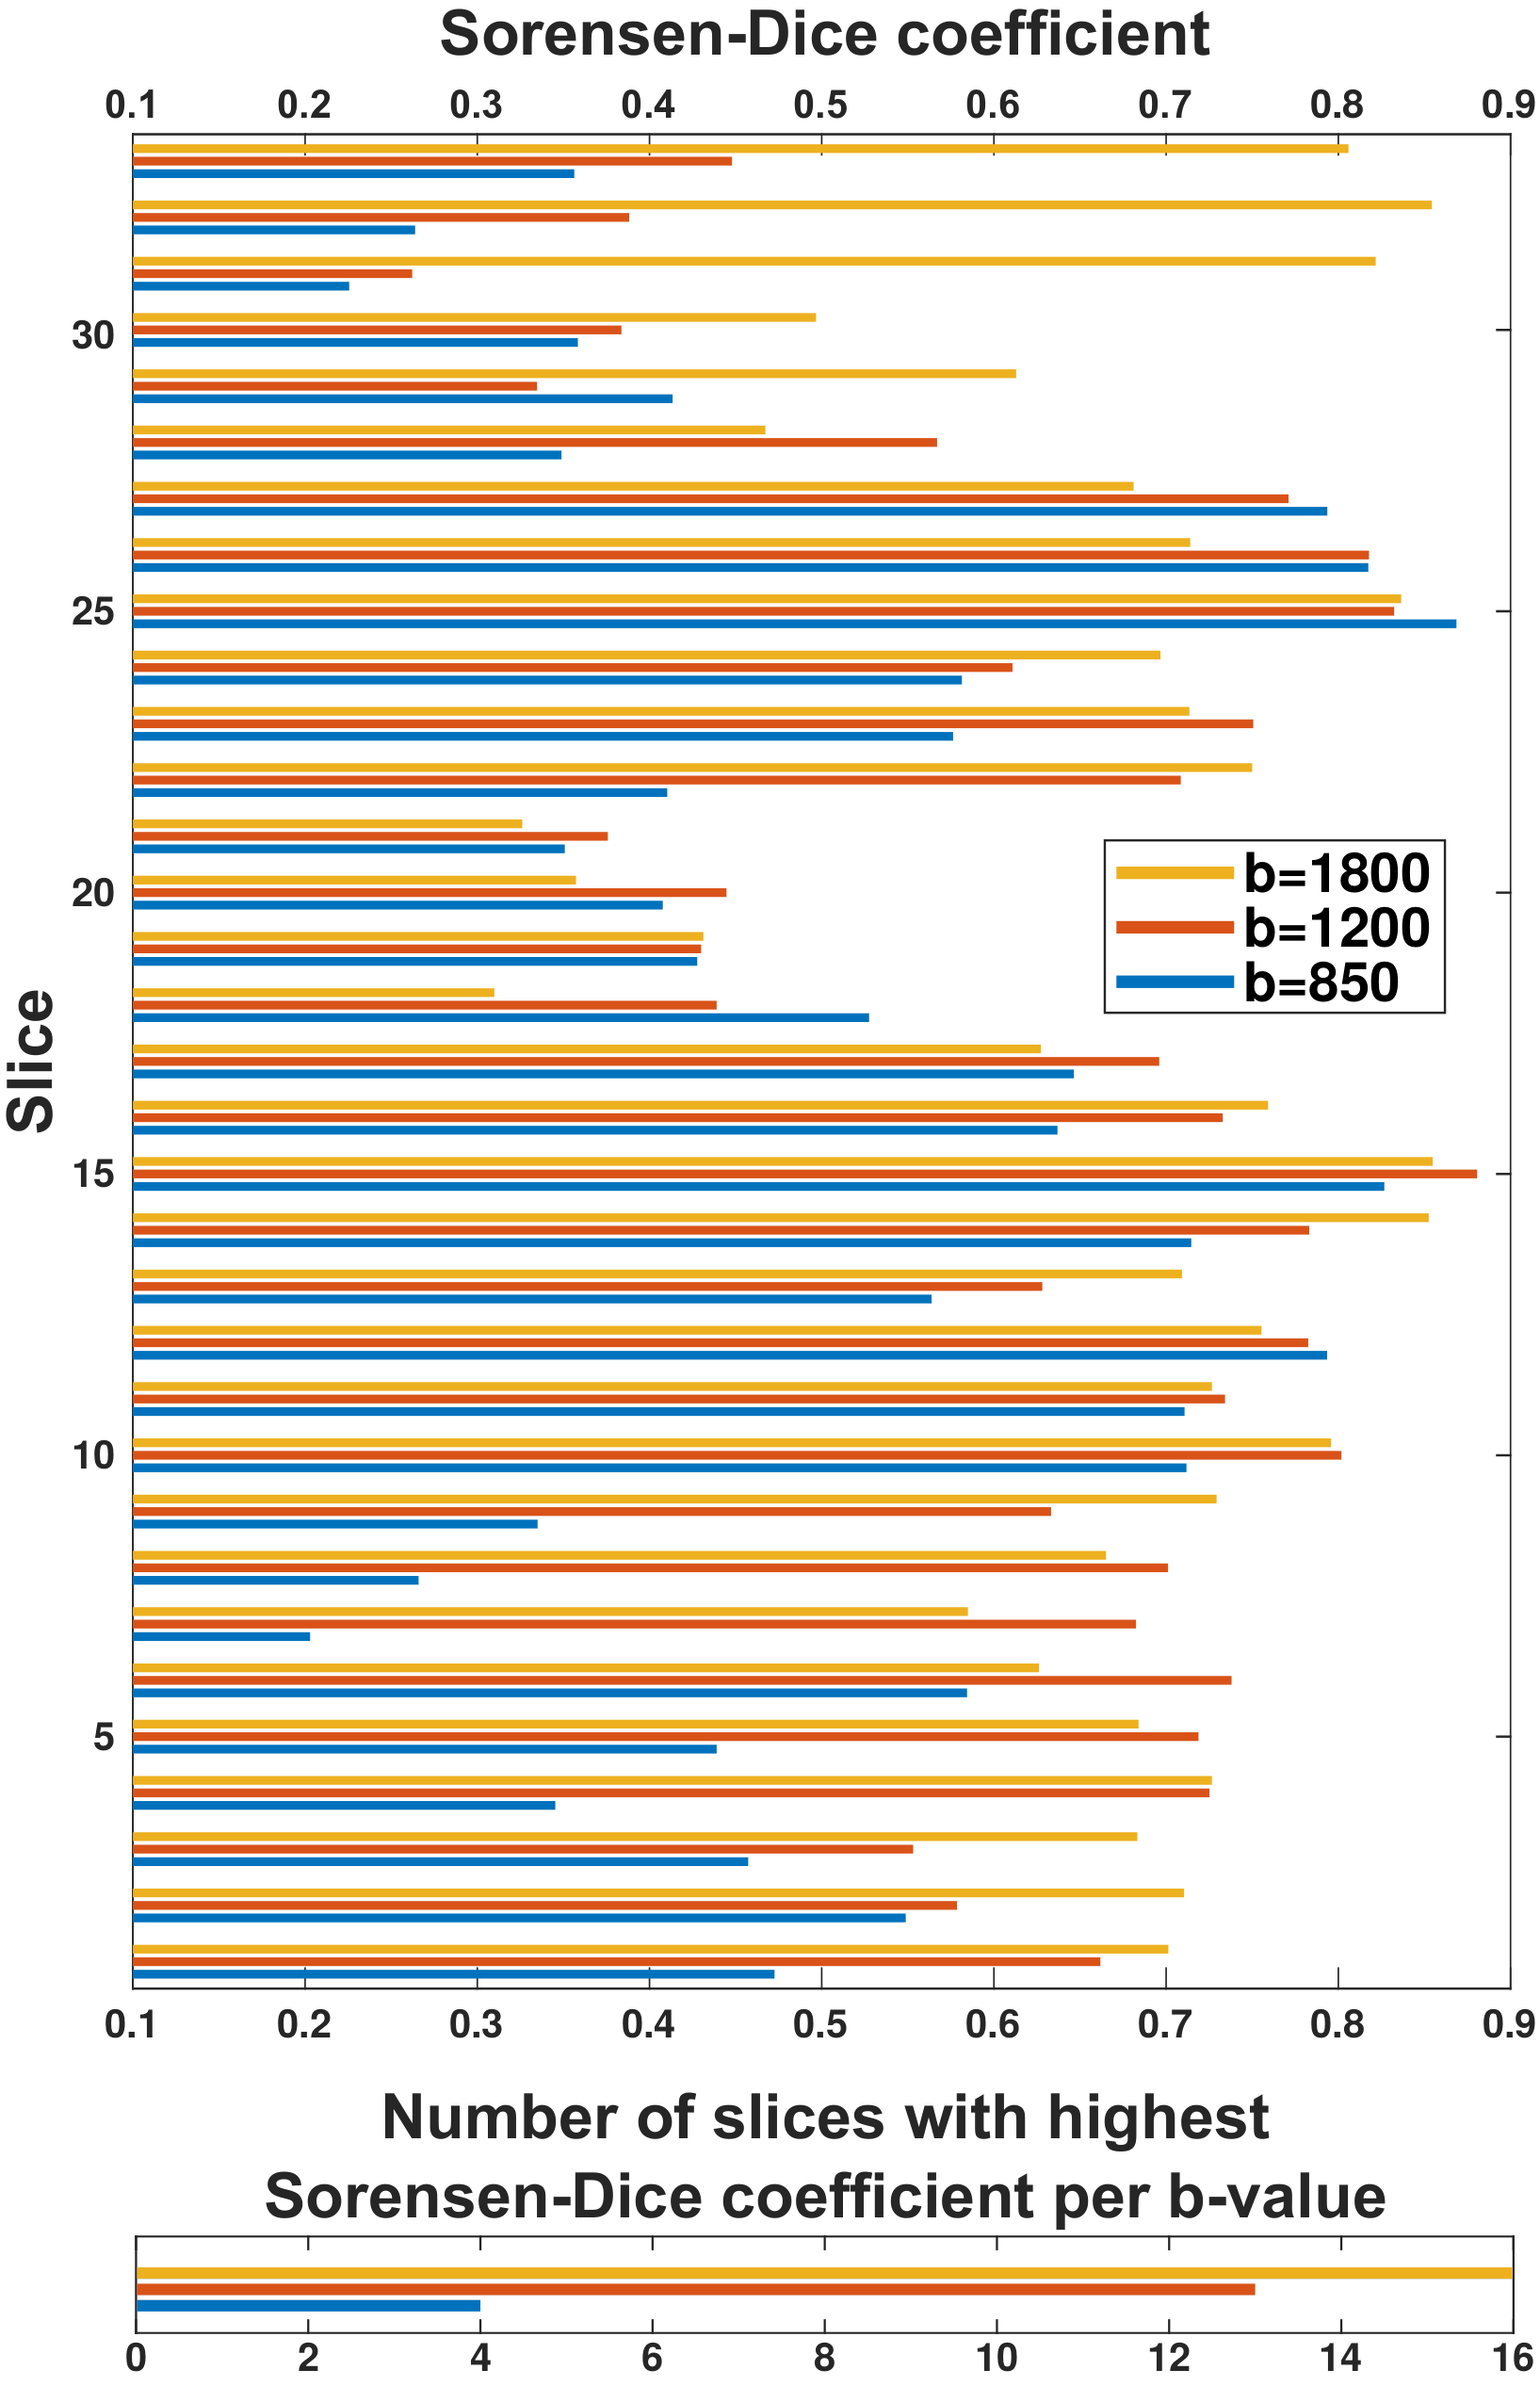
Representative ADC and kurtosis maps obtained by SPEN and RESOLVE are shown in Fig. 2; also shown are DCE images acting as “gold standard”. Notice the superior SNR and definition of SPEN acquisitions. After segmenting tissues into cancerous and healthy regions, average ADC, kurtosis and MD values were derived for respective zones and their potential to assist in diagnosis was assessed using box plots. In all instances, SPEN provided a superior discrimination of the lesions (Fig. 3). ADCs provided the clearest diagnostic separation between tumors and normal tissue: paired t-tests yield p<0.0001 and p=0.00026 for the average SPEN and RESOLVE data, respectively. Good discrimination also arose when analyzing the MD values: p=0.0005 and 0.0006, from paired t-test SPEN and RESOLVE data, respectively. Differentiation based on kurtosis was feasible by SPEN (p=0.0008, paired t-test). RESOLVE was unable to separate lesions from normal tissues (p=0.2483, paired t-test); probably reflecting RESOLVE’s insufficient SNR for the strongly b-weighted images required for the kurtosis fitting.Figure 4 shows SPEN’s ability to highlight nearly exclusively the lesions, when DWI is performed at high-b values. Given the DCE-like selectivity of this DWI data, the information content and the congruence residing in b≥850 s/mm2 SPEN and in subtracted DCE images were compared using Sorensen-Dice coefficients. These were calculated based on the formula $$$\frac{2\times (Area(DWI) \bigcap Area(DCE))}{Area(DWI)+Area(DCE)}$$$,7 where Area(DWI) and Area(DCE) correspond to the lesion areas delineated in the DWI SPEN and the DCE images respectively. Figure 5 summarizes these Sorensen-Dice coefficients reporting on image similarities, over all the slices collected. When averaged over the full set their values were 0.51, 0.62 and 0.67 for b=850, 1200 and 1800 s/mm2, suggesting that b=1800 s/mm2 provides the DWI images that match best the DCE data.
Conclusion
The results herein show that: 1) SPEN, but not always RESOLVE, could reliably characterize breast cancer lesions according to their kurtosis. 2) Kurtosis does not provide a better discrimination between malignant and healthy breast tissues over its ADC counterpart. 3) SPEN images acquired with b=1800 s/mm2, provides the clearest DWI-based contrast to assess the presence of malignancies.Acknowledgements
This work was funded by the Israel Science Foundation via grants 2508/17 and 965/18, by the Sheba MC - Weizmann Institute Joint Research Program, and by the generosity of the Perlman Family Foundation.References
1. Mann RM, Balleyguier C, Baltzer PA, et al.: Breast MRI: EUSOBI recommendations for women’s information. Eur Radiol 2015; 25:3669–3678.
2. Sardanelli F, Boetes C, Borisch B, et al.: Magnetic resonance imaging of the breast: recommendations from the EUSOMA working group. Eur J Cancer 2010; 46:1296–1316.
3. Iima M, Honda M, Sigmund EE, Ohno Kishimoto A, Kataoka M, Togashi K: Diffusion MRI of the breast: Current status and future directions. J Magn Reson Imaging 2020; 52:70–90.
4. Shrot Y, Frydman L: Spatially encoded NMR and the acquisition of 2D magnetic resonance images within a single scan. J Magn Reson 2005; 172:179–190.
5. Porter DA, Heidemann RM: High resolution diffusion-weighted imaging using readout-segmented echo-planar imaging, parallel imaging and a two-dimensional navigator-based reacquisition. Magn Reson Med 2009; 62:468–475.
6. Schmidt R, Frydman L: New spatiotemporal approaches for fully refocused, multislice ultrafast 2D MRI. Magn Reson Med 2014; 71:711–722.
7. Zou KH, Warfield SK, Bharatha A, et al.: Statistical validation of image segmentation quality based on a spatial overlap index. Acad Radiol 2004; 11:178–189.
Figures