0048
MR Multitasking-based Dynamic Imaging for Cerebrovascular Evaluation (MT-DICE): Further Development and Feasibility Study on Brain Cancer1Biomedical Imaging Research Institute, Cedars-Sinai Medical Center, Los Angeles, CA, United States, 2Department of Bioengineering, University of California, Los Angeles, Los Angeles, CA, United States, 3Department of Imaging, Cedars-Sinai Medical Center, Los Angeles, CA, United States, 4Department of Radiation Oncology, Keck School of Medicine, University of Southern California, Los Angeles, CA, United States, 5Department of Radiology, Keck School of Medicine, University of Southern California, Los Angeles, CA, United States
Synopsis
DSC-MRI and DCE-MRI provide perfusion- and permeability-related parameters, respectively, and are evolving as increasingly common modalities for evaluating a variety of brain cancer diseases. Their different but complementary information may form a more complete basis for evaluation of the complex and heterogeneous tumor microenvironment. However, acquiring both in one exam requires two separate scans as well as two contrast injections. In this work, we propose an MR MultiTasking based Dynamic Imaging for Cerebrovascular Evaluation (MT-DICE) technique that provides DCE- and leakage-corrected DSC-MRI parameters simultaneously with one 7.6-minute scan and a single-dose contrast injection.
Introduction
Dynamic susceptibility contrast MRI (DSC-MRI) and dynamic contrast enhanced MRI (DCE-MRI) are commonly used for assessing cerebrovascular perfusion and permeability hemodynamics1,2. Evaluation of both perfusion and permeability is desirable for better risk stratification and prognosis. Although acquiring both sequences separately in one imaging session is possible in principle, they require additional scan time and two contrast agent (CA) injections. Moreover, conventional EPI-based DSC-MRI is susceptible to T1-shortening effects in cases of CA extravasation due to blood-brain barrier (BBB) disruption3, especially in brain tumor patients. It has been demonstrated that either multi-echo-based acquisitions4-7 or pharmacokinetic modeling-based postprocessing8-10 could address the T1-leakage effects. However, CA extravasation also results in T2*-related leakage effects11,12, leading to overestimations of the perfusion parameters. DCE-MRI has proven valuable for assessing BBB integrity13, where the permeability information can be further applied to correct for CA leakage effects in DSC-MRI6,14. We have recently developed an MR MultiTasking based Dynamic Imaging for Cerebrovascular Evaluation (MT-DICE) technique for simultaneously DCE- and DSC-MRI quantification with a single-bolus injection. In this work, we refined MT-DICE by incorporating the extended Toft’s model for more complete permeability quantification and implementing leakage correction for more accurate perfusion metrics, and performed comprehensive assessment on healthy volunteers and brain cancer patients.Methods
Sequence Design: MT-DICE employs a 3D Cartesian acquisition with periodic non-selective saturation recovery (SR) preparations followed by multi-echo FLASH readouts. The high-temporal-resolution training data are collected every 4 readouts at the center encoding line, and the imaging data are randomly sampled with a variable-density Gaussian pattern.Imaging Framework: Image reconstruction is performed based on MR multitasking framework15 to exploit the correlation between brain images along different time dimensions (SR time $$$\tau$$$, echo time $$$T_{E}$$$, and contrast phase $$$t$$$) for accelerated imaging. Specifically, MT-DICE models the 6-dimensional image $$$A(x,y,z,\tau ,T_{E},t)$$$ as a low-rank tensor $$$\mathscr{A}=\phi \times _{1}\textbf{U}_{\textbf{r}}$$$. The temporal factor tensor $$$\phi$$$ is first determined from the training data and the spatial coefficients $$$\textbf{U}_{\textbf{r}}$$$ are reconstructed by fitting $$$\phi$$$ to the imaging data $$$\textbf{d}$$$, with undersampling pattern $$$\Omega$$$, spatial encoding model $$$\textbf{E}$$$ and regularization parameter $$$\lambda $$$ for spatial total variation penalty $$$TV(\cdot )$$$.
$$\hat{\textbf{U}}_{\textbf{r}}=\underset{\textbf{U}_{\textbf{r}}}{\arg \min}\left \| \textbf{d}-\Omega (\phi\times _{1}\textbf{E}\textbf{U}_{\textbf{r}}) \right \|_{2}^{2}+\lambda TV(\textbf{U}_{\textbf{r}})$$
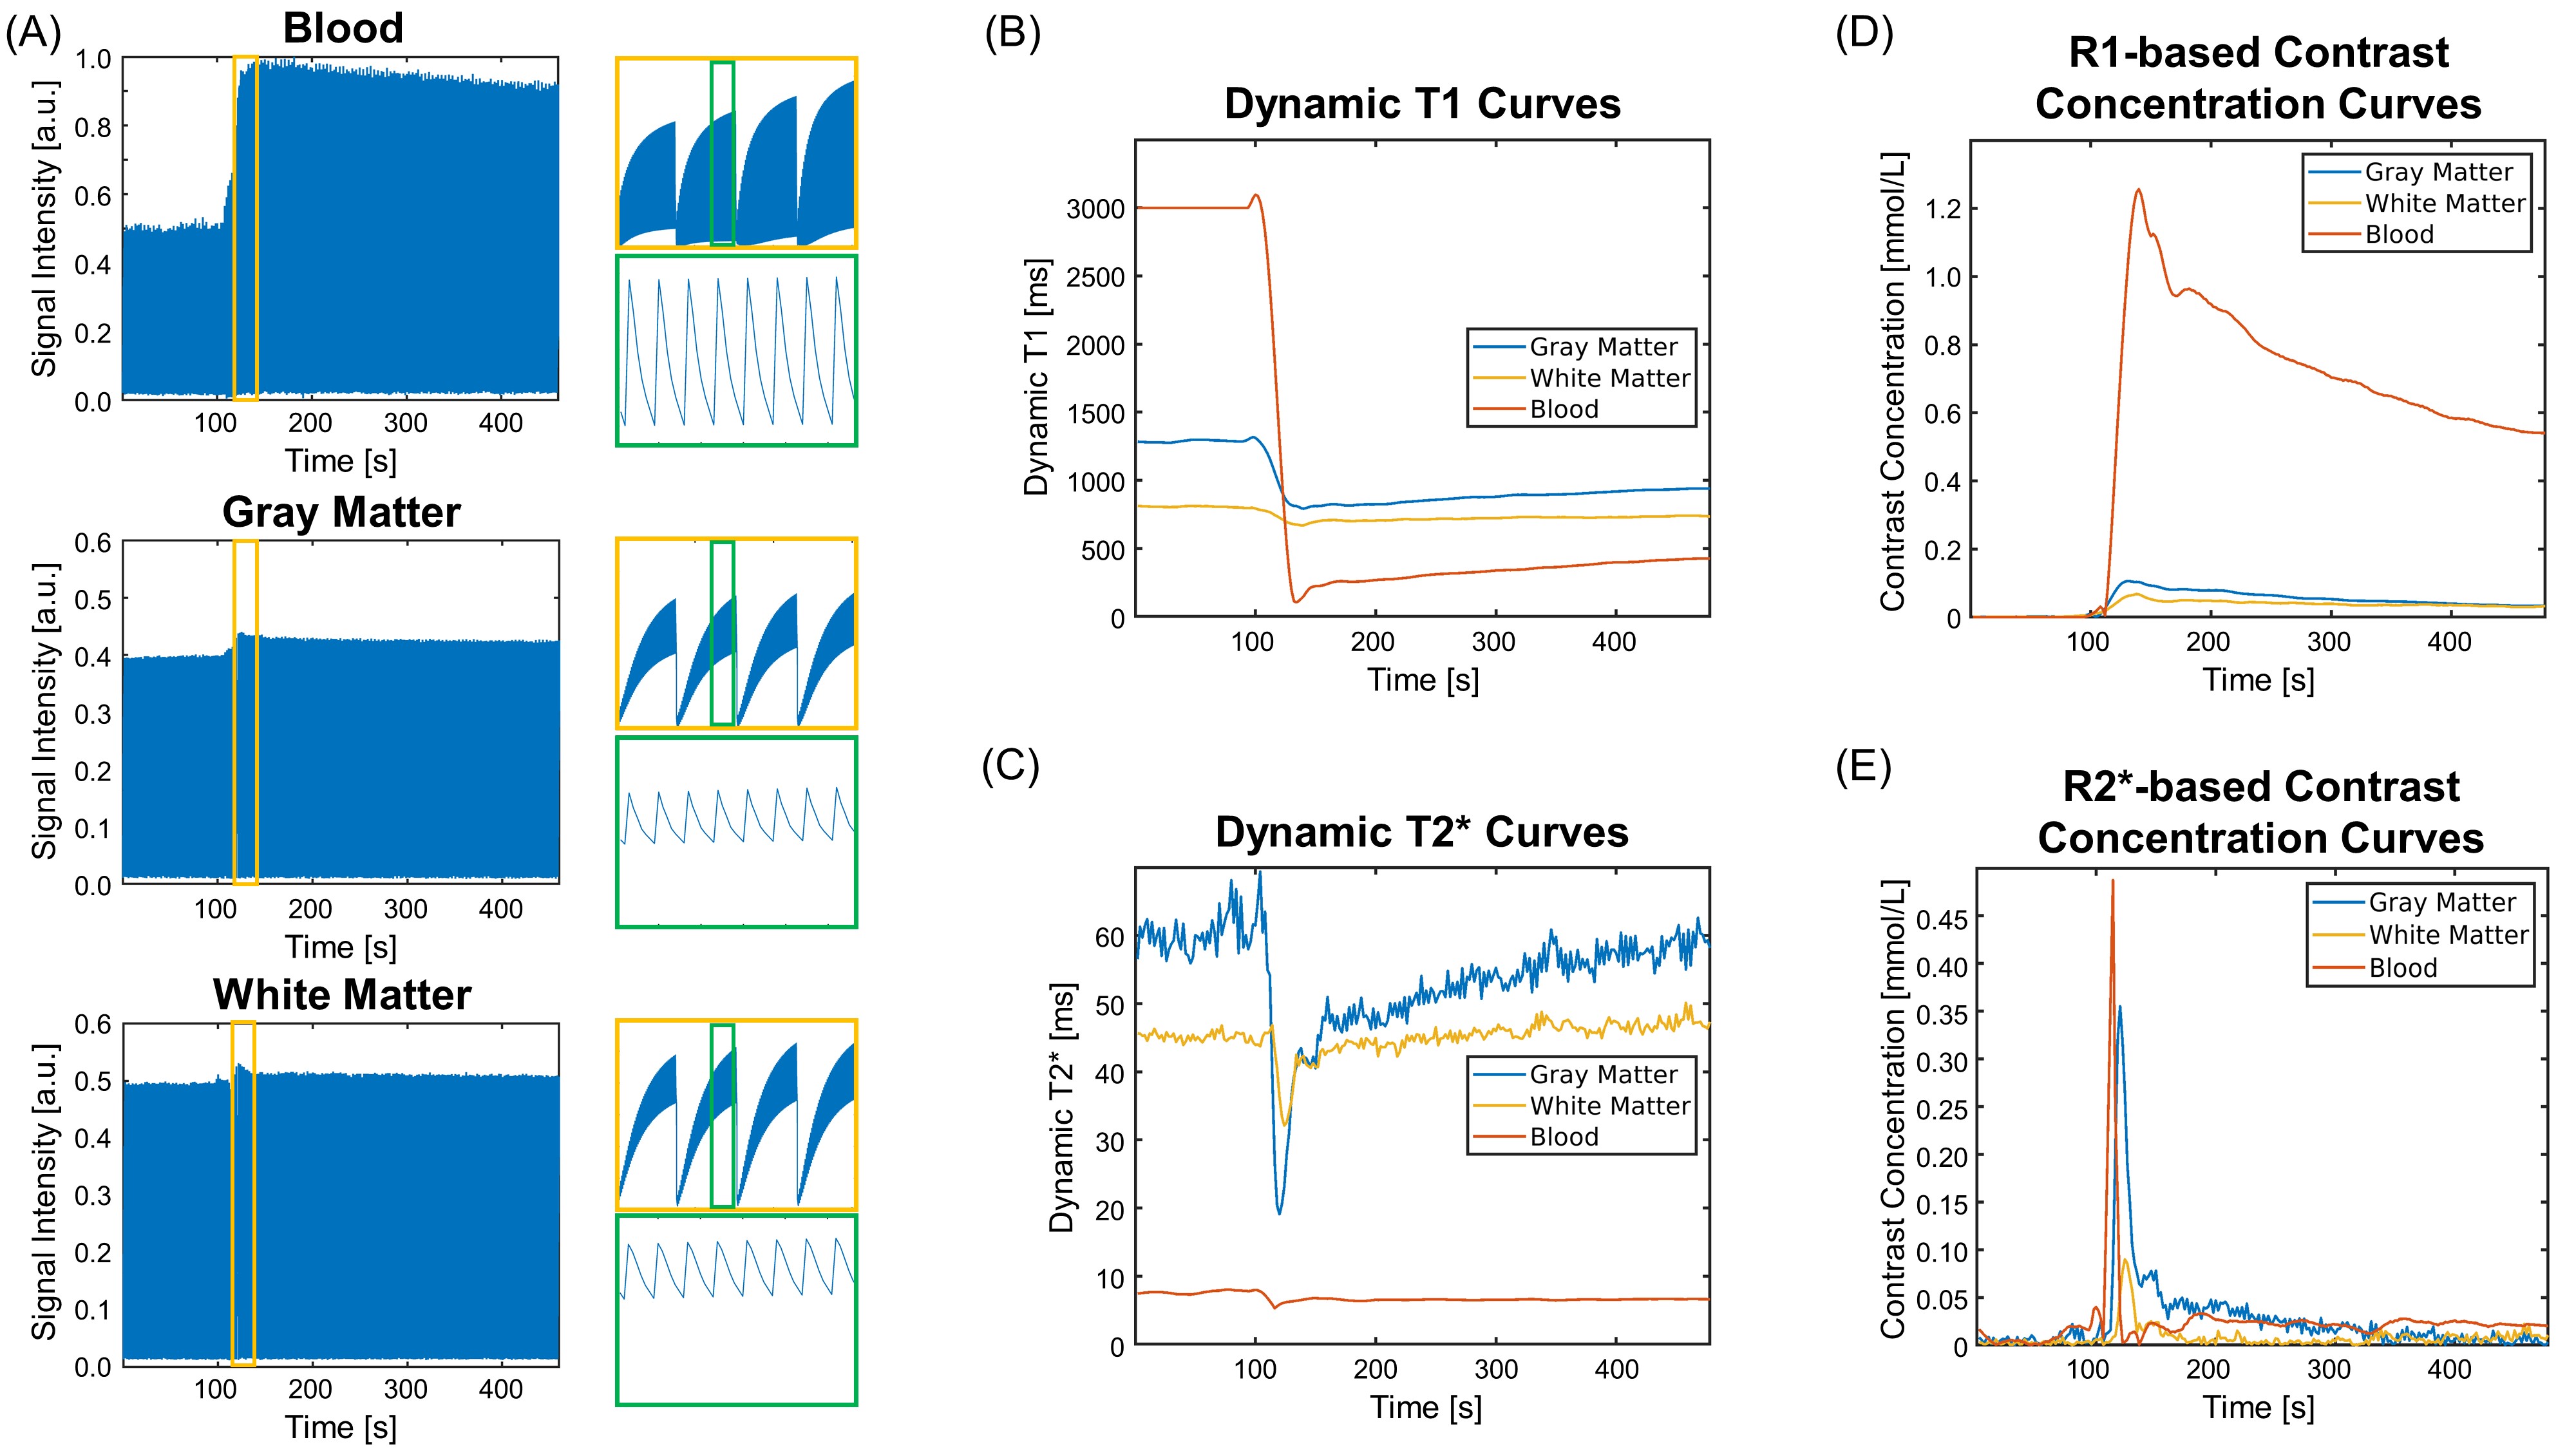
Multiparametric Analysis: Dynamic T1/T2* are fitted according to the SR-FLASH signal equation:
$$S(A,\alpha ,B,n,TE,T1(t),T2^{*}(t))=A\frac{1-e^{-TR/T1(t)}}{1-e^{-TR/T1(t)}\cos\alpha}[1+(B-1)(e^{-TR/T1(t)}\cos \alpha )^{n}]e^{-TE/T2^{*}(t)}\sin \alpha $$
with amplitude $$$A$$$, flip angle $$$\alpha$$$, saturation factor $$$B$$$, readout index $$$n$$$, and echo time $$$TE$$$. The R1-/R2*-based CA concentration curves are subsequently calculated from the dynamic T1/T2*16,17. DCE-MRI metrics are derived from the R1-based concentration using the extended Tofts model18. The derived permeability parameters are further adopted to perform leakage correction for DSC-MRI metrics based on a combined biophysical and pharmacokinetic method6. The non-leakage-corrected DSC-MRI counterparts are derived in the conventional way19.
In vivo Study: Eight healthy subjects were recruited, 3 of whom returned for a second scan for reproducibility assessment. Four patients with known brain tumors were also imaged. All MT-DICE datasets were collected on a 3T system (Vida, Siemens) with the following imaging parameters: FOV=220×220×128mm3, spatial resolution=1.5×1.5×4.0mm3, TR=19.30ms, TEs=2.46/4.92/7.38/9.84/12.30/17.22ms, SR period=temporal resolution=1s, FA=10°, total time=7.6min. Gadavist (0.1mmol/kg) was administered 1.5min into the scan at the rate of 2.0mL/s. Pre-contrast reference scans in healthy subjects including inversion-recovery TSE for T1 and multi-echo GRE for T2* quantification were also acquired.
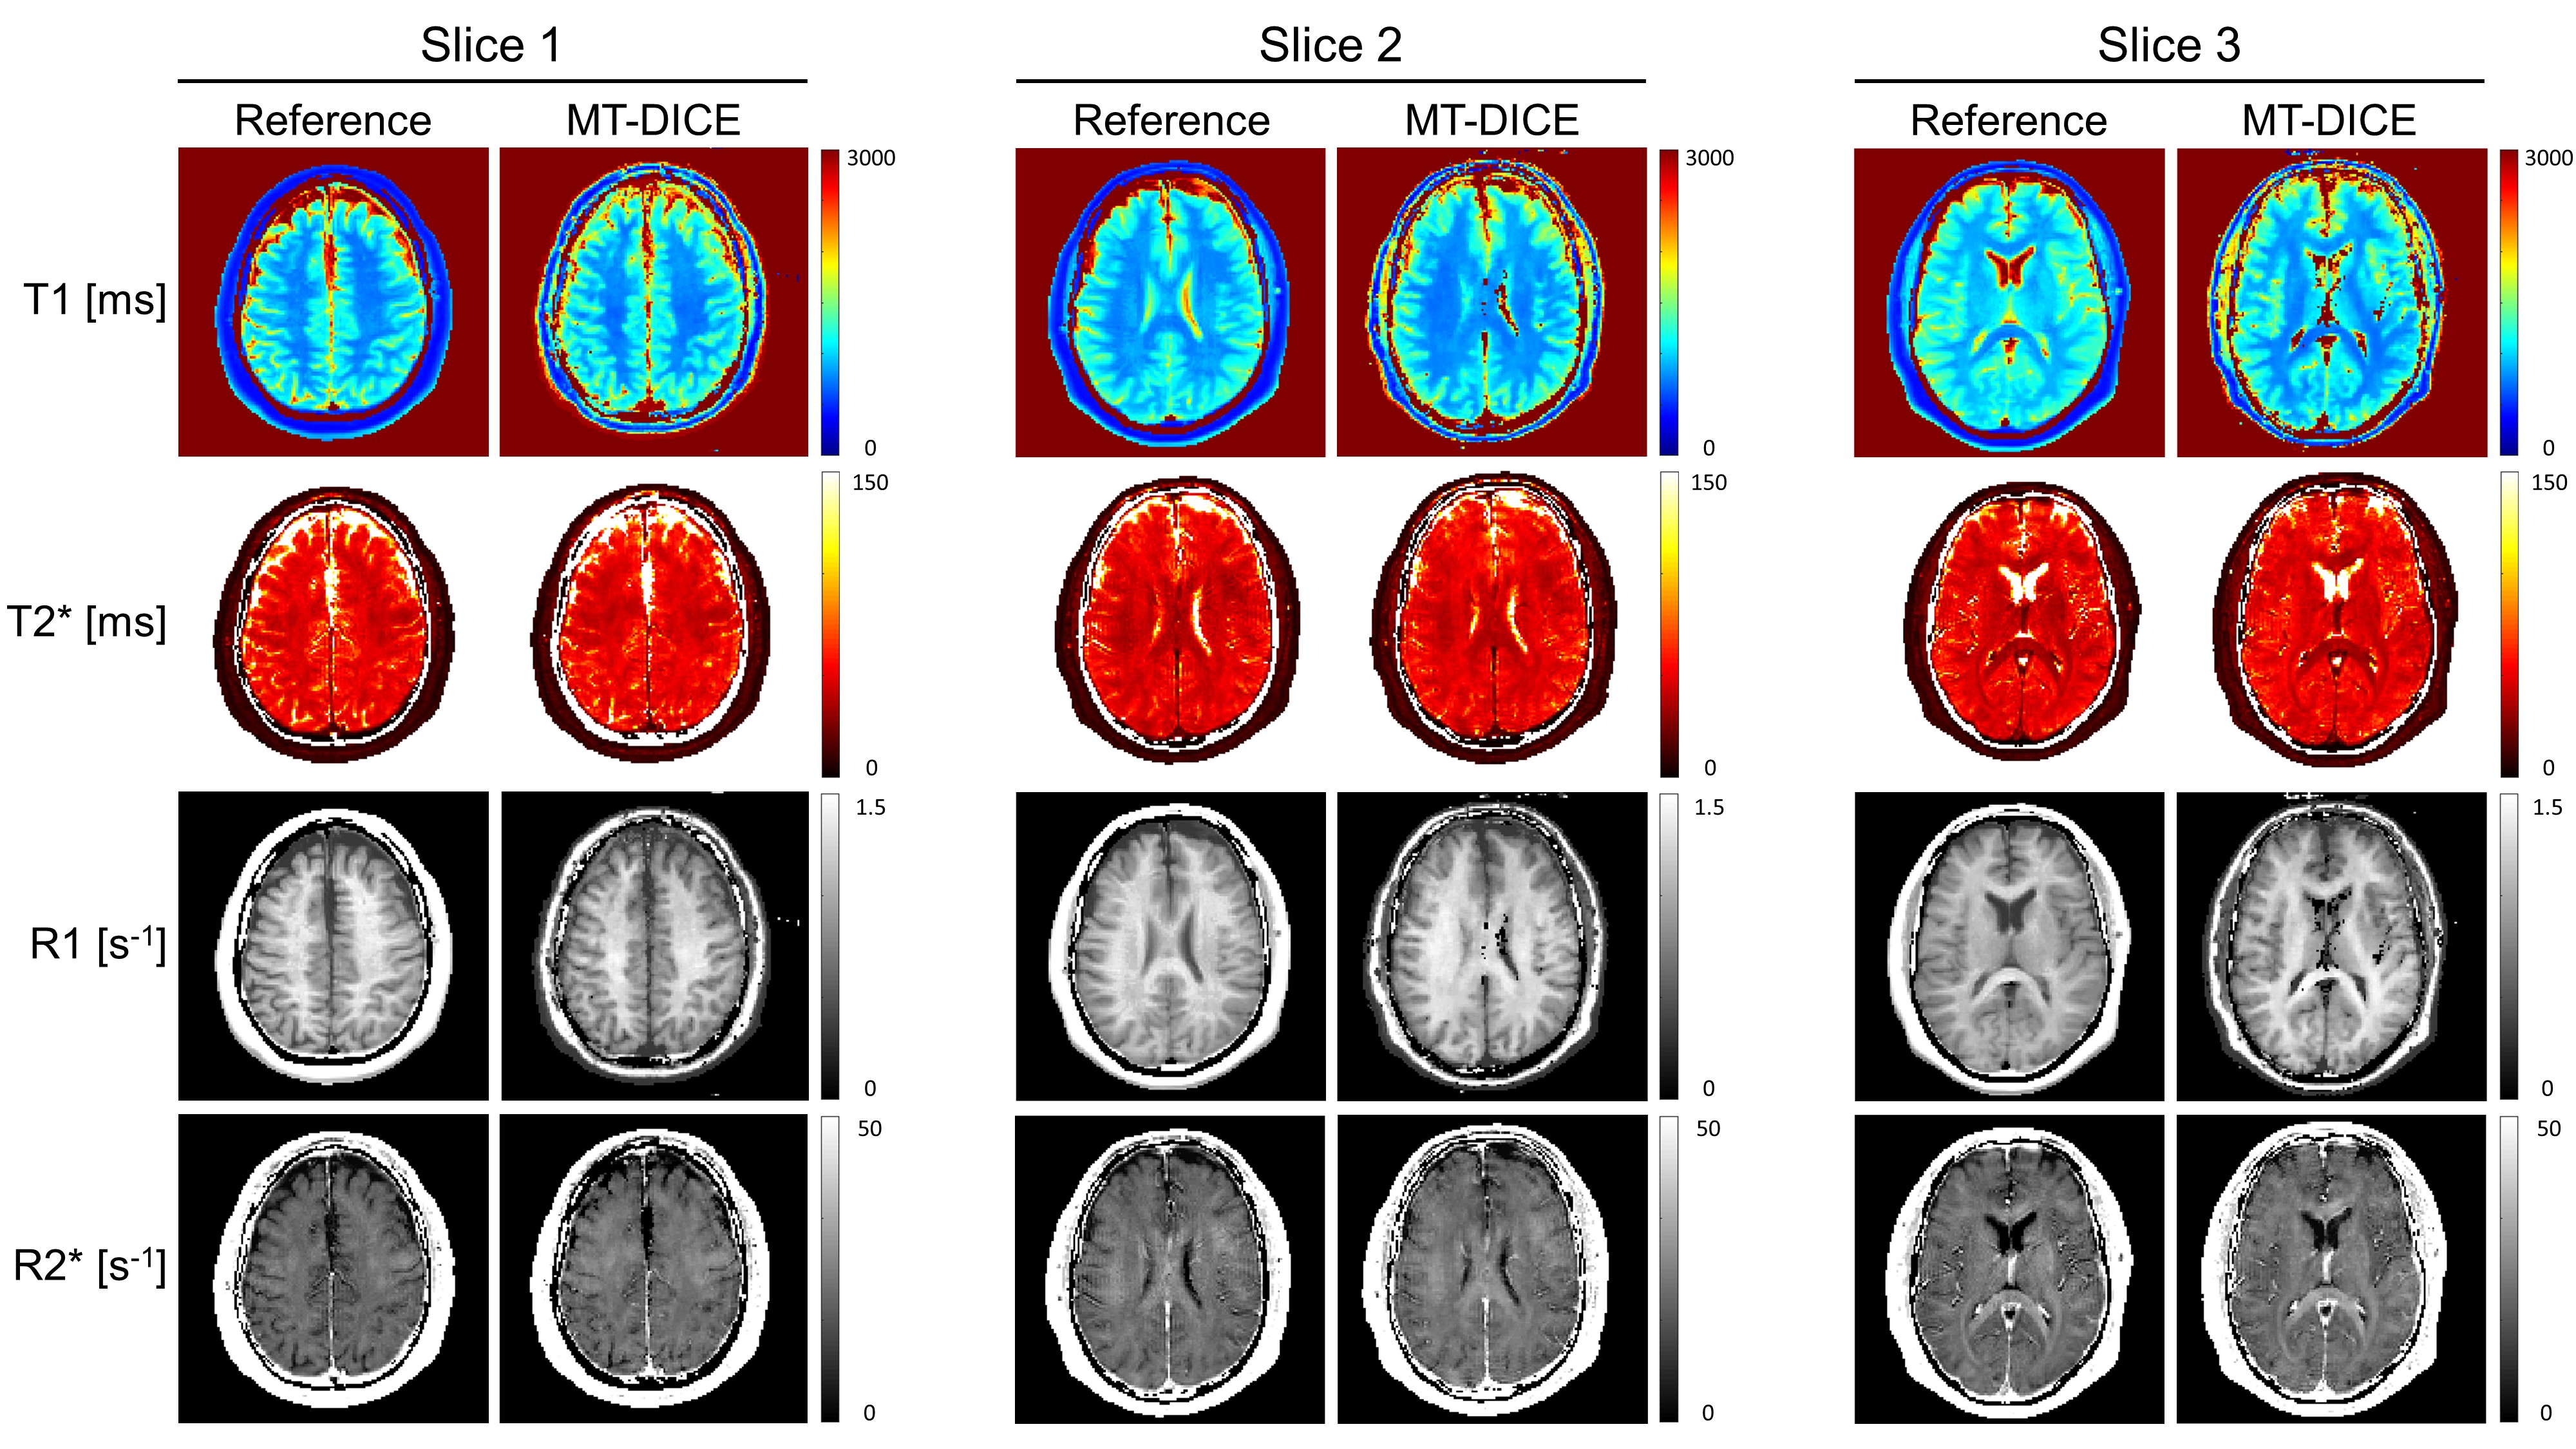
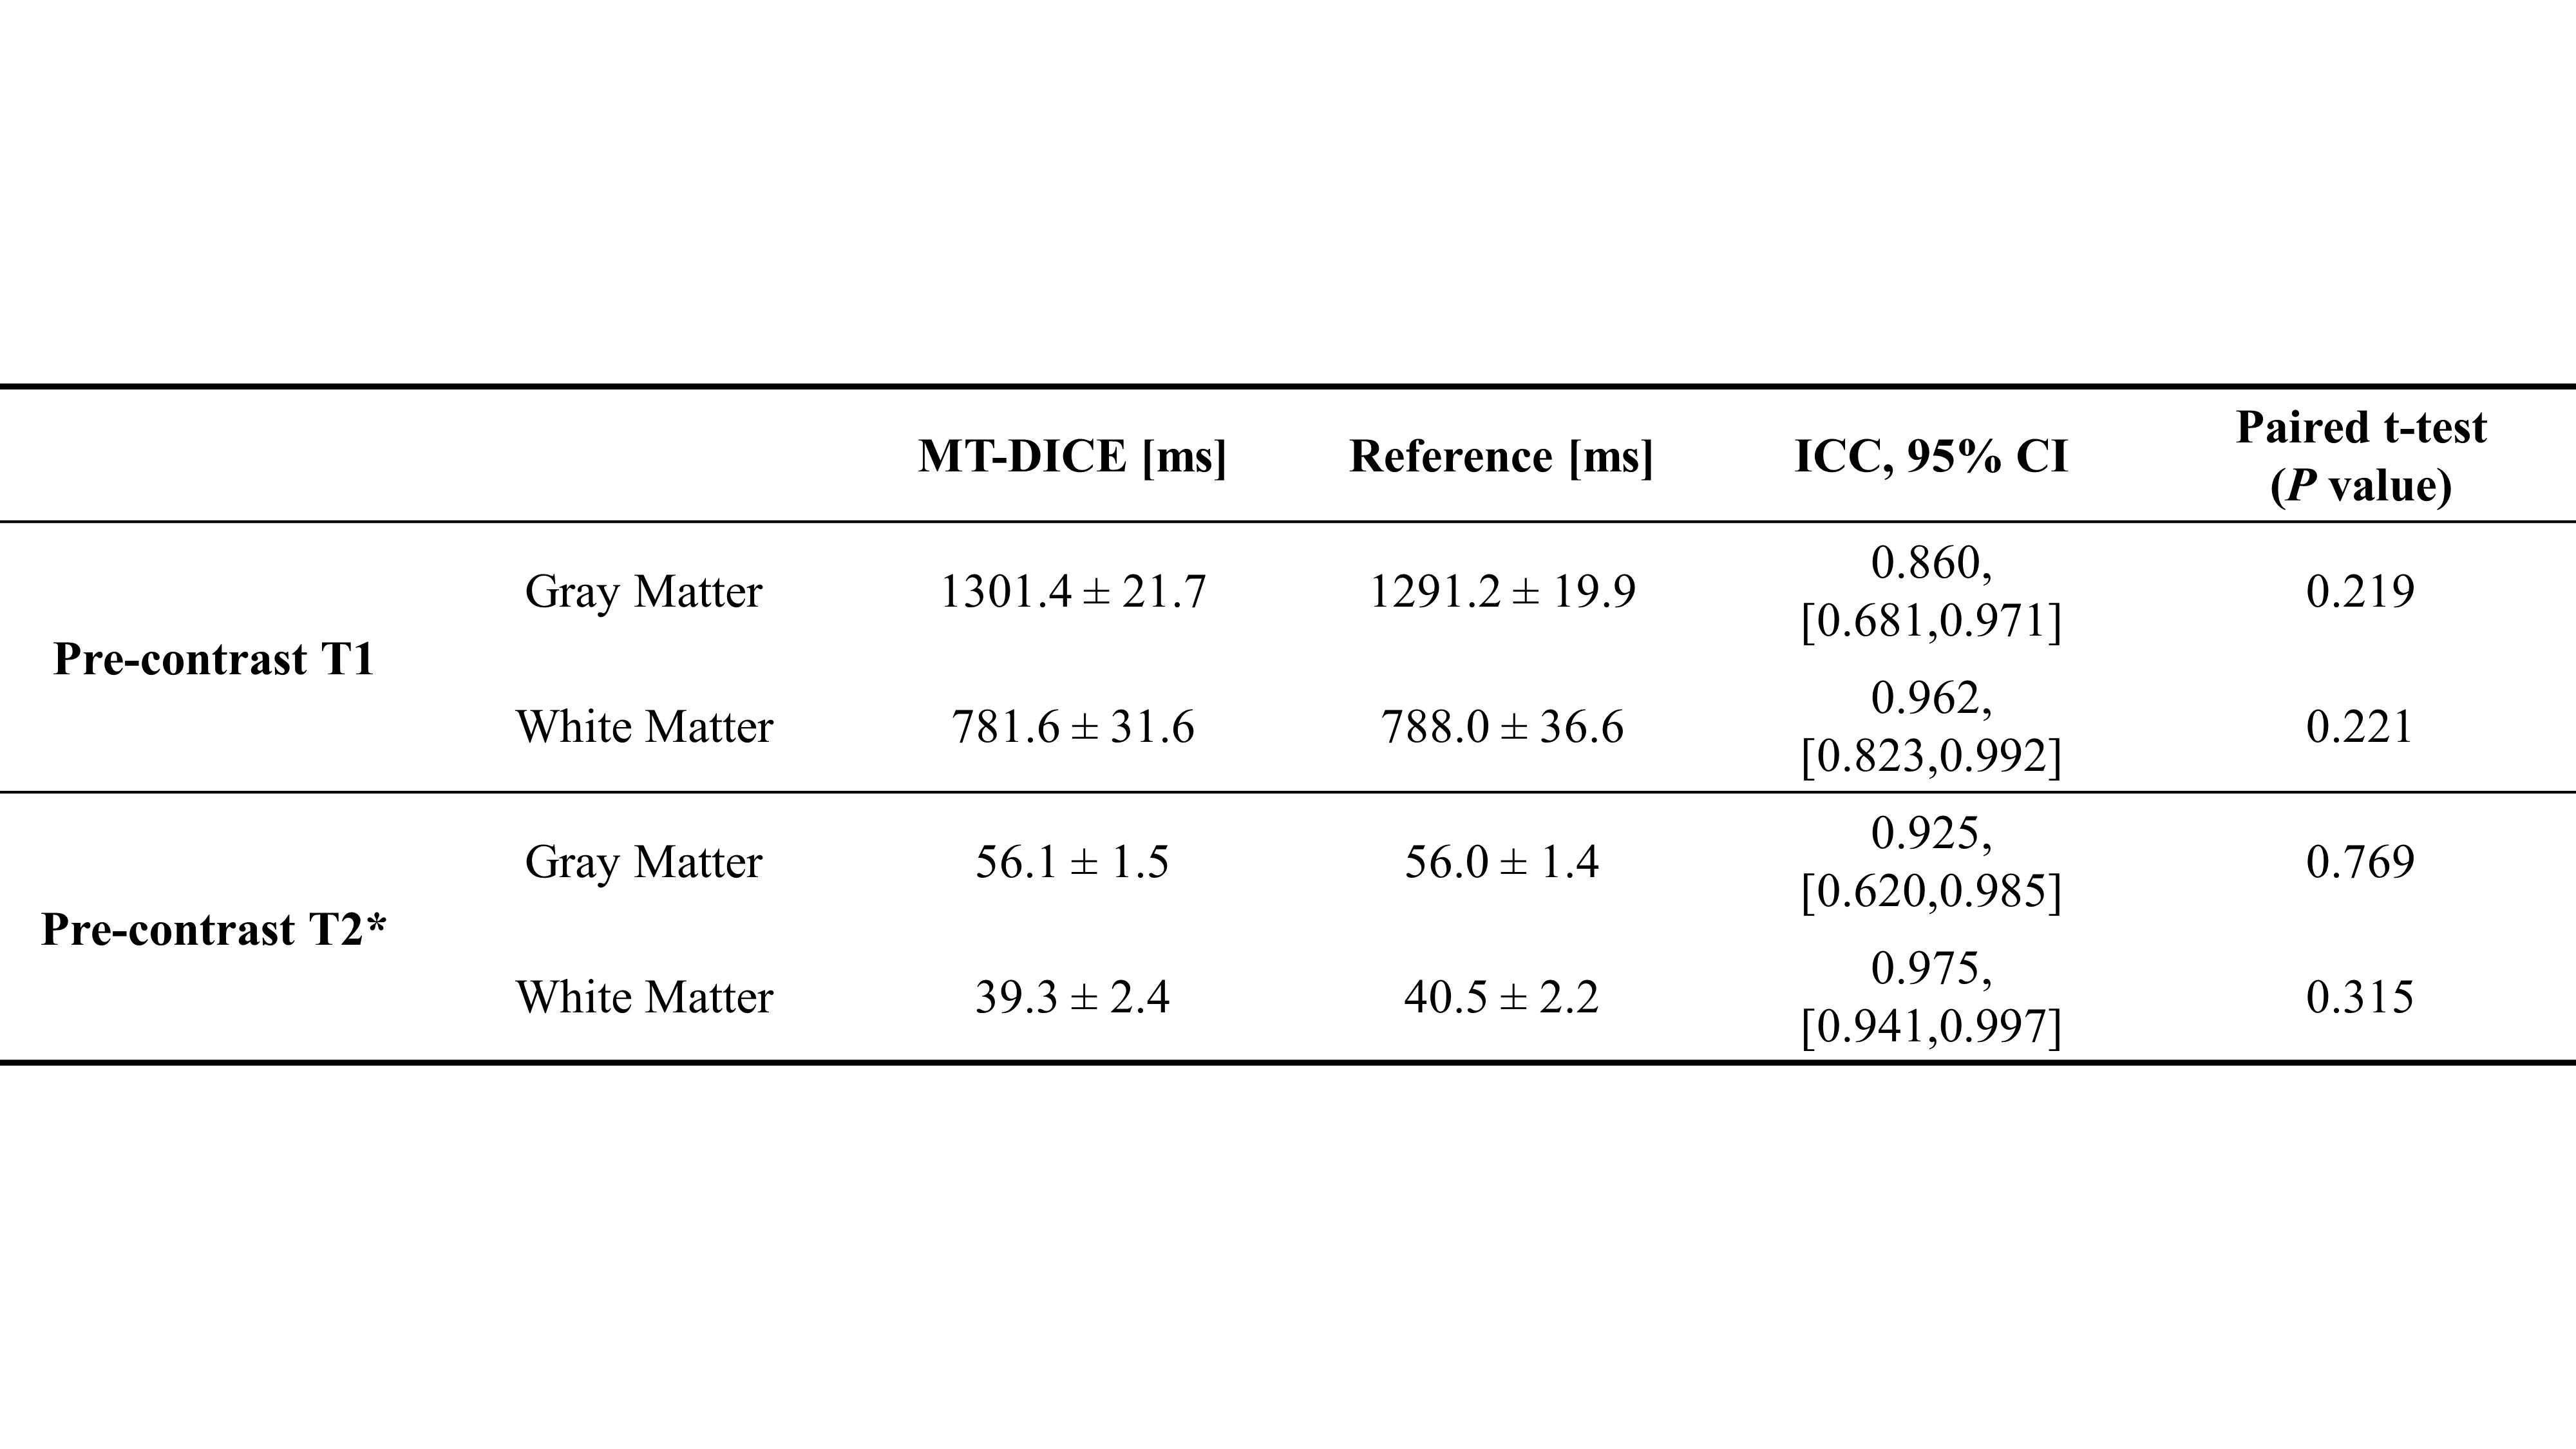
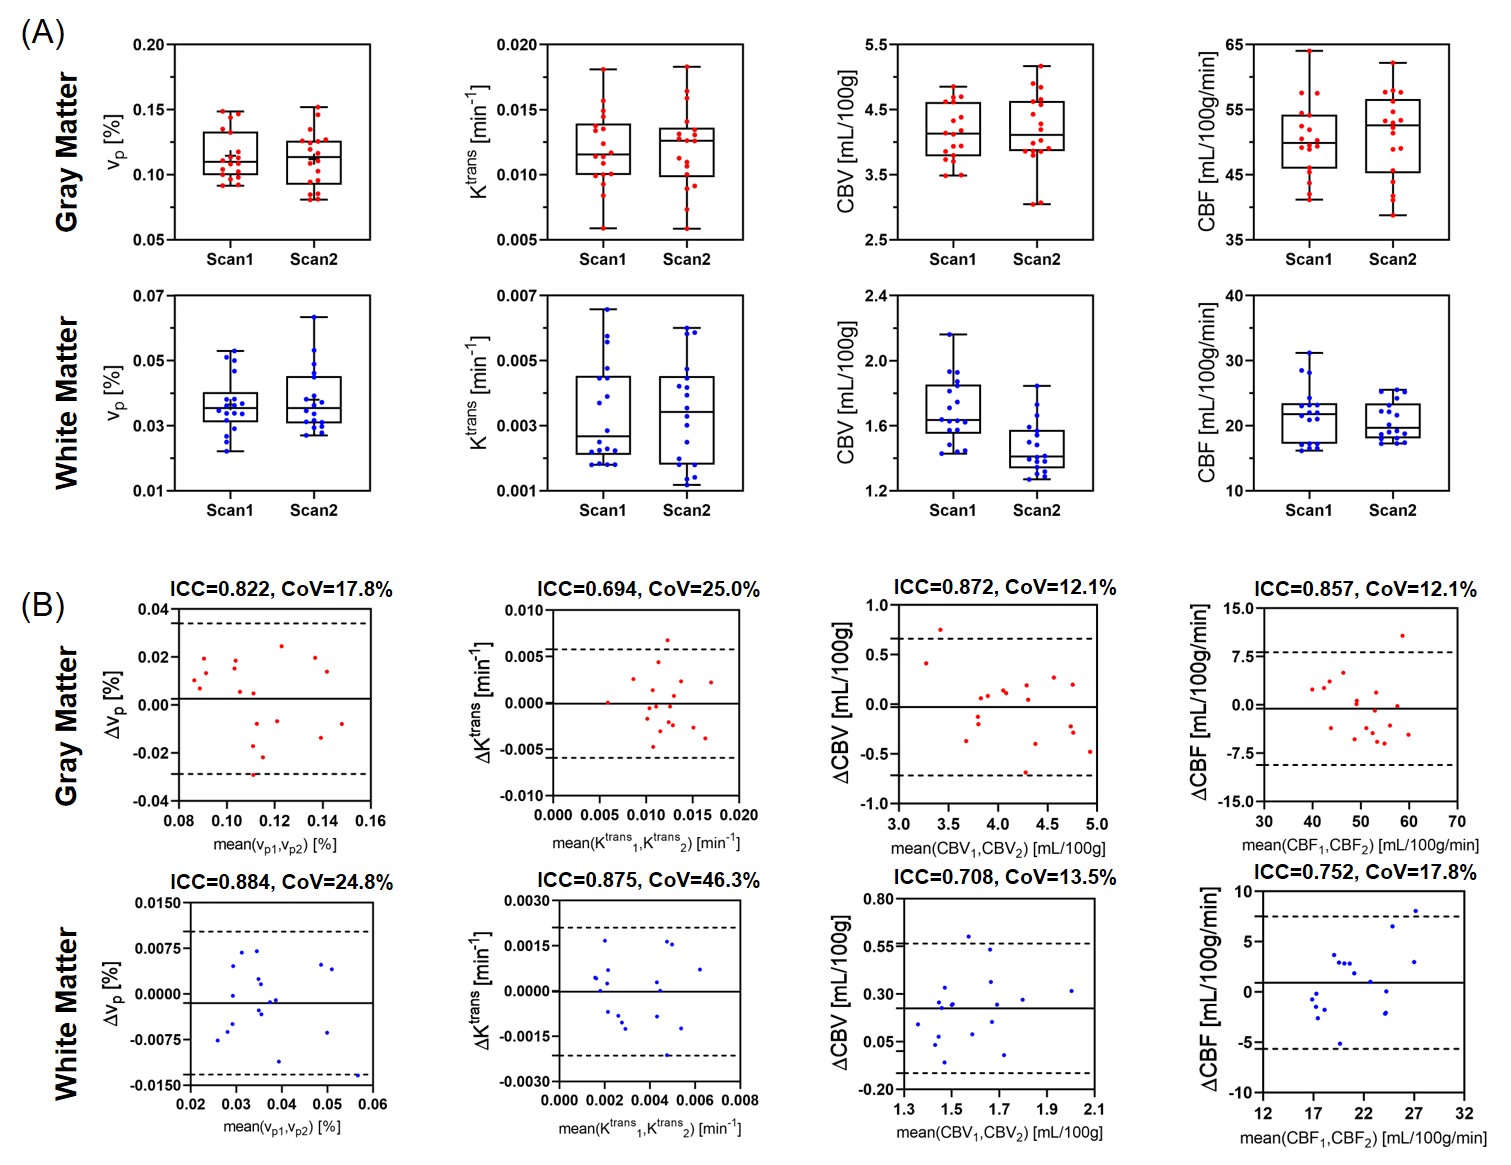
Image Analysis: The quantitative agreement of T1/T2* measurements between MT-DICE and references were evaluated with intra-class correlation coefficients (ICC) and paired t-tests. The intersession reproducibility of the kinetic parameters (vp, Ktrans, CBV, CBF) was assessed from 12 ROIs (6 each for gray matter [GM] and white matter [WM]).
Results
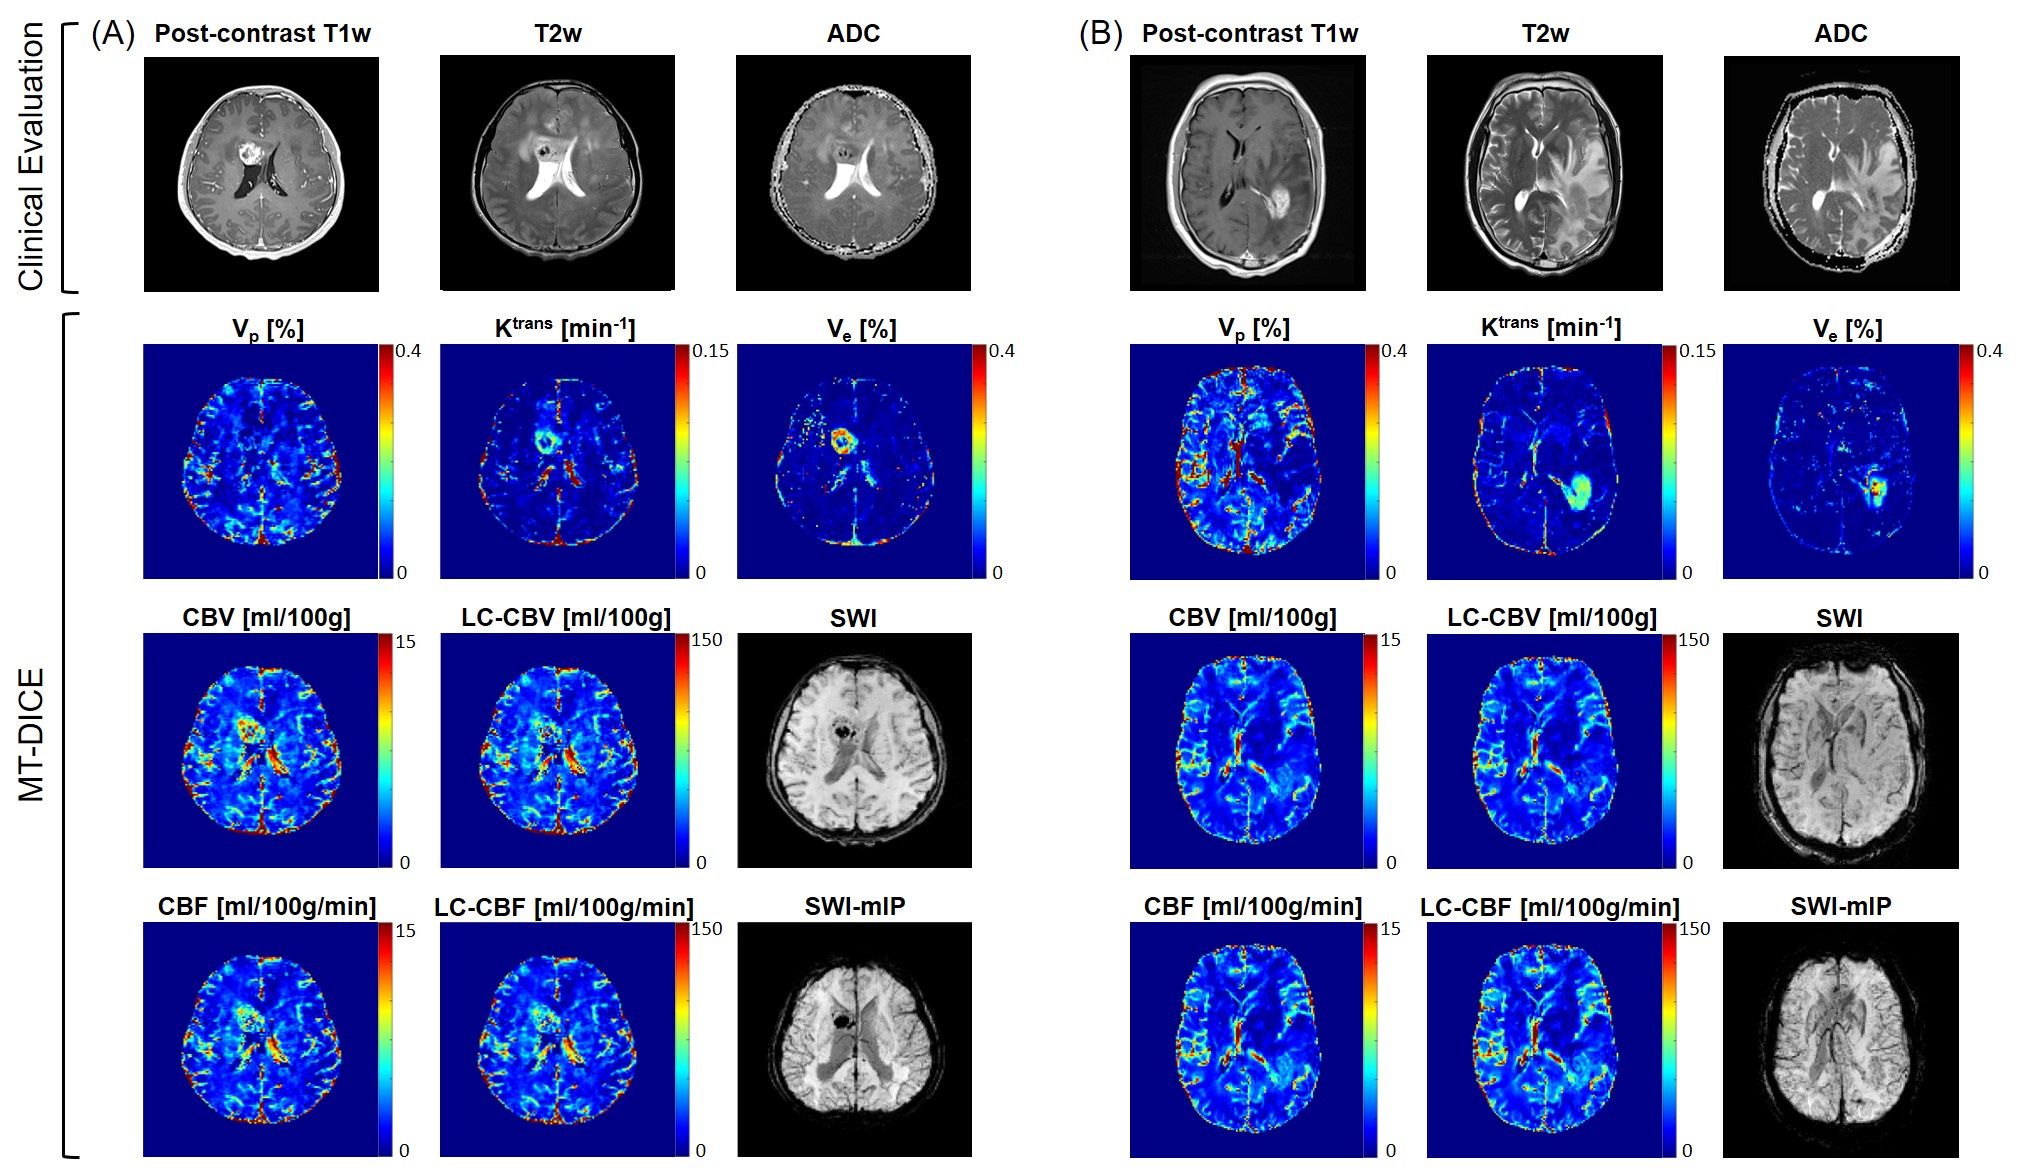
Figure 1 shows the signal intensity, dynamic T1/T2*, and R1-/R2*-based CA concentration curves for blood, GM and WM generated by MT-DICE. T1/T2*/R1/R2* maps provided by MT-DICE showed consistency with corresponding reference maps (Figure 2). The results for pre-contrast T1/T2* measurements are listed in Table 1. MT-DICE T1/T2* values of GM/WM showed excellent quantitative agreement with reference values with all ICC≥0.85. Reproducibility assessments of the 4 kinetic parameters from the proposed MT-DICE are displayed in Figure 3. Good intersession agreement and low variability were observed, with the lowest ICC at 0.694 and the highest correlation of variation at 46.3%. All values were within the literature range20,21. Figure 4 shows the permeability, non-leakage-corrected and leakage-corrected perfusion parameters from two representative brain tumor patients. In addition to the kinetic maps, susceptibility-weighted images (SWI) were also available with MT-DICE.Discussion
With a single-dose of CA, MT-DICE leverages the advantages of both DSC-MRI and DCE-MRI to provide comprehensive information about tumors. The complimentary perfusion and permeability information provides a more complete evaluation for the complex and heterogeneous tumor microenvironment22. Compared to previous combined approaches3,4,6,14, MT-DICE quantifies the CA concentration based on dynamic T1/T2*, as opposed to linearly approximating concentration from signal intensity, which is expected to improve the quantification accuracy. Moreover, MT-DICE achieves dynamic imaging with 1-second temporal resolution without compromise in spatial resolution. As a byproduct, SWI adds the ability to detect intracerebral hemorrhage, which makes the proposed technique more comprehensive for cerebrovascular evaluation.Conclusion
MT-DICE allows for simultaneous permeability and leakage-corrected perfusion quantification with a single-dose of CA. Feasibility was demonstrated in healthy subjects and brain tumor patients. Further clinical validation is underway.Acknowledgements
No acknowledgement found.References
1. Essig M, Nguyen TB, Shiroishi MS, Saake M, Provenzale JM, Enterline DS, Anzalone N, Dörfler A, Rovira À, Wintermark M. Perfusion MRI: the five most frequently asked clinical questions. American Journal of Roentgenology 2013;201(3):W495-W510.
2. Bergamino M, Bonzano L, Levrero F, Mancardi G, Roccatagliata L. A review of technical aspects of T1-weighted dynamic contrast-enhanced magnetic resonance imaging (DCE-MRI) in human brain tumors. Physica Medica 2014;30(6):635-643.
3. Weisskoff R, Boxerman J, Sorensen A, Kulke S, Campbell T, Rosen B. Simultaneous blood volume and permeability mapping using a single Gd-based contrast injection. 1994. p 6-12.
4. Paulson ES, Prah DE, Schmainda KM. Spiral Perfusion Imaging with Consecutive Echoes (SPICE™) for the simultaneous mapping of DSC-and DCE-MRI parameters in brain tumor patients: theory and initial feasibility. Tomography 2016;2(4):295.
5. Quarles CC, Gore JC, Xu L, Yankeelov TE. Comparison of dual-echo DSC-MRI-and DCE-MRI-derived contrast agent kinetic parameters. Magnetic resonance imaging 2012;30(7):944-953.
6. Schmiedeskamp H, Andre JB, Straka M, Christen T, Nagpal S, Recht L, Thomas RP, Zaharchuk G, Bammer R. Simultaneous perfusion and permeability measurements using combined spin-and gradient-echo MRI. Journal of Cerebral Blood Flow & Metabolism 2013;33(5):732-743.
7. Stokes AM, Semmineh N, Quarles CC. Validation of a T1 and leakage correction method based on multiecho dynamic susceptibility contrast MRI using MION as a reference standard. Magnetic resonance in medicine 2016;76(2):613-625.
8. Bjornerud A, Sorensen AG, Mouridsen K, Emblem KE. T1-and T2*-dominant extravasation correction in DSC-MRI: Part I—theoretical considerations and implications for assessment of tumor hemodynamic properties. Journal of Cerebral Blood Flow & Metabolism 2011;31(10):2041-2053.
9. Boxerman J, Schmainda K, Weisskoff R. Relative cerebral blood volume maps corrected for contrast agent extravasation significantly correlate with glioma tumor grade, whereas uncorrected maps do not. American Journal of Neuroradiology 2006;27(4):859-867.
10. Leu K, Boxerman JL, Cloughesy TF, Lai A, Nghiemphu PL, Liau LM, Pope WB, Ellingson BM. Improved leakage correction for single-echo dynamic susceptibility contrast perfusion MRI estimates of relative cerebral blood volume in high-grade gliomas by accounting for bidirectional contrast agent exchange. American Journal of Neuroradiology 2016;37(8):1440-1446.
11. Paulson ES, Schmainda KM. Comparison of dynamic susceptibility-weighted contrast-enhanced MR methods: recommendations for measuring relative cerebral blood volume in brain tumors. Radiology 2008;249(2):601-613.
12. Quarles C, Gochberg D, Gore J, Yankeelov T. A theoretical framework to model DSC-MRI data acquired in the presence of contrast agent extravasation. Physics in Medicine & Biology 2009;54(19):5749.
13. Heye AK, Thrippleton MJ, Armitage PA, Hernández MdCV, Makin SD, Glatz A, Sakka E, Wardlaw JM. Tracer kinetic modelling for DCE-MRI quantification of subtle blood–brain barrier permeability. Neuroimage 2016;125:446-455.
14. Wu J, Saindane AM, Zhong X, Qiu D. Simultaneous perfusion and permeability assessments using multiband multi‐echo EPI (M2‐EPI) in brain tumors. Magnetic Resonance in Medicine 2019;81(3):1755-1768.
15. Christodoulou AG, Shaw JL, Nguyen C, Yang Q, Xie Y, Wang N, Li D. Magnetic resonance multitasking for motion-resolved quantitative cardiovascular imaging. Nature biomedical engineering 2018;2(4):215-226.
16. Wang N, Christodoulou AG, Xie Y, Wang Z, Deng Z, Zhou B, Lee S, Fan Z, Chang H, Yu W. Quantitative 3D dynamic contrast‐enhanced (DCE) MR imaging of carotid vessel wall by fast T1 mapping using Multitasking. Magnetic resonance in medicine 2019;81(4):2302-2314.
17. Straka M, Albers GW, Bammer R. Real‐time diffusion‐perfusion mismatch analysis in acute stroke. Journal of Magnetic Resonance Imaging 2010;32(5):1024-1037.
18. Tofts PS, Brix G, Buckley DL, Evelhoch JL, Henderson E, Knopp MV, Larsson HB, Lee TY, Mayr NA, Parker GJ. Estimating kinetic parameters from dynamic contrast‐enhanced T1‐weighted MRI of a diffusable tracer: standardized quantities and symbols. Journal of Magnetic Resonance Imaging: An Official Journal of the International Society for Magnetic Resonance in Medicine 1999;10(3):223-232.
19. Wu O, Østergaard L, Weisskoff RM, Benner T, Rosen BR, Sorensen AG. Tracer arrival timing‐insensitive technique for estimating flow in MR perfusion‐weighted imaging using singular value decomposition with a block‐circulant deconvolution matrix. Magnetic Resonance in Medicine: An Official Journal of the International Society for Magnetic Resonance in Medicine 2003;50(1):164-174.
20. Zhang N, Zhang L, Qiu B, Meng L, Wang X, Hou BL. Correlation of volume transfer coefficient Ktrans with histopathologic grades of gliomas. Journal of Magnetic Resonance Imaging 2012;36(2):355-363.
21. Bjørnerud A, Emblem KE. A fully automated method for quantitative cerebral hemodynamic analysis using DSC–MRI. Journal of Cerebral Blood Flow & Metabolism 2010;30(5):1066-1078.
22. Stokes AM. DCE/DSC with Multiple Echoes: Blurring the Boundaries.
Figures