0045
Evaluation of T1 and T2 from MR Fingerprinting as Markers for Predicting Patient Recovery in Mild Traumatic Brain Injury1Center for Biomedical Imaging, Department of Radiology, New York University Grossman School of Medicine, NEW YORK, NY, United States, 2Centre for Advanced Imaging, The University of Queensland, Brisbane, Australia, 3Department of Rehabilitation Medicine, New York University Grossman School of Medicine, NEW YORK, NY, United States, 4Department of Psychiatry, New York University Grossman School of Medicine, NEW YORK, NY, United States, 5Ronald O. Perelman Department of Emergency Medicine, New York University Grossman School of Medicine, NEW YORK, NY, United States
Synopsis
We analyzed brain MRI data including clinical imaging and MR fingerprinting (MRF) of 22 mild traumatic brain injury (mTBI) patients measured ~1 month after injury and 18 healthy controls. T1 and T2 values in mTBI were not significantly different from controls’. However, increased T1 of three brain regions enabled the identification of non-recovered patients at 3-months (AUC=0.80-0.88). This suggests that T1 quantification is more sensitive to mTBI damage than T2, and is a potential candidate to predict patient outcome.
Introduction
Traumatic brain injury (TBI) is one of the main causes of neurological disabilities worldwide.1 Despite its low severity, individuals with mild TBI (mTBI) often present physical, psychiatric, emotional and cognitive disorders.2 However, reliable quantitative MRI biomarkers to predict the risk of persistent symptoms in these individuals are lacking. Since T1 and T2 of water are sensitive to their local molecular environment, quantitative T1 and T2 assessment could capture pathological changes following TBI. In animal models of TBI, an increase in T2 has been linked to vasogenic edema and correlated with histologically-quantified neurodegeneration and neurological outcome.3–5 We therefore assessed the prognostic performance of T1 and T2 measured with MR fingerprinting (MRF) in gray matter (GM) and white matter (WM) for symptomatic and cognitive outcome after human mTBI.Materials & Methods
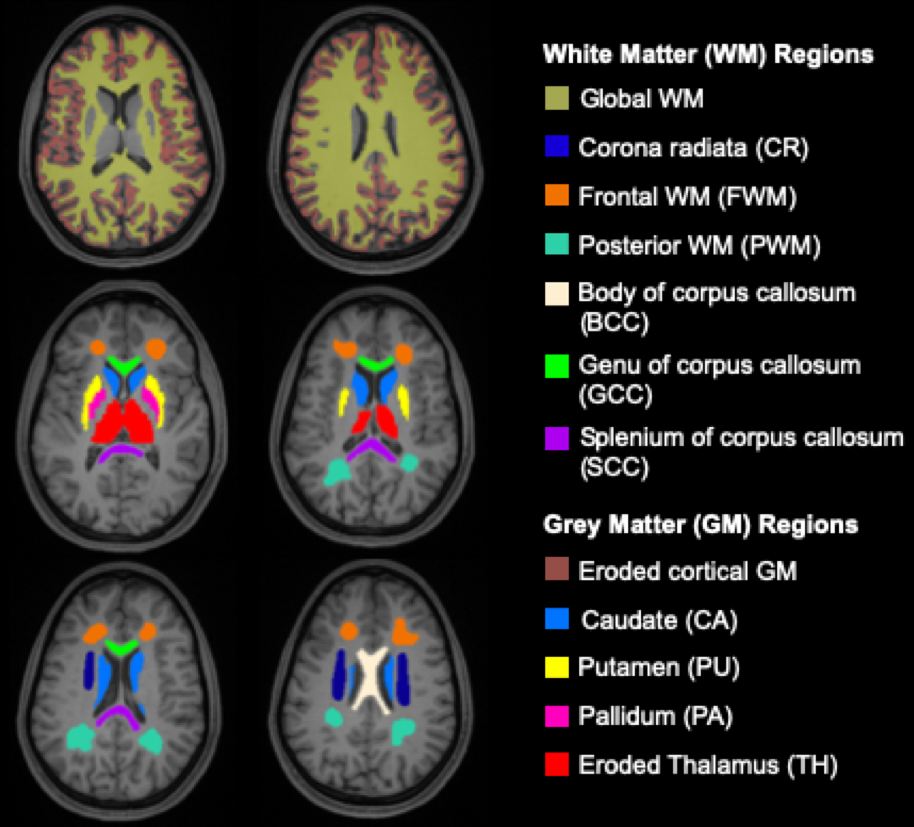
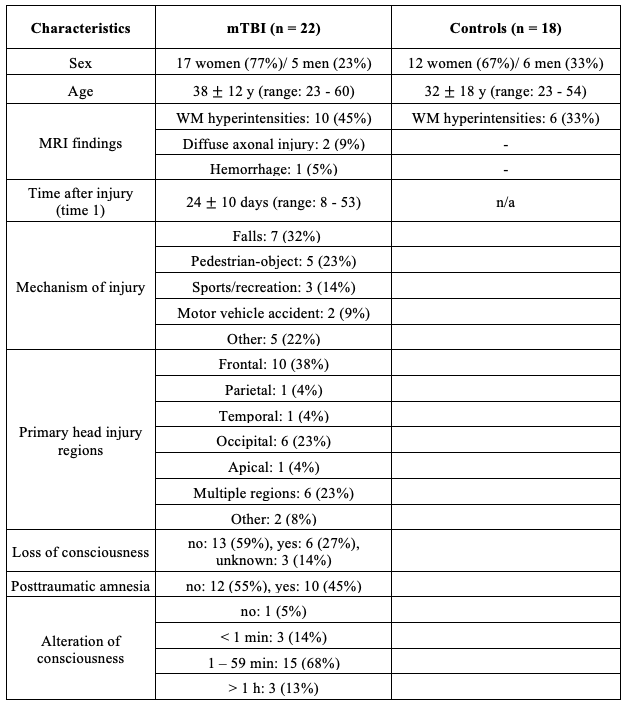
We analyzed brain MRI data including clinical imaging and MRF of 22 mTBI patients (17 female, 38±12 years) within two months after injury (time 1, 22.1±10.2 days) and 18 healthy controls (12 female, 31.6±7.6 years). MRI data were acquired on a 3T scanner (Magnetom Prisma, Siemens Healthineers) with a 20-channel quadrature head coil (Siemens Healthineers). Standard imaging included 3D MPRAGE (TR/TE/TI=2400/2.24/1060 ms; flip angle=8°; in-plane FOV=256×256 mm2; 208 slices, slab thickness=0.8 mm; voxel size=0.8×0.8×0.8 mm³; TA=6:38 min), FLAIR (TR/TE/TI=9000/81/2500 ms; 30 slices, in-plane FOV=220×220 mm2; voxel size=0.7×0.7×5.0 mm³; TA=2:44 min) and SWI (TR/TE=28/20 ms; flip angle=15°; in-plane FOV=220×220 mm2; voxel size=0.7×0.7×3.0 mm³; TA=3:46 min). A radiologist examined qualitative 1H images for areas with possible hematoma, haemorrhage, diffuse or traumatic axonal injury, which were excluded for T1 and T2 quantification. For multiparametric mapping, we applied a multi-slice 2D radial MRF method to simultaneously measure T1 and T2, which is described in detail in reference6 (resolution=1.25×1.25×5 mm3, TA=7:49 min). A dictionary with simulated fingerprints was created using extended phase graphs with T1 and T2 entries in the ranges 150-4642 ms and 10-350 ms, respectively (step size of 2.5%). The MRF data was reconstructed offline with an in-house MATLAB script. Visual quality control ensured that only artifact-free slices were included in the analysis.7 Twelve ROI masks were extracted from the MPRAGE image and used to obtain ROI voxel-averaged values of T1, T2, FA, and ADC (Fig. 1). All TBI patients also underwent clinical and neurocognitive testing at baseline (time 1) and at a three-month follow-up (time 2), including the Rivermead post-concussion symptoms questionnaire (RPQ)8, the Glasgow Outcome Scale – Extended (GOSE)9, and the Brief Test of Adult Cognition by Telephone (BTACT).10 Data from mTBI versus controls were compared using Mann-Whitney (MW) test omitting the three oldest non-age-matched patients, since the association between age and T1 and T2 is unknown. Comparisons with all patients were made with respect to MRI and clinical recovery (GOSE=8 is recovered and GOSE<8 is non-recovered), with (ANCOVA) and without (MW) an adjustment for the elapsed time from injury, respectively. Spearman rank correlation was used to assess the association between TSC and BTACT and RPQ. Statistical significance was defined as p<0.05.Results
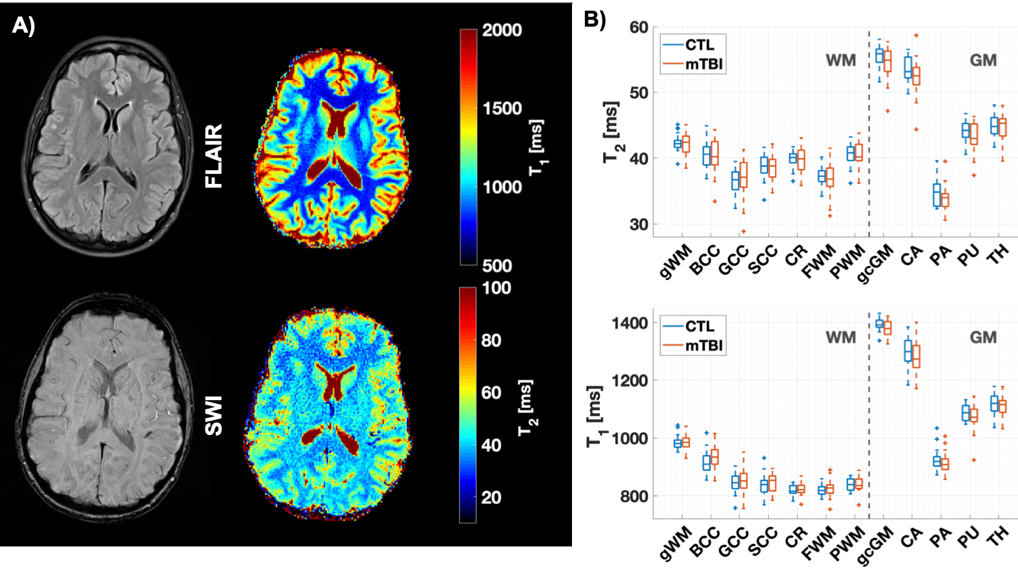
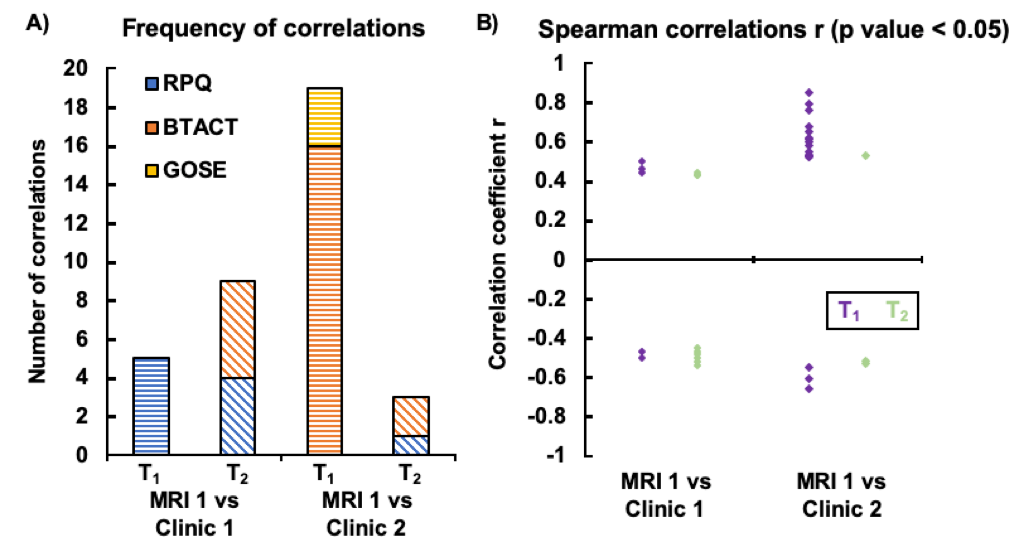
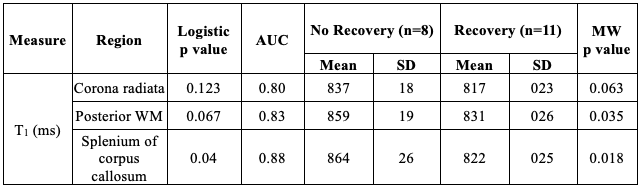
The demographics and injury characteristics of the TBI and control cohort are compiled in Table 1. Fig. 2A shows T1 and T2 maps next to qualitative 1H images from one TBI patient. GM exhibited generally higher T1 and T2 values than WM regions, producing high gray-white matter contrast. In a cross-sectional analysis, no statistically significant difference in T1 and T2 was observed between mTBI patients and controls (Fig. 2B). Several correlations were found between MRI measures and clinical presentations (Fig. 3). The strongest association of T1 at time 1 with clinical outcome at time 2 was observed for the T1 in corona radiata and the word list recall from the BTACT (r=0.85 with p<0.001), followed by the T1 in genu of corpus callosum and the BTACT composite z-score (r=0.79 with p<0.001). The mTBI patients were dichotomized according to the GOSE at time 2 in recovered (n=8) or non-recovered (n=11). Statistical testing using the receiver-operating-characteristic curve showed that increased T1 of three brain regions enabled the identification of non-recovered patients at follow-up with AUCs between 0.80 and 0.88 (Table 2).Discussion & Conclusion
We evaluated for the first time, to the best of our knowledge, the potential of T1 and T2 measurements from MRF to predict patient outcome after mild TBI. T1 showed stronger predictive value, particularly in brain regions which have been identified as common sites of DTI abnormalities.11,12 In conclusion, we show that MRF-based relaxometry, especially T1, was linked to clinical and neurocognitive impairments in mTBI, and identified non-recovered patients 3 months after injury with AUC>0.80.Acknowledgements
This work was supported by grants R01NS097494 and R01EB026456 from the National Institutes of Health (NIH).References
- Dang, B., Chen, W., He, W. & Chen, G. Rehabilitation Treatment and Progress of Traumatic Brain Injury Dysfunction. Neural Plast. 2017, 1–6 (2017).
- Maas, A. I. R. et al. Traumatic brain injury: integrated approaches to improve prevention, clinical care, and research. Lancet Neurol. 16, 987–1048 (2017).
- Li, W. et al. Spatiotemporal changes in blood-brain barrier permeability, cerebral blood flow, T2 and diffusion following mild traumatic brain injury. Brain Res. 1646, 53–61 (2016).
- Immonen, R. J., Kharatishvili, I., Gröhn, H., Pitkänen, A. & Gröhn, O. H. J. Quantitative MRI predicts long-term structural and functional outcome after experimental traumatic brain injury. Neuroimage 45, 1–9 (2009).
- Kharatishvili, I., Sierra, A., Immonen, R. J., Gröhn, O. H. J. & Pitkänen, A. Quantitative T2 mapping as a potential marker for the initial assessment of the severity of damage after traumatic brain injury in rat. Exp. Neurol. 217, 154–164 (2009).
- Cloos, M. A. et al. Rapid Radial T1 and T2 Mapping of the Hip Articular Cartilage With Magnetic Resonance Fingerprinting. J. Magn. Reson. Imaging 50, 810–815 (2019).
- Yu, Z. et al. Exploring the sensitivity of magnetic resonance fingerprinting to motion. Magn. Reson. Imaging 54, 241–248 (2018).
- King, N. S., Crawford, S., Wenden, F. J., Moss, N. E. G. & Wade, D. T. The Rivermead Post Concussion Symptoms Questionnaire: a measure of symptoms commonly experienced after head injury and its reliability. J. Neurol. 242, 587–592 (1995).
- Wilson, J. T., Pettigrew, L. E. & Teasdale, G. M. Structured interviews for the Glasgow Outcome Scale and the extended Glasgow Outcome Scale: guidelines for their use. J. Neurotrauma 15, 573–85 (1998).
10. Tun, P. A. & Lachman, M. E. Telephone assessment of cognitive function in adulthood: the Brief Test of Adult Cognition by Telephone. Age Ageing 35, 629–632 (2006).
11. Hulkower, M. B., Poliak, D. B., Rosenbaum, S. B., Zimmerman, M. E. & Lipton, M. L. A Decade of DTI in Traumatic Brain Injury: 10 Years and 100 Articles Later. Am. J. Neuroradiol. 34, 2064–2074 (2013).
12. Haacke, E. M. et al. Common data elements in radiologic imaging of traumatic brain injury. J. Magn. Reson. Imaging 32, 516–543 (2010).
Figures