0044
Assessing the impact of cerebro-cerebellar and long association fibers in Temporal Lobe Epilepsy: a tractography based study1Department of Brain and Behavioral Science, University of Pavia, Pavia, Italy, 2Brain Connectivity Center Research Deparment, IRCCS Mondino Foundation, Pavia, Italy, 3I.R.C.C.S. Istituto Neurologico Carlo Besta, Milano, Italy, 4Neuroradiology Unit, IRCCS Mondino Foundation, Pavia, Italy, 5Hospital Niguarda, Milano, Italy, 6Milan Center for Neuroscience, Milano, Italy, 7Department of Radiology, IRCCS Policlinico San Donato, Milano, Italy, 8NMR Research Unit, Queen Square MS Centre, Department of Neuroinflammation, UCL Queen Square Institute of Neurology, Faculty of brain Sciences, University College London (UCL), London, United Kingdom
Synopsis
Advance tractography were performed on cerebro-cerebellar and long association fibers, characterized with diffusion tensor imaging, diffusion kurtosis imaging and NODDI parameter maps. The aim of this work is investigate whether white matter alterations of specific tracts can be selectively related to disfunction of declarative long term memory. Our findings show how relationship between microstructural alterations and neuropsychological scores should be investigated taking account in specific area of white matter restriced to tracts or bundle.
Introduction
In a previous work[1], we showed white-matter (WM) alterations patterns are specific to left and right Temporal Lobe Epilepsy (TLE) in patiens. Particularly interesting alterations were found in the cerebellum, which is getting increasing attention in experimental models of epilepsy[2]. Indeed, these models hypothesize that the cerebellum has a crucial role in seizure resolution, suggesting that it could be a potential target for therapeutic intervention[3][4].Here, we further investigated TLE patients in order to assess whether WM alterations of specific tracts can be selectively correlated to left or right disfunction of declarative long-term-memory (LTM) [5]. We examinate both the long association fibers passing through the temporal lobes and tracts involved in the cerebro-cerebellar circuits. These tracts were reconstructed using advanced tractography[6] and characterized by the mean of microstructural metrics derived from Diffusion-Tensor-Imaging (DTI)[7], Diffusion-Kurtosis-Imaging (DKI)[8], and Neurite-Orientation-Dispersion-and-Density-Imaging (NODDI)[9].
Methods
Subjects: 28 TLE patients (36.0±8.9y, 16 females) and 16 healthy-controls (HC) (32.3±6.8y, 8 females) were considered. Seizures were lateralized according to medical history, neurological examination, interictal electroencephalography, and positron emission tomography. The epileptogenic-zone was located in the left hemisphere for 13 patients (35.3±7.8y, 7 females) and in the right for 15 patients (36.7±10.0y, 9 females). Participants were given an extensive presurgical neuropsychological assessment from which paired-associate-learning (PAL) and short-story-tests (SST) were selected.Acquisition: MRI data were acquired with a 3T MR-scanner (Skyra, SiemensAG, Erlangen, Germany). Diffusion-Weighted (DW) images were acquired with a twice refocused SE-EPI sequence: TR/TE=8400/93ms, 70 axial slices with no gap, 2.2x2.2x2.2mm3 isotropic voxel, 45 non-collinear DW-directions with b=1000/2000s/mm2 and 9 volumes with no DW (b=0s/mm2). A high-resolution 3DT1-weighted (T1w) image were acquired with a multi-echo FLASH sequence: TR=19 ms, six equidistant TEs from 2.46 to 14.76 ms, flip angle 23°, 176 sagittal slices, 1mm3 isotropic resolution.
Preprocessing: Gibbs-ringing reduction, denoising, eddy-currents and geometrical distortion correction, and motion realignment were performed on the DWimages (FSL,https://fsl.fmrib.ox.ac.uk/fsl/fslwiki). DTI fitting was used to create maps of fractional anisotropy (FA), mean, axial and radial diffusivities (MD, AD and RD); DKI provided mean, axial and radial kurtosis (MK, AK and RK); NODDI provided maps of orientation-dispersion-index (ODI) and neurite density (ND). T1w images were segmented into cortical gray, deep gray and white matter, as well as cerebrospinal fluid, and normalized to the MNI152 space.
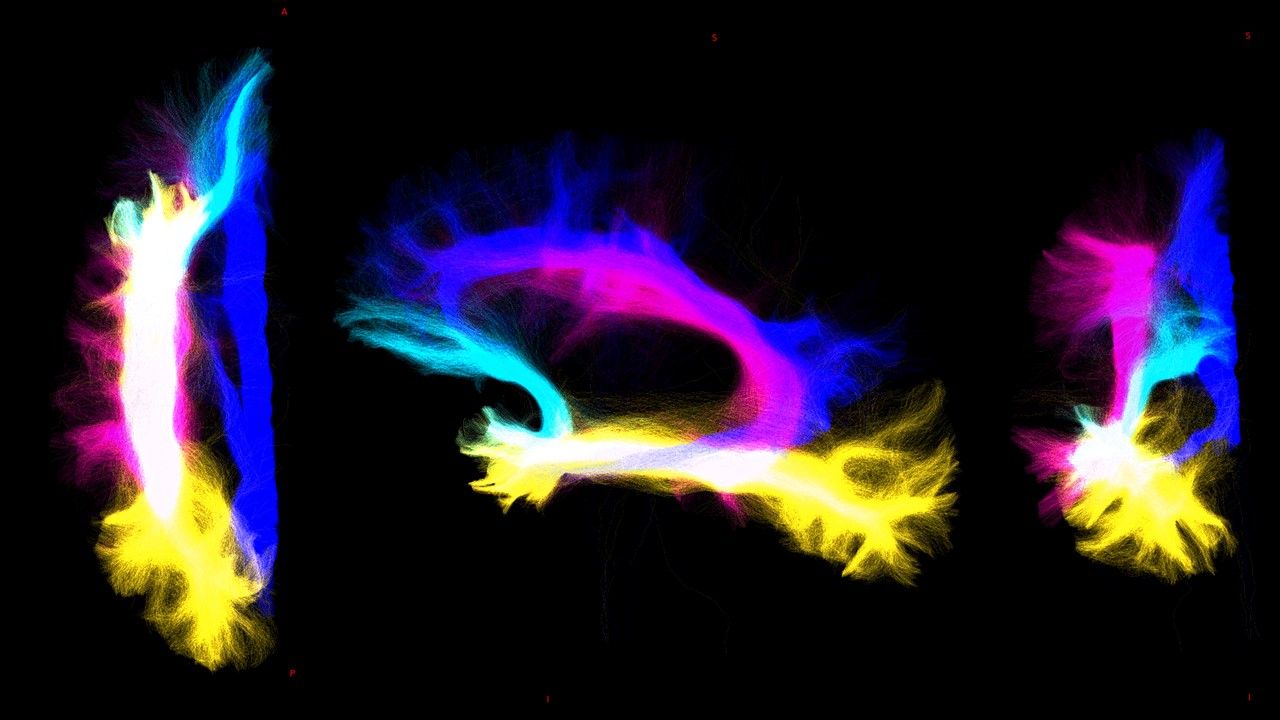
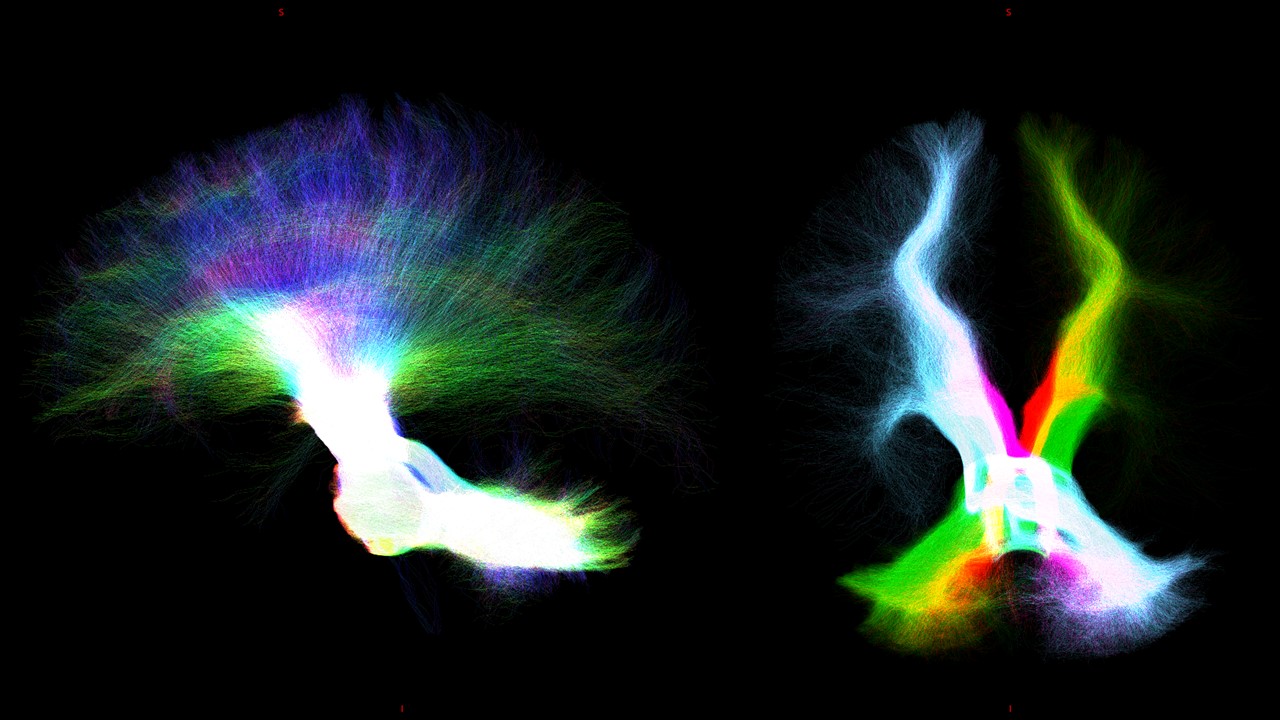
Whole-brain-tractography and tracts extraction: Multi-shell-multi-tissue constrained-spherical-deconvolution[10] and probabilistic streamline tractography (iFOD2)[11] were used to perform a whole-brain anatomically-constrained-tractography[6] with 30million streamlines. Specific regions of interests (ROIs) were defined in MNI152space and aligned to the DWimages of all subjects by inverting the T1w-to-MNI152 transformation. From the whole-brain-tractogram, 5 tracts were extracted: 1) cerebello-thalamo-cortical (CTC)[12], 2) cerebro-ponto-cerebellar (CPC)[13], 3) superior longitudinal fasciculus (SLF)[14], 4) inferior longitudinal fasciculus (ILF)[14], 5) uncinate fasciculus (UF)[14] and cingulum (CG)[14].
Statistics: For each tract, the volume and mean value of all diffusion-derived metrics were obtained. Differences between the three groups (HC, Left-TLE and Right-TLE) were evaluated with an ANOVA-test, and their correlations with neuropsychological scores were assessed with Pearson’s correlation coefficient (SPSSv21,https://www.ibm.com/it-it/analytics/spss-statistics-software).
Results
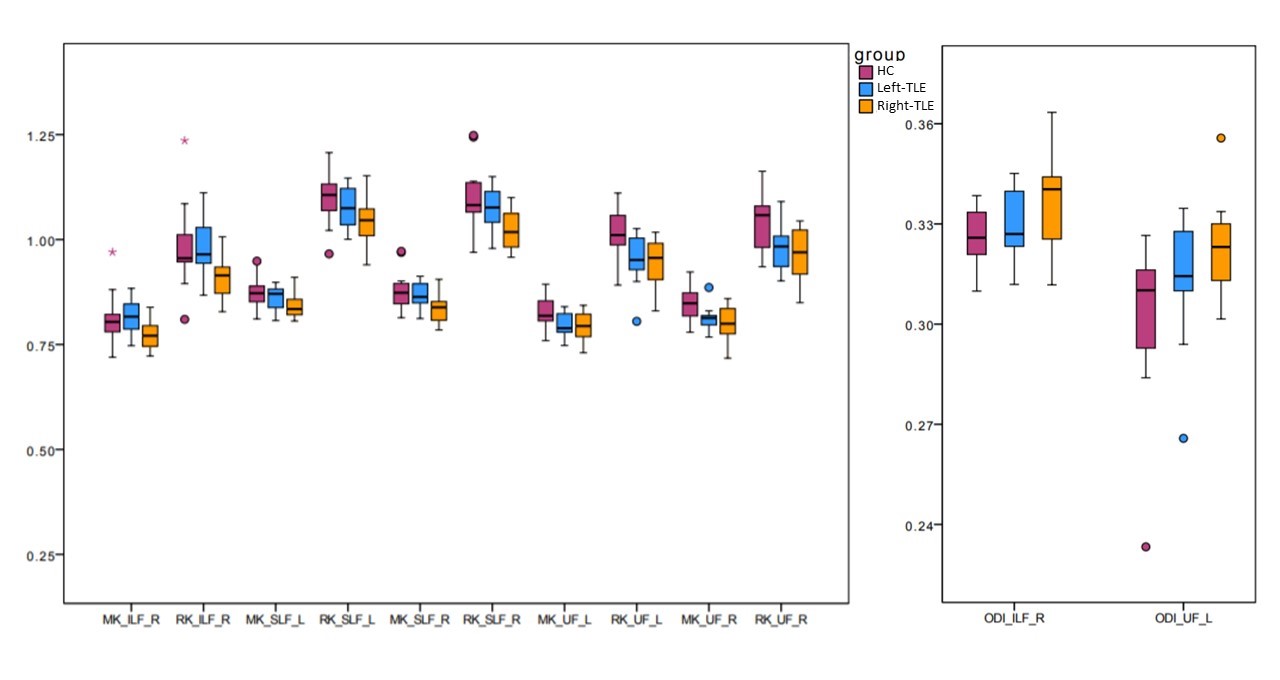
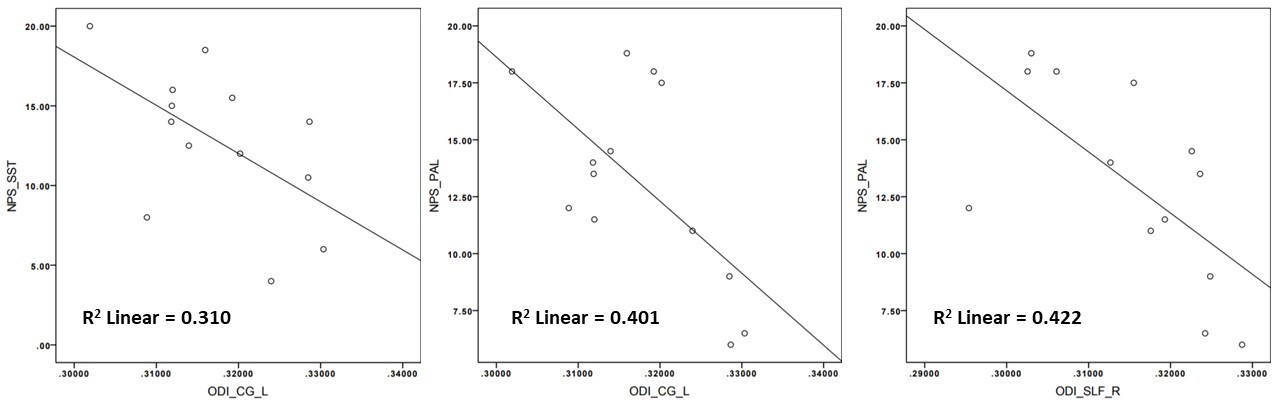
DTI-derived metrics were not significantly altered in TLE patients, while MK and RK decreased compared to HC in all long association fibres and CG in both Left-TLE and Right-TLE. ODI increase was detected in Right-TLE, in the right-ILF and left-UF compared to HC. Furthermore, Right-TLE showed volume reduction of the CPC tract connecting the right cerebral cortex with the left cerebellum. The most affected tract was the UF, which showed bilateral impairment both in Left-TLE and Right-TLE.Furthermore, ODI of left-CG negatively correlated with PAL (p-value=0.020) and with SST (p-value=0.048) in Left-TLE, while right-SLF ODI negatively correlated with PAL (p-value=0.016).
Discussion & conclusion
In this work, we investigated TLE patients in order to assess whether WM alterations of specific tracts can be selectively related to disfunction of declarative-LTM. Right-TLE showed more alterations than Left-TLE. This finding is surprising because generally, and also in our previous work, left-TLE presented more widespread WM impairment. A possible explanation could be the small sample size. Given that we considered specific long associative tracts covering a large portion of the temporal lobes known to be altered, this result is puzzling. It is also possible that having averaged microstructural properties over long-range tracts, possible localised alterations in the proximity of the epileptogenic area may have been obscured by more normal distal voxels. Similarly, previously observed alterations in cerebellar area maybe diluted when properties are average along the entire tract from the cerebellum to the cortex. Indeed, we hypothesize that the UF is the most compromised tract because it is the shortest amongst the reconstructed tracts and the closest to the hippocampus, hence to the epileptogenic area.The anticorrelation that emerged between neuropsychological scores and CG can be explained by the fact that a great portion of this tract terminates into the hippocampal gyrus, supporting by its strongly involved in memory. Correlations of SLF ODI with PAL can be explained by the overall role of the right SLF with language functions.
These preliminary results encourage further investigations to assess WM alterations in relation to specific systems and circuits. Moreover, the relationship between microstructural alterations and neuropsychological scores should be investigated with linear regression models able to identify which specific metrics are responsible for neuropsychological tests variance.
Acknowledgements
3TLE is a multicentric research project granted by Italian Health Ministry (NET2013-02355313): Magnetic resonance imaging in drug-refractory temporal lobe epilepsy: standardization of advanced structural and functional protocols at 3T, to identify hippocampal and extra-hippocampal abnormalities. Acknowledgments also to the UK MS Society (#77), Wings for Life (#169111), Horizon2020 (CDS-QUAMRI, #634541), BRC (#BRC704/CAP/CGW). This research received funding by H2020 Research and Innovation Action Grants Human Brain Project 785907 and 945539 (SGA2 and SGA3) and by the MNL Project “Local Neuronal Microcircuits” of the Centro Fermi (Rome, Italy) to FP.References
[1] N. Rolandi et al., “White matter microstructure characterisation in left and right temporal lobe epilepsy (TLE) using TBSS,” Proc Int Soc Magn Reson Med, vol. 25, no. 3, pp. 460–464, 2020, doi: 10.1111/jon.12154.
[2] E. Krook-Magnuson, G. G. Szabo, C. Armstrong, M. Oijala, and I. Soltesz, “Cerebellar directed optogenetic intervention inhibits spontaneous hippocampal seizures in a mouse model of temporal lobe epilepsy,” eNeuro, vol. 1, no. 1, 2014, doi: 10.1523/ENEURO.0005-14.2014.
[3] L. Kros, O. H. J. Eelkman Rooda, C. I. De Zeeuw, and F. E. Hoebeek, “Controlling Cerebellar Output to Treat Refractory Epilepsy,” Trends Neurosci., vol. 38, no. 12, pp. 787–799, 2015, doi: 10.1016/j.tins.2015.10.002.
[4] M. L. Streng and E. Krook-Magnuson, “The cerebellum and epilepsy,” Epilepsy Behav., vol. ArtInPress, p. 14, 2020, doi: 10.1016/j.yebeh.2020.106909.
[5] G. Salvato et al., “Declarative long-term memory and the mesial temporal lobe: Insights from a 5-year postsurgery follow-up study on refractory temporal lobe epilepsy,” Epilepsy Behav., vol. 64, pp. 102–109, 2016, doi: 10.1016/j.yebeh.2016.08.029.
[6] R. E. Smith, J. Tournier, F. Calamante, and A. Connelly, “Anatomically-constrained tractography: Improved diffusion MRI streamlines tractography through effective use of anatomical information,” Neuroimage, vol. 62, no. 3, pp. 1924–1938, 2012, doi: 10.1016/j.neuroimage.2012.06.005.
[7] A. L. Alexander, J. E. Lee, M. Lazar, and A. S. Field, “Diffusion Tensor Imaging of the Brain,” vol. 4, no. July, pp. 316–329, 2007.
[8] J. H. Jensen, J. A. Helpern, A. Ramani, H. Lu, and K. Kaczynski, “Diffusional kurtosis imaging: The quantification of non-Gaussian water diffusion by means of magnetic resonance imaging,” Magn. Reson. Med., vol. 53, no. 6, pp. 1432–1440, 2005, doi: 10.1002/mrm.20508.
[9] H. Zhang, T. Schneider, C. A. Wheeler-Kingshott, and D. C. Alexander, “NODDI: Practical in vivo neurite orientation dispersion and density imaging of the human brain,” Neuroimage, vol. 61, no. 4, pp. 1000–1016, 2012, doi: 10.1016/j.neuroimage.2012.03.072.
[10] B. Jeurissen, J. Tournier, T. Dhollander, A. Connelly, and J. Sijbers, “NeuroImage Multi-tissue constrained spherical deconvolution for improved analysis of multi-shell diffusion MRI data,” Neuroimage, vol. 103, pp. 411–426, 2014, doi: 10.1016/j.neuroimage.2014.07.061.
[11] J.-D. Tournier, F. Calamante, and A. Connelly, “Improved probabilistic streamlines tractography by 2nd order integration over fibre orientation distributions,” Proc Int Soc Magn Reson Med 18, 2010. https://www.semanticscholar.org/paper/Improved-probabilistic-streamlines-tractography-by-Tournier-Calamante/b4ffcb9ec889a8a68bffc46387a96b78a50ef94a.
[12] F. Palesi et al., “Contralateral cerebello-thalamo-cortical pathways with prominent involvement of associative areas in humans in vivo,” Brain Struct. Funct., vol. 220, no. 6, pp. 3369–3384, 2015, doi: 10.1007/s00429-014-0861-2.
[13] F. Palesi et al., “Contralateral cortico-ponto-cerebellar pathways reconstruction in humans in vivo: Implications for reciprocal cerebro-cerebellar structural connectivity in motor and non-motor areas,” Sci. Rep., vol. 7, no. 1, pp. 1–13, 2017, doi: 10.1038/s41598-017-13079-8.
[14] K. G. Schilling, F. Rheault, L. Petit, C. B. Hansen, V. Nath, and F. Yeh, “Tractography dissection variability : what happens when 42 groups dissect 14 white matter bundles on the same dataset ?,” 2020.
Figures