0039
Seizure frequency in relation to effective connectivity of the hippocampal–diencephalic–cingulate in temporal lobe epilepsy1Department of Diagnostic Radiology, Singapore General Hospital, Singapore, Singapore, 2Duke-NUS Medical School, Singapore, Singapore, 3Institute of Medical Device and Imaging, College of Medicine, National Taiwan University, Taipei, Taiwan, 4Department of Medical Biophysics, University of Toronto, Toronto, ON, Canada, 5Physical Sciences Platform, Sunnybrook Research Institute, Toronto, ON, Canada, 6Department of Neurology, National Taiwan University Hospital and College of Medicine, Taipei, Taiwan, 7Graduate Institute of Brain and Mind Sciences, College of Medicine, National Taiwan University, Taipei, Taiwan, 8Department of Medical Imaging, National Taiwan University Hospital and College of Medicine, Taipei, Taiwan, 9Molecular Imaging Center, National Taiwan University, Taipei, Taiwan
Synopsis
To seek neural correlates of seizure recurrence, the structural equation modeling (SEM) and resting-state functional MRI were performed to evaluate intrinsic effective connectivity (iEC) within the Papez circuit, hippocampal–diencephalic–cingulate (HDC) model, and simplified HDC model in patients with left and right temporal lobe epilepsy. We verified that the simplified HDC model was the best model to estimate iEC and found associations between seizure frequency and aberrant iEC on the paths connecting to the mammillary body. Our findings could facilitate the discovery of potential epilepsy pathways and the development of novel targeted therapies for unilateral temporal lobe epilepsy.
Introduction
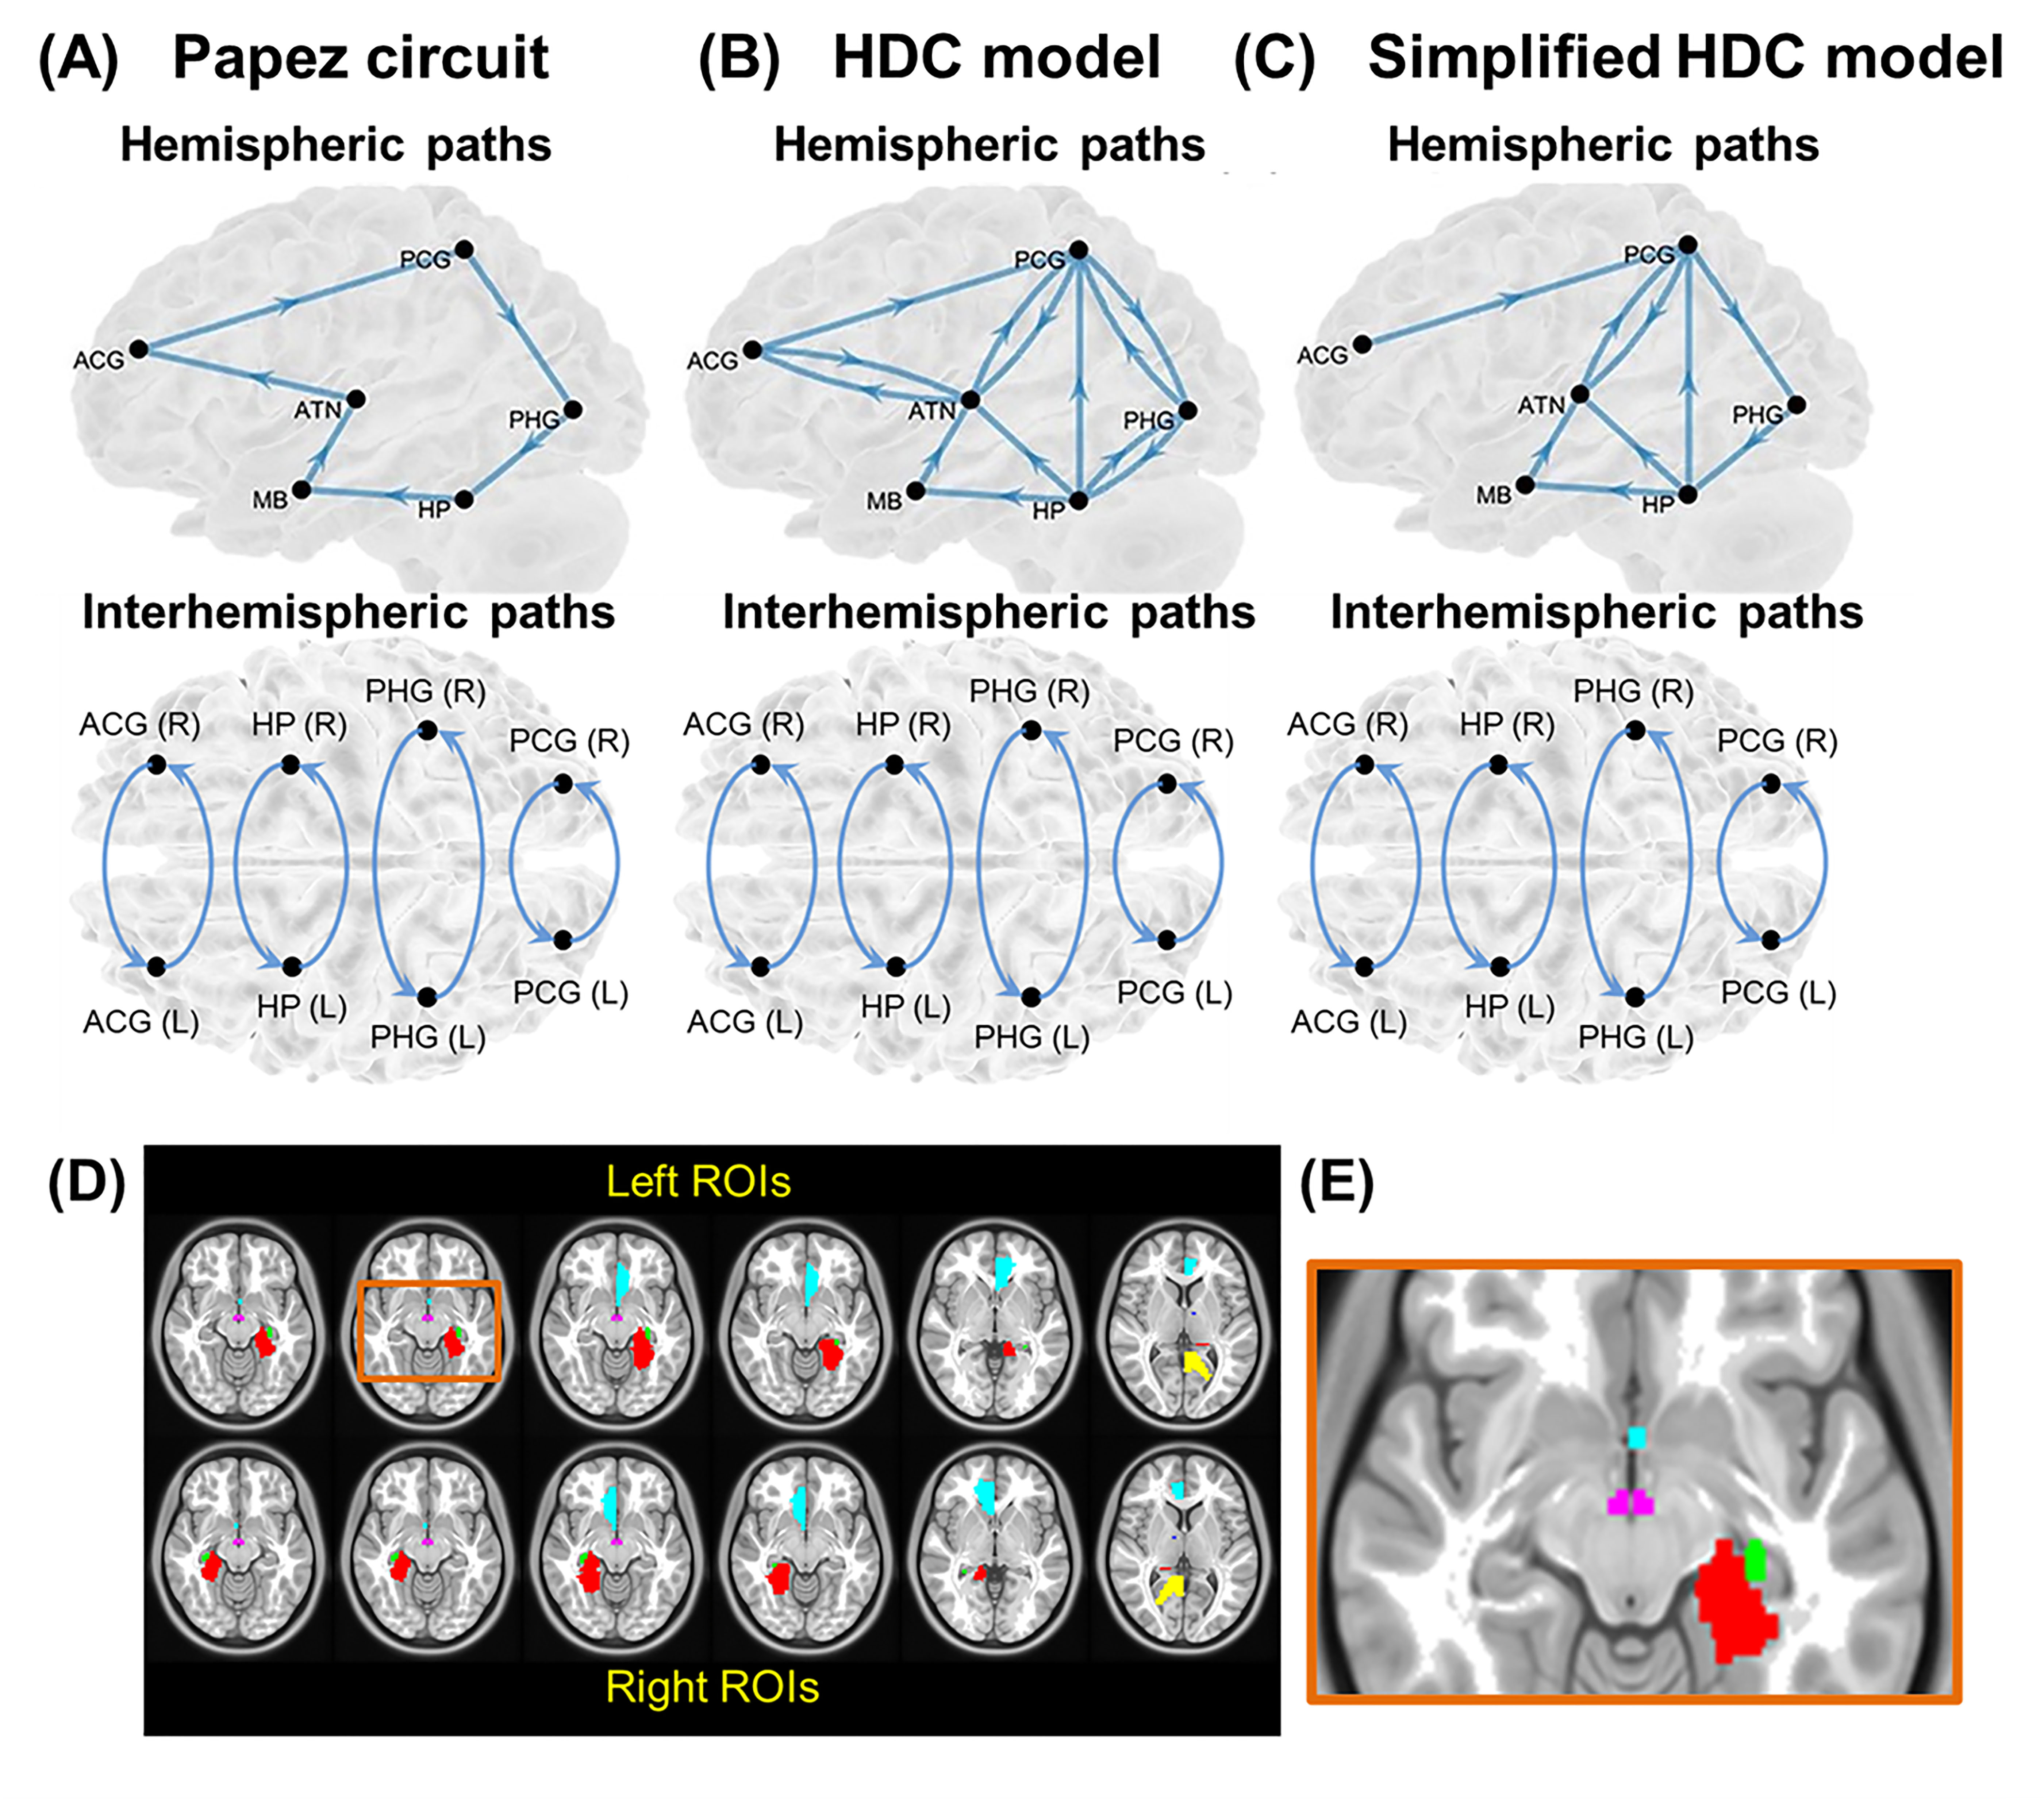
Temporal lobe epilepsy (TLE) with mesial temporal sclerosis (MTS) is a common intractable epilepsy1. Although functional connectivity analysis for resting-state functional MRI (rsfMRI) data demonstrated seizure-related brain dysfunctions in TLE2,3, such an analytic method lacks the directionality of information flow between brain regions. Hence, several rsfMRI studies turned to investigate intrinsic effective connectivity (iEC) that describes the strength of intrinsic directional information flow between brain regions at rest4,5. To date, the aberrant iEC within a brain-wise network relevant to seizure recurrence remains unclear. The Papez circuit6, which is a well-known neural model in the limbic region, has been implicated in seizure generation and propagation7. However, with the recent development of tract-tracing techniques for ex-vivo animal brains, a more comprehensive neural model than Papez circuit was proposed, called the hippocampal–diencephalic–cingulate (HDC) model8. Bubb et al. (2017)8 further suggested the simplified version of HDC model (Fig. 1) in terms of the existing human memory circuitry. Here, we performed structural equation modeling (SEM) to evaluate iEC within the Papez circuit, HDC model, and simplified HDC model (Fig. 1) in TLE patients with unilateral MTS. We predicted that the HDC or simplified HDC model would fit rsfMRI signals better than the Papez circuit owing to more anatomical connections. The best-fitted model was used to identify shared iEC alterations in both patients with left and right MTS. We hypothesized that some of shared iEC alterations would be correlated with seizure frequency, indicating the significance of neurophysiology underlying seizure recurrence.Methods and Materials
Demographics: Thirty patients with unilateral MTS (left/right MTS = 14/16), and 37 healthy controls were recruited (Table 1). All patients underwent clinical assessments based on the current International League Against Epilepsy classification9. The information of seizure frequency was obtained from seizure diaries and interviews of patients and their family members.Data acquisition: All MRI data was acquired on a 3-Tesla MRI system (Tim Trio; Siemens, Erlangen, Germany), including high-resolution T1-weighted imaging and 6-minute rsfMRI.
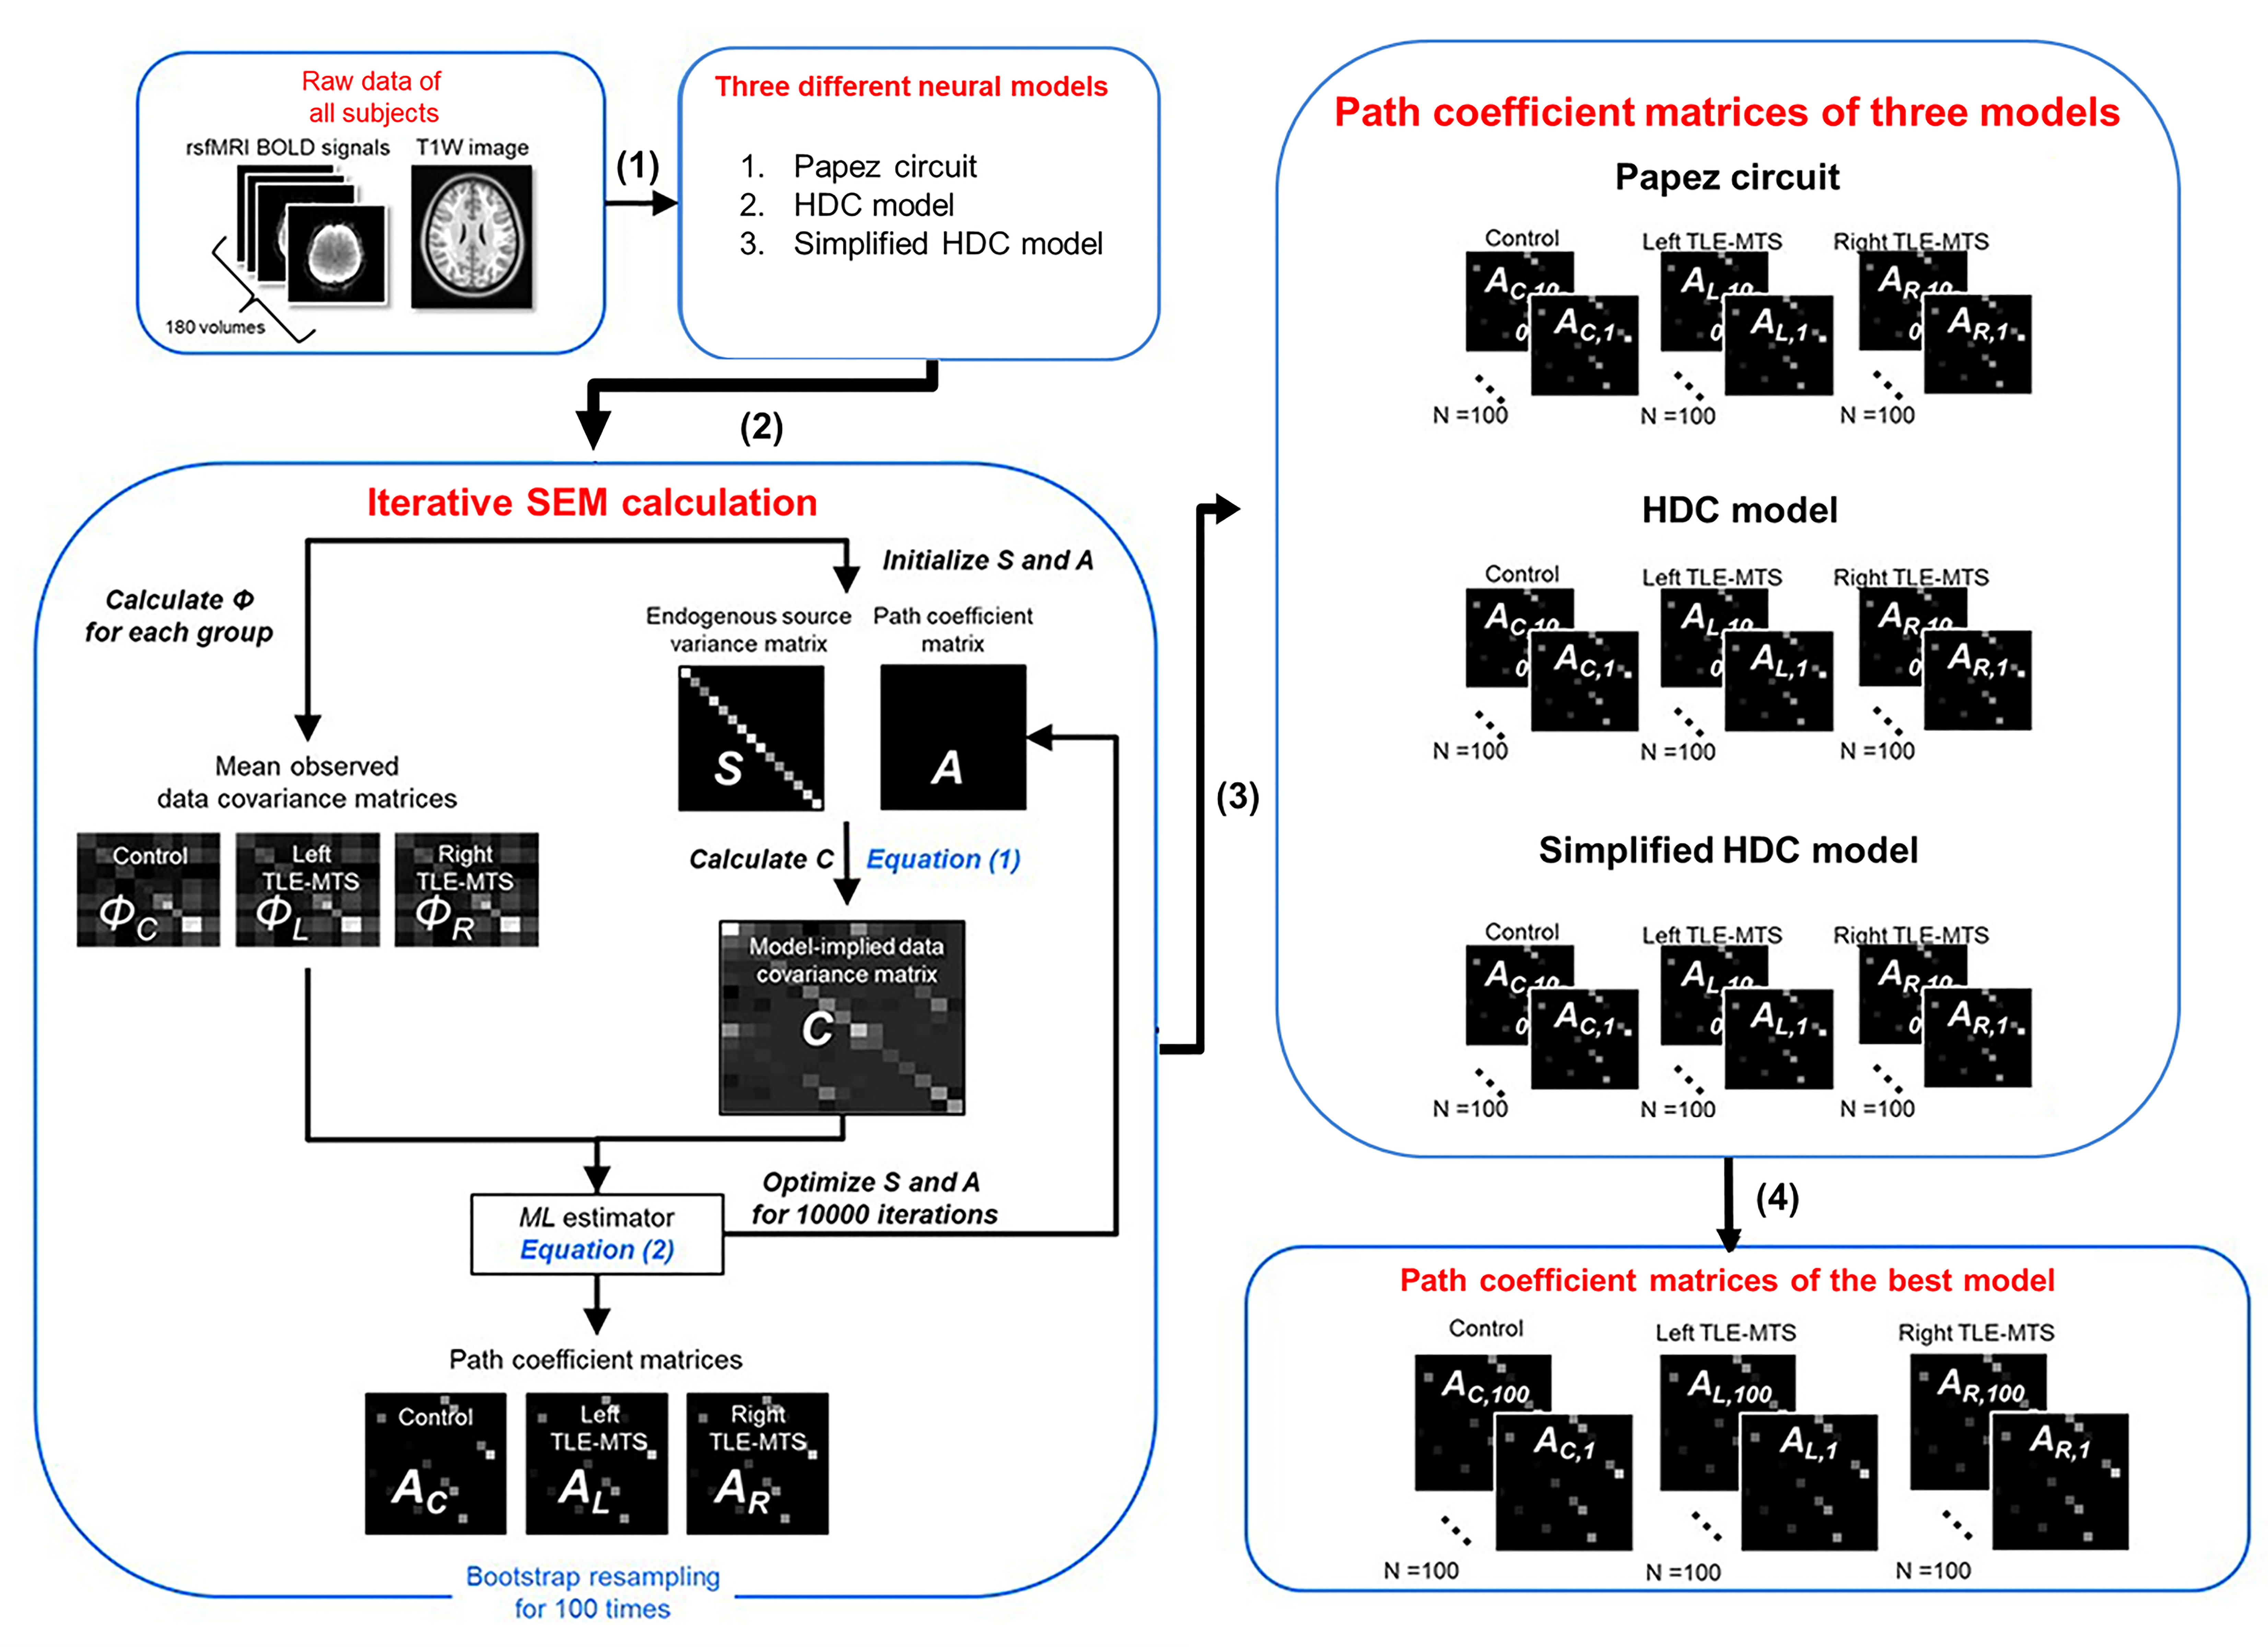
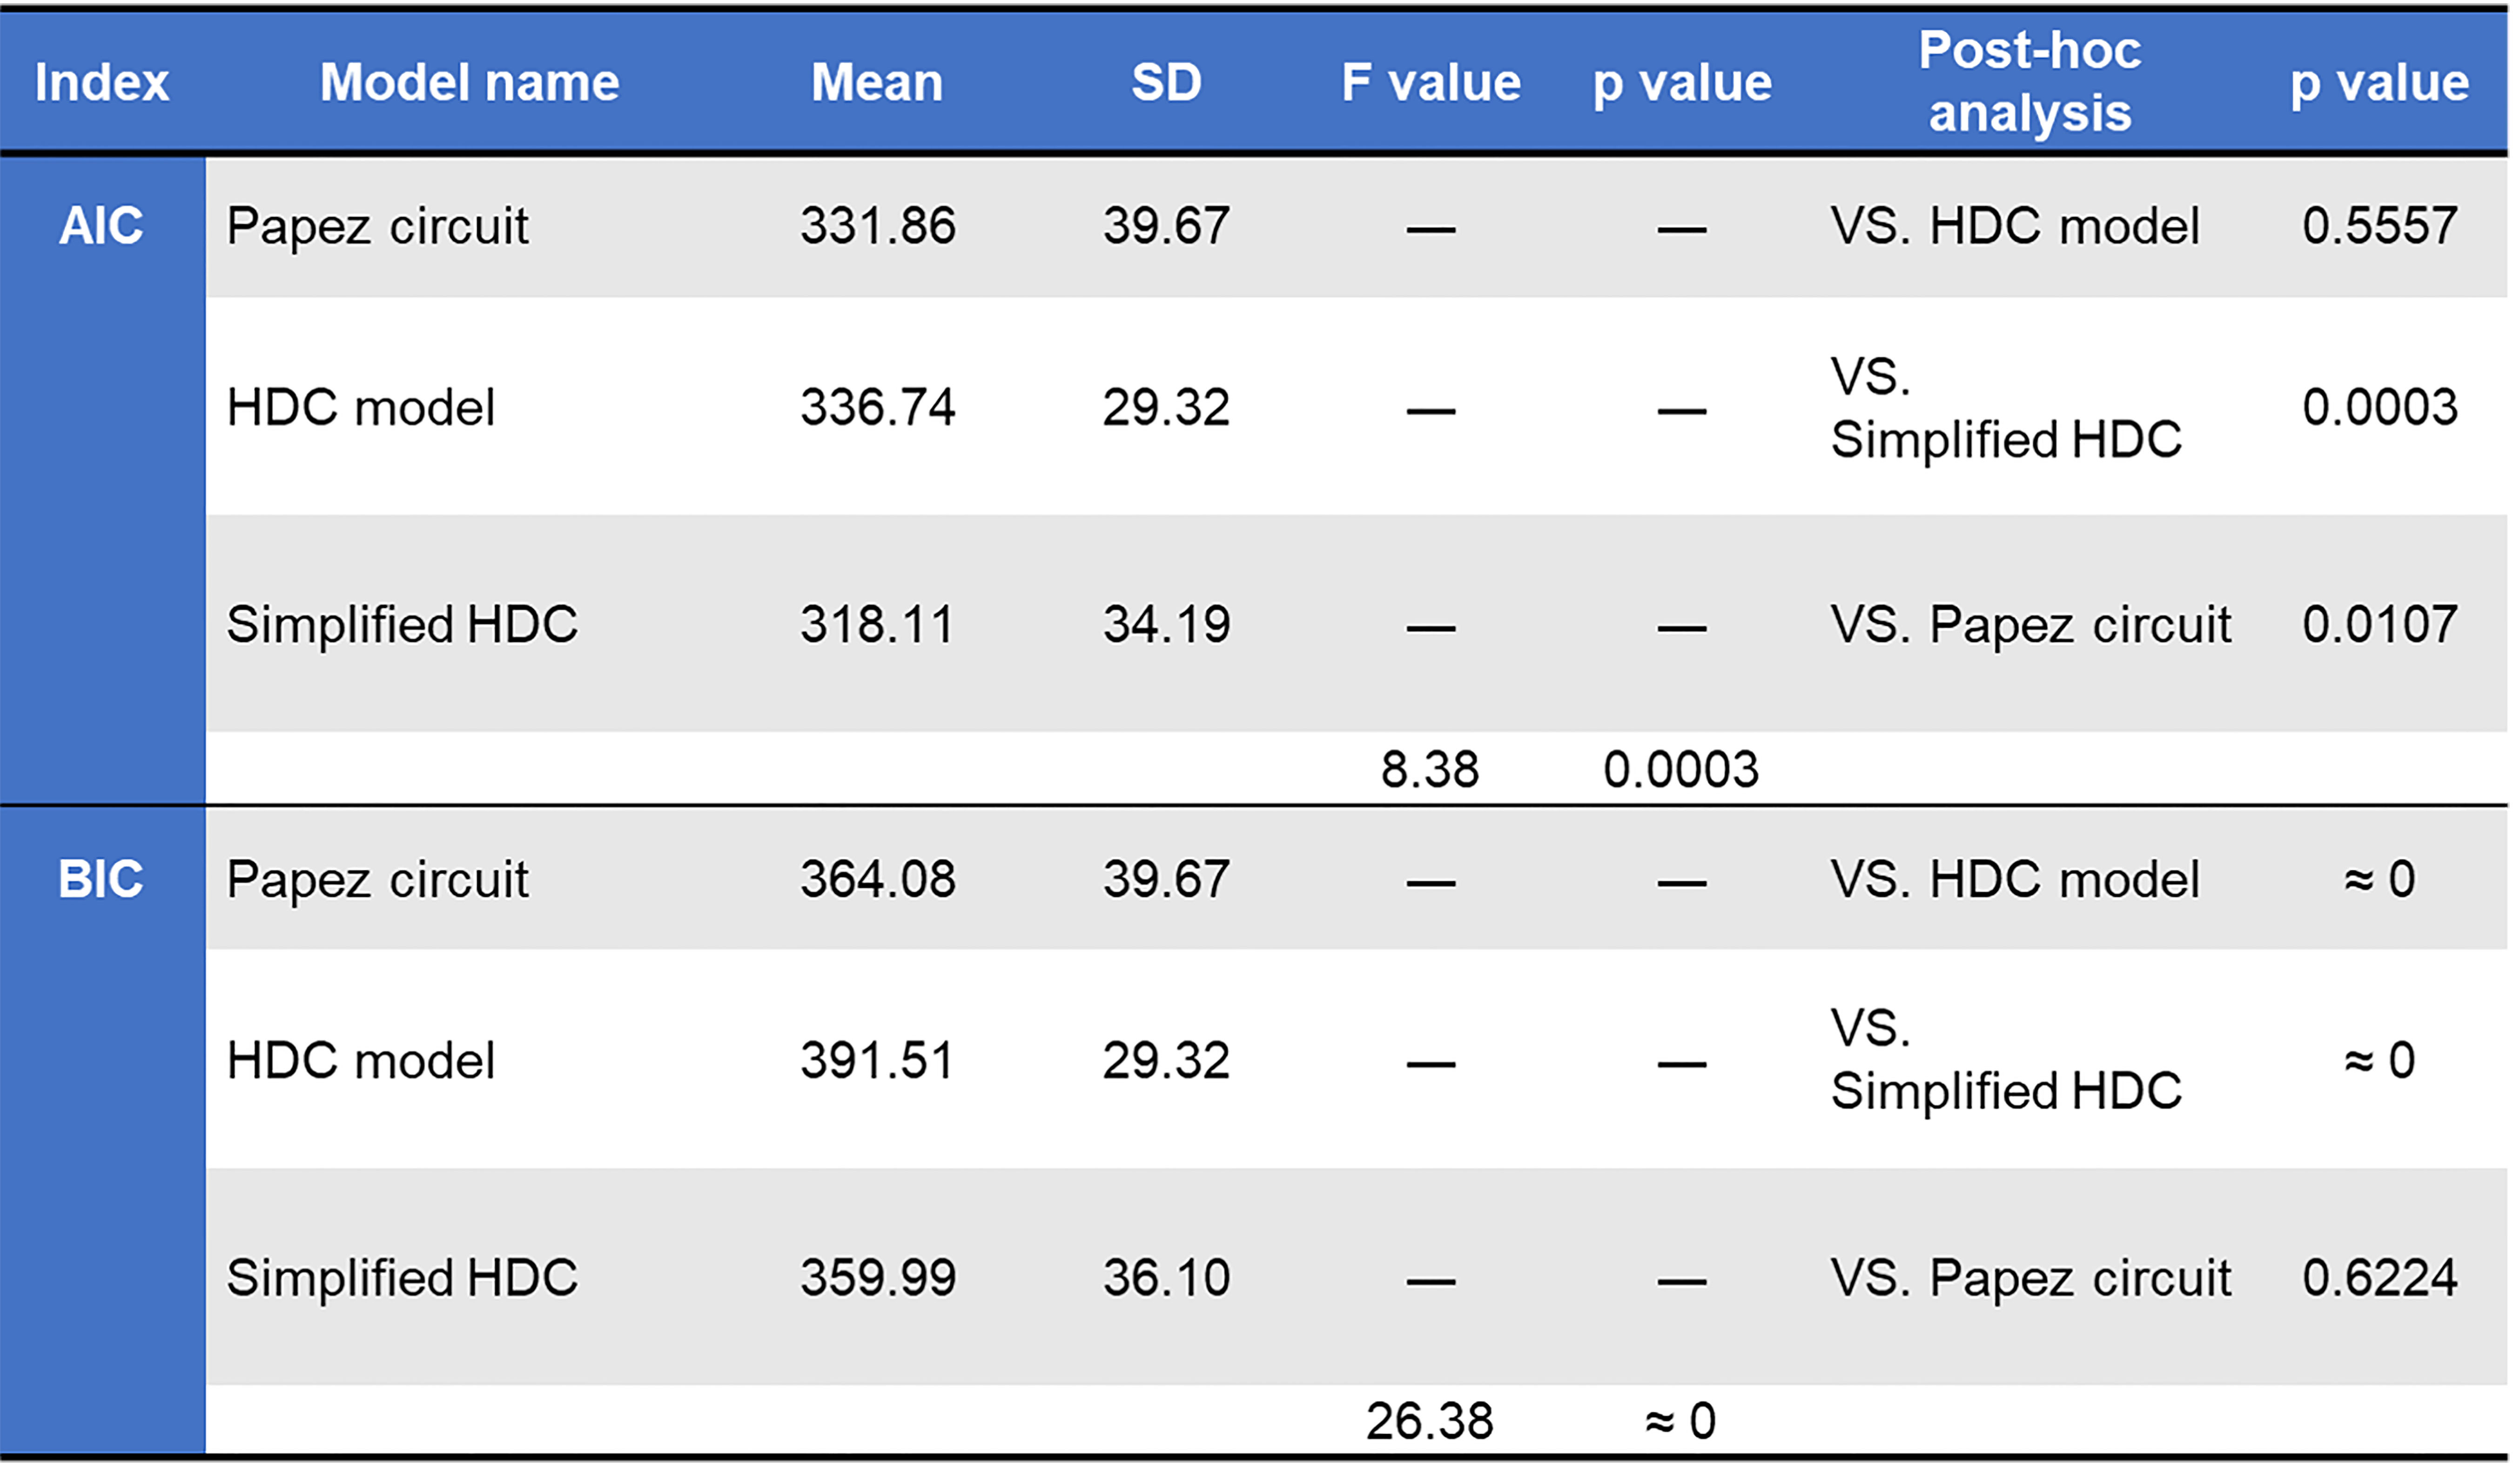
Data preprocessing and SEM analysis: The standard preprocessing of rsfMRI data was conducted using the rsfMRI data analysis toolbox10 based on SPM 12 (Wellcome Trust Center for Neuroimaging, London, UK) under MATLAB platform. SEM implemented by inhouse MATLAB script enables the determination of causality between brain areas by estimating whether the predefined model-implied data covariance matrix supports the observed data covariance matrix11. We constructed three causal models with directional paths (Fig. 1), and respectively evaluated the applicability of the three models to our rsfMRI datasets. The bootstrapped maximum-likelihood-based SEM was used to minimize a cost function to estimate path coefficients to represent iEC in the given model (Fig. 2). The χ2 test, root mean square error of approximation (RMSEA), Akaike information criterion (AIC), and Bayesian Information Criterion (BIC) were employed to evaluate the goodness of model fit to rsfMRI BOLD signals. Hypothetically, the candidate neural model with the lowest AIC and BIC values in healthy controls was selected as the best-fitted model12.
Statistical Analysis: The shared iEC alterations on the paths that showed significant changes in both patient groups were used to correlate with seizure frequency by using the multivariate linear regression analysis with adjustments for age and gender.
Results
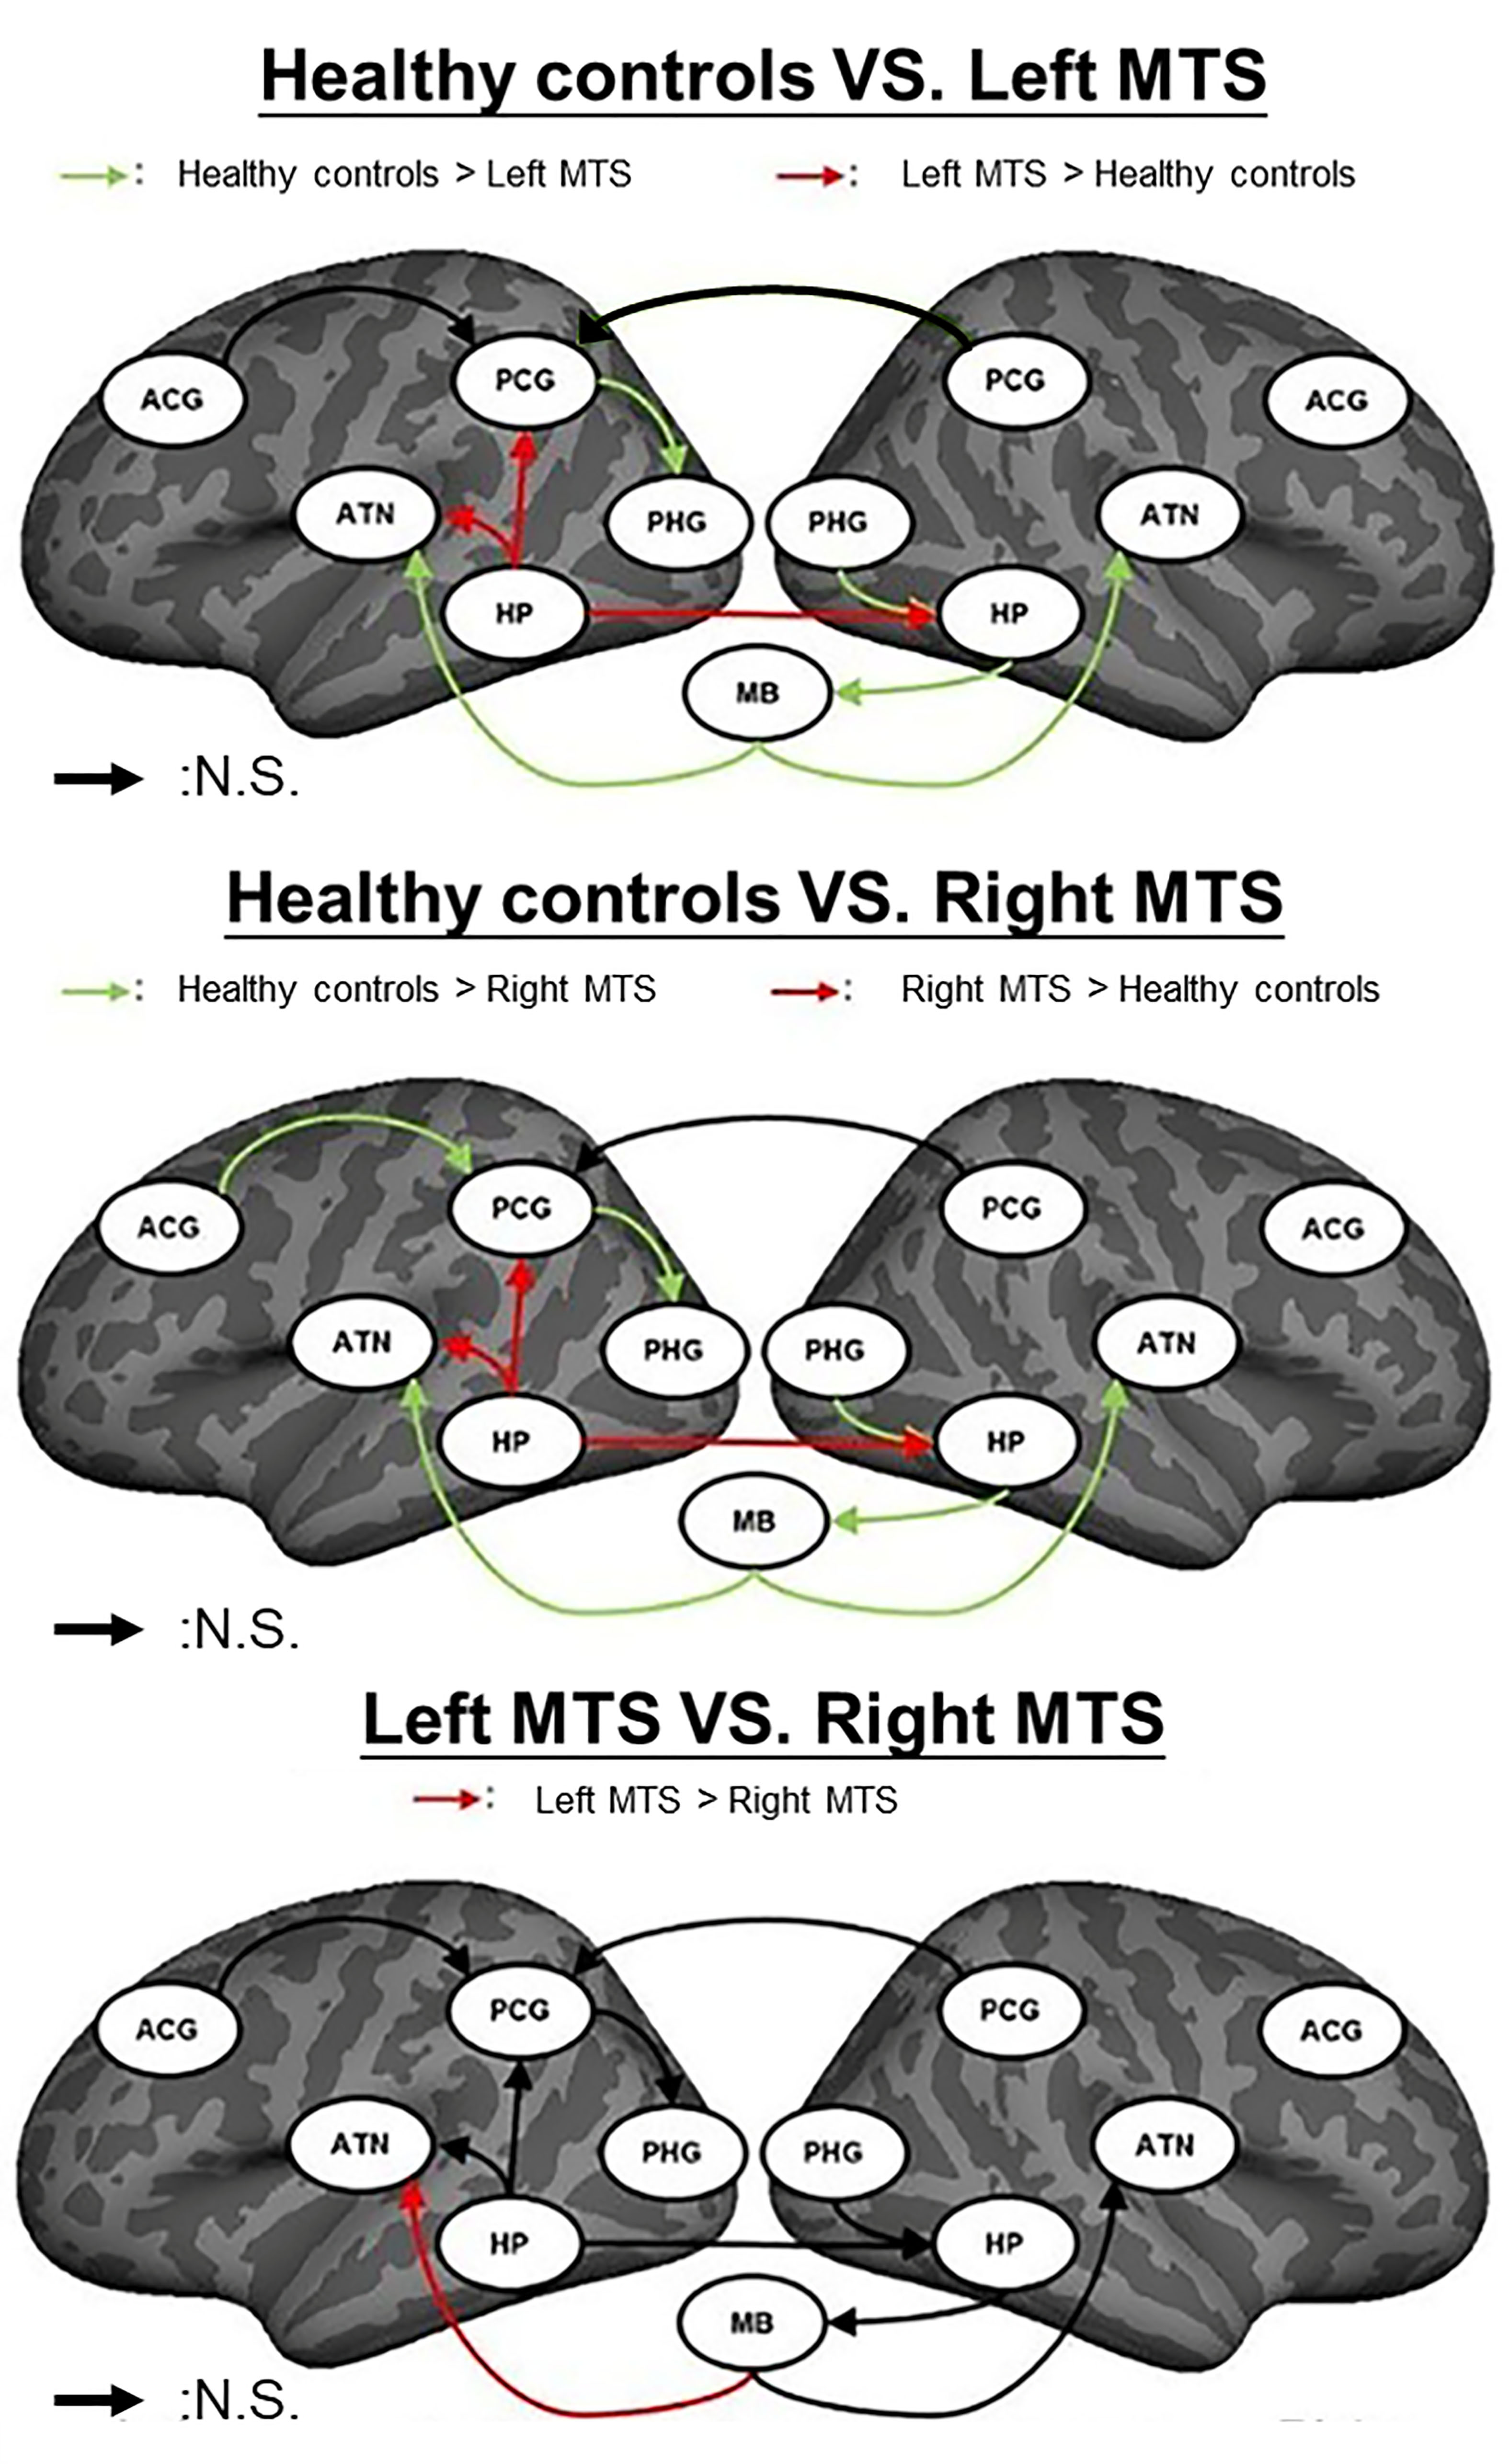
Overall, rsfMRI BOLD signals fitted all proposed models for three study groups (p>0.99, the null-hypothesis H0 was not rejected; RMSEA<0.05). The simplified HDC model with the lowest mean AIC and BIC values had the best performance on model fitting among the three models (Table 2). Compared with the healthy controls (Fig. 3), the two patient groups showed shared iEC alterations on five paths with decreased iEC (left posterior cingulate gyrus [PCG]→left parahippocampal gyrus [PHG], mammillary body [MB]→left anterior thalamic nuclei [ATN], right PHG→right hippocampus [HP], right HP→MB, and MB→right ATN) and three paths with increased iEC (left HP→left PCG, left HP→left ATN, and left HP→right HP). In patients with unilateral MTS, we identified a significant linear relationship between aberrant iEC and seizure frequency (adjusted–R2=0.350, p=0.037), including the paths of MB→left ATN (standardized–β value=0.580, p=0.013), right HP→MB (standardized–β value=0.541, p=0.045), and MB→right ATN (standardized–β value=−0.711, p=0.006).Discussion
The between-model comparisons of AIC and BIC scores indicated that the simplified HDC network was the most appropriate model to estimate iEC because the directionality of its paths was in agreement with previous neurophysiological studies8. To the best of our knowledge, the present study is the first to estimate iEC on the interconnected paths within the simplified HDC model using iterative SEM calculations, as well as to characterize shared and distinct iEC alterations in TLE patients with left and right MTS. The findings indicate that functional abnormalities in the MB-associated connections represent the common neurophysiology of seizure recurrence. The findings imply that therapy targeting the mammillothalamic tracts could be helpful for patients with drug-resistant TLE with unilateral MTS in agreement with the finding of a recent deep brain stimulation study13.Conclusion
The knowledge could provide valuable insights into aberrant directional information flows in epilepsy, and their neurophysiological significance relevant to seizure recurrence. Our findings could facilitate the discovery of potential epilepsy pathways and the development of novel targeted therapies for TLE with unilateral MTS.Acknowledgements
No acknowledgement found.References
1. Wiebe S, Jette N. Pharmacoresistance and the role of surgery in difficult to treat epilepsy. Nat Rev Neurol 2012;8(12):669-677.
2. Laufs H, Lengler U, Hamandi K, Kleinschmidt A, Krakow K. Linking generalized spike-and-wave discharges and resting state brain activity by using EEG/fMRI in a patient with absence seizures. Epilepsia 2006;47(2):444-448.
3. Lee HW, Arora J, Papademetris X, Tokoglu F, Negishi M, Scheinost D, et al. Altered functional connectivity in seizure onset zones revealed by fMRI intrinsic connectivity. Neurology 2014;83(24):2269-2277.
4. Ji GJ, Zhang Z, Zhang H, Wang J, Liu DQ, Zang YF, et al. Disrupted causal connectivity in mesial temporal lobe epilepsy. PLoS One 2013;8(5):e63183.
5. Park CH, Choi YS, Kim HJ, Chung HK, Jung AR, Yoo JH, et al. Interactive effects of seizure frequency and lateralization on intratemporal effective connectivity in temporal lobe epilepsy. Epilepsia 2018;59(1):215-225.
6. Papez JW. A proposed mechanism of emotion. J Neuropsychiatry Clin Neurosci 1937;7(1):103-112.
7. Laxpati NG, Kasoff WS, Gross RE. Deep brain stimulation for the treatment of epilepsy: circuits, targets, and trials. Neurotherapeutics 2014;11(3):508-526.
8. Bubb EJ, Kinnavane L, Aggleton JP. Hippocampal - diencephalic - cingulate networks for memory and emotion: An anatomical guide. Brain Neurosci Adv 2017;1(1).
9. Fisher RS, Cross JH, French JA, Higurashi N, Hirsch E, Jansen FE, et al. Operational classification of seizure types by the International League Against Epilepsy: Position Paper of the ILAE Commission for Classification and Terminology. Epilepsia 2017;58(4):522-530.
10. Yan C, Zang Y. DPARSF: a MATLAB toolbox for "pipeline" data analysis of resting-state fMRI. Frontiers in Systems Neuroscience 2010;4(13).
11. Lin FH, Agnew JA, Belliveau JW, Zeffiro TA. Functional and effective connectivity of visuomotor control systems demonstrated using generalized partial least squares and structural equation modeling. Hum Brain Mapp 2009;30(7):2232-2251.
12. Huang P-H. Asymptotics of AIC, BIC, and RMSEA for Model Selection in Structural Equation Modeling. Psychometrika 2017;82(2):407-426.
13. Balak N, Balkuv E, Karadag A, Basaran R, Biceroglu H, Erkan B, et al. Mammillothalamic and Mammillotegmental Tracts as New Targets for Dementia and Epilepsy Treatment. World Neurosurg 2018;110:133-144.
Figures
TABLE 1. Demographics of study groups.
Note: * indicates that post-hoc analysis shows a significant reduction in hippocampal volume. Abbreviations: AED = AntiEpileptic Drug; FAS = Focal Awareness Seizure; FBTCS = Focal to Bilateral Tonic–Clonic Seizure; FIAS = Focal Impaired Awareness Seizure; HP = HippocamPus; MTS = Mesial Temporal Sclerosis.