0037
Simultaneous 18F-FDG-PET and 1H-MRSI in Temporal Lobe Epilepsy Reveals Metabolic Alterations Concordant with SEEG Epileptogenicity
Hui Huang1, Jia Wang1, Miao Zhang2, Wei Liu3, Lihong Tang1, Yibo Zhao4,5, Rong Guo4,5, Yudu Li4,5, Zhi-Pei Liang4,5, Yao Li1, Biao Li2, and Jie Luo1
1School of Biomedical Engineering, Shanghai Jiao Tong University, Shanghai, China, 2Department of Nuclear Medicine, Ruijin Hospital, Shanghai Jiao Tong University School of Medicine, Shanghai, China, 3Department of Neurosurgery, Ruijin Hospital, Shanghai Jiao Tong University School of Medicine, Shanghai, China, 4Department of Electrical and Computer Engineering, University of Illinois at Urbana Champaign, Urbana, IL, United States, 5Beckman Institute for Advanced Sciences and Technology, University of Illinois at Urbana Champaign, Urbana, IL, United States
1School of Biomedical Engineering, Shanghai Jiao Tong University, Shanghai, China, 2Department of Nuclear Medicine, Ruijin Hospital, Shanghai Jiao Tong University School of Medicine, Shanghai, China, 3Department of Neurosurgery, Ruijin Hospital, Shanghai Jiao Tong University School of Medicine, Shanghai, China, 4Department of Electrical and Computer Engineering, University of Illinois at Urbana Champaign, Urbana, IL, United States, 5Beckman Institute for Advanced Sciences and Technology, University of Illinois at Urbana Champaign, Urbana, IL, United States
Synopsis
Both PET and MRSI could provide metabolic information of the epileptogenic zone, which could add value to presurgical planning of epilepsy patients. This study investigated metabolic alternations in patients with temporal lobe epilepsy (TLE) across their brain regions with different epileptogenicity, as defined using stereo-EEG (SEEG). Our experimental results showed FDG hypometabolism and NAA decrease in epileptogenic zone and propagation zone. These findings may lay a foundation for further investigation of tissue damage associated with epileptogenicity using high-resolution metabolic imaging.
Introduction
For drug-resistant epilepsy patients, accurate localization of epileptogenic zone is critical for presurgical planning.1 Stereo-electroencephalography (SEEG) remains mandatory to assess the network of epileptogenicity in some clinical situations, especially when patients have negative MRI.1,2 In temporal lobe epilepsy (TLE), both ipsilateral and contralateral hippocampal morphology changes are associated with seizure frequency, suggesting a relationship between initiation and propagation of epileptic activities and tissue damage.3 Both MRS/MRSI and FDG-PET have long been recognized as potentially powerful imaging tools to detect and visualize metabolic abnormalities, providing different but complementary metabolic information.2,4,5 Recently, FDG low uptake has been found to exhibit gradient of decrease from not-involved zone (NIZ) to seizure propagation zone (PZ) and then to epileptogenic zone (EZ) in focal cortical dysplasia.6 In this study, with simultaneously acquired PET images (2.0 × 2.0 × 2.0 mm3) and high-resolution multimodal MRSI (2.0 × 3.0 × 3.0 mm3), we observed FDG uptake and NAA alterations in the brain regions corresponding to EZ, PZ, and NIZ defined by co-localized SEEG signal, suggesting a coupled relationship between epileptogenicity and metabolic alterations.Method
Data acquisition:In this IRB approved study, six TLE patients were recruited, with demographics listed in Table 1. In addition, fourteen age-matched healthy volunteers were recruited for MRSI scans and twenty-one for PET scans. The PET and MRSI scans were performed on a PET/MR scanner (Biograph mMR; Siemens Healthcare, Erlangen, Germany) at Ruijin Hospital, Shanghai, China. The PET images were obtained at 15 minutes post a bolus injection of 18F-FDG (mean dose of 3.7 MBq/kg, 2.0 × 2.0 × 2.0 mm3, matrix size = 344 × 344, 127 slices). The MR protocols included high-resolution MRSI scans using SPICE (2.0 x 2.4 x 3.0 mm3, FOV = 240 × 240 × 72 mm3, TR/TE = 160/1.6 ms, 7 minutes) and T1-weighted MPRAGE (1.0 x 1.0 x 1.0 mm3, TR/TE = 1900/2.44 ms, matrix size = 256 × 256, 192 slices). Long-term video-SEEG monitoring was performed as part of their clinical requirement to record several of the patients’ usual seizures. The SEEG exploration was performed using intracerebral multiple-contact electrodes (Dixi Medical or Alcis), consisting of 8–16 contacts with length 2 mm, diameter 0.8 mm, spaced by 1.5 mm.
Data processing and data analysis:
Reconstruction of the MRSI spatiospectral functions was performed using a union-of-subspaces model, incorporating pre-learned spectral basis functions as described in previous publications.7-9 Then, spectral quantification was done using an improved LCModel-based algorithm that incorporated both spatial and spectral priors,10which generated metabolite maps of NAA, Cho, and Cr. The FDG uptakes (SUVRs) were obtained using intensity normalization by the cerebellar scaling of 18F-FDG PET images, to correct individual variations in global brain metabolism. Gray matter volumes were extracted from the T1-weighted MPRAGE using FreeSurfer (v7.0 package), which were subsequently normalized with the intracranial volume. To classify brain regions with different epileptogenicity, we first co-registered pre-implantation MRI and post-implantation CT, and co-localized the position of each SEEG contact with the Freesurfer atlas using EpiTools.11 As described in previous studies, SEEG contacts were labeled based on ictal activity as belonging to EZ, PZ or NIZ based on the timing and amplitude of their initial ictal discharge using the epileptogenicity index (EI),12 which were confirmed by an experienced neurosurgeon. Z-scores of gray matter volume, NAA/Cr, NAA/(Cho+Cr) and SUVR were calculated for each subject in comparison with the control group. The Mann-Whitney U tests were used to compare metabolic changes in brain regions across different epileptogenicity.
Results and Discussion
High-resolution T1w, NAA/Cr, NAA/(Cho+Cr), and PET-SUVR of patient #4 (MR identifiable hippocampal sclerosis) are shown in Fig. 1, where the reduction of NAA and low FDG uptake can be found in the left hippocampus and temporal lobe. For the same patient, co-localization of SEEG electrode with brain regions and the typical SEEG signal around the time of seizure onset are illustrated in Fig. 2. In all patients, the brain regions corresponding to EZ are mostly in the hippocampus, amygdala and temporal lobe. Decreased NAA/Cr and NAA/(Cho+Cr) ratios were found in those regions as compared to controls (P < 0.05 and P < 0.01, respectively). FDG uptake correlated with NAA/(Cho+Cr) (P < 0.01). Across the brain regions corresponding to NIZ, PZ, and EZ, gray matter volume did not show difference. We observed a gradual trend of decreasing NAA/Cr and NAA/(Cho+Cr) as well as PET-SUVR from NIZ to PZ and EZ (Fig. 3). The metabolic differences between NIZ and EZ were the most significant, while PZ and EZ were not. Though with limited sample size, no significant correlations were found between seizure frequency and metabolic alterations in EZ or PZ. The relationship found between FDG alterations and SEEG epileptogenicity is consistent with previous study.5 In addition, NAA changes in these patients are in general agreement with the findings from previous studies.3Conclusions
We have performed simultaneous high-resolution 1H-MRSI and 18F-FDG-PET in TLE patients to investigate brain metabolic alterations associated with different epileptogenicity. Our experimental results showed tissue FDG hypometabolism and decreased NAA in SEEG diagnosed EZ and PZ. These observations are in agreement with previous literature findings, which may lay a foundation for further investigation of tissue damage associated with epileptogenicity using high-resolution metabolic imaging.Acknowledgements
N/A.References
- Spencer DD, Gerrard JL, Zaveri HP. The roles of surgery and technology in understanding focal epilepsy and its comorbidities. Lancet Neurol. 2018;17(4):373-382.
- Zijlmans M, Zweiphenning W, van Klink N. Changing concepts in presurgical assessment for epilepsy surgery. Nat Rev Neurol. 2019;15:594-606.
- Bernhardt BC, Kim H, Bernasconi N. Patterns of subregional mesiotemporal disease progression in temporal lobe epilepsy. Neurology. 2013;81(21): 1840–1847.
- Kirov II , Kuzniecky R , Hetherington HP, et al. Whole brain neuronal abnormalities in focal quantified with proton MR spectroscopy. Epilepsy Res. 2017;139:85.
- Tenney JR, Rozhkov L, Horn P, Miles L, Miles MV. Cerebral glucose hypometabolism is associated with mitochondrial dysfunction in patients with intractable epilepsy and cortical dysplasia. Epilepsia. 2014;55(9):1415-1422.
- Lagarde S, Boucekine M, Mcgonigal A, et al. Relationship between PET metabolism and SEEG epileptogenicity in focal lesional epilepsy. Eur J Nucl Med Mol Imaging. 2020;47(8). 47(13):3130-3142.
- Lam F, Liang ZP. A subspace approach to high-resolution spectroscopic imaging. Magn Reson Med. 2014;71(4):1349-1357.
- Lam F, Ma C, Clifford B, Johnson CL, Liang ZP. High-resolution 1H-MRSI of the brain using SPICE: Data acquisition and image reconstruction. Magn Reson Med. 2016;76(4):1059-1070.
- Ma C, Lam F, Johnson C L, et al. Removal of Nuisance Signals from Limited and Sparse 1H MRSI Data Using a Union-of-Subspaces Model. Magn Reson Med. 2016;75(2):488-497.
- Li Y, Lam F, Clifford B, et al. A subspace approach to spectral quantification for MR spectroscopic imaging. IEEE Trans Biomed Eng. 2017;64(10):2486-2489.
- Villalon S M, Paz R, Roehri N, et al. EpiTools, A software suite for presurgical brain mapping in epilepsy: Intracerebral EEG. J Neurosci Methods. 2018;303:7-15.
- Fabrice, Bartolomei, Patrick, et al. Epileptogenicity of brain structures in human temporal lobe epilepsy: a quantified study from intracerebral EEG. Brain. 2008;131(Pt 7):1818-30.
Figures

Table 1. Patient Demographics.
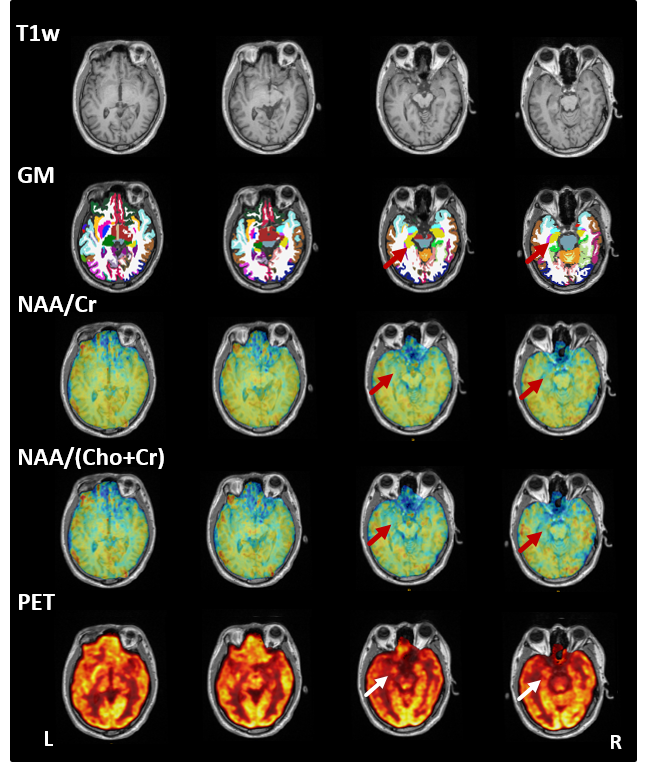
Figure 1. The high-resolution multimodal imaging of patient #4 (TLE with EZ in left hippocampus), including T1w-MPRAGE, parcellations of gray matter, NAA/Cr, NAA/(Cho+Cr), and PET-SUVR maps.
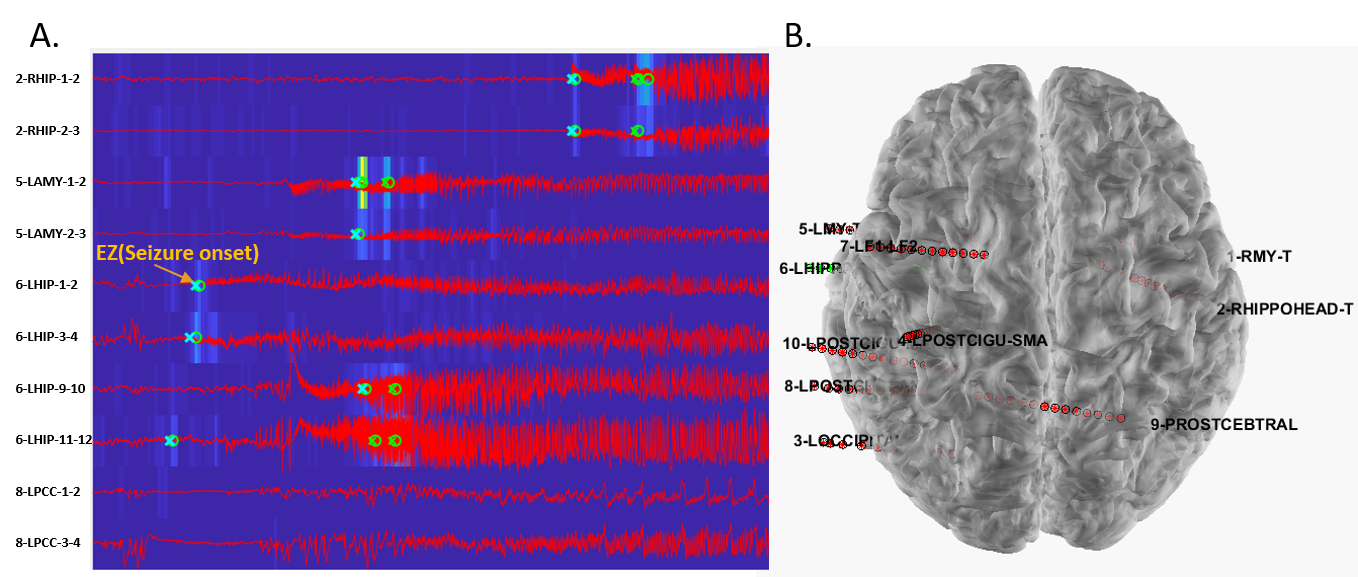
Figure 2. SEEG recordings from patient #4 with TLE arising from left hippocampus.
(A) Examples of ictal discharges around the time of seizure onset; (B) Location
of the SEEG electrodes shown on the 3D brain image.
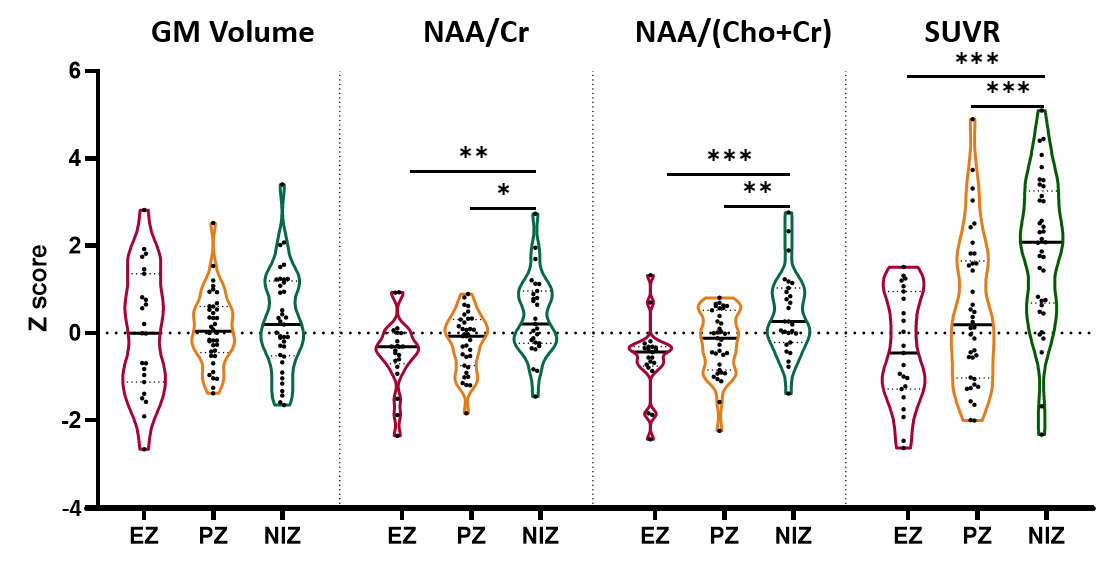
Figure 3. Statistical comparison(Mann-Whitney U tests) of gray matter volume change, NAA/Cr, NAA/(Cho+Cr)
and SUVR in the regions that contains EZ/PZ/NIZ. * P < 0.05, ** P <
0.01, *** P < 0.001.