0033
Stiffness and Fluidity of Hepatic Fibrosis Elucidated by In Vivo Multifrequency MR Elastography1Radiology, Charité - Universitätsmedizin Berlin, Berlin, Germany, 2Gastroenterology, Charité - Universitätsmedizin Berlin, Berlin, Germany
Synopsis
We aimed to investigate the solid-fluid behavior of hepatic fibrosis and cirrhosis using multifrequency MR elastography. Despite the success of stiffness-based assessment of hepatic fibrosis, little is known about tissue’s solid-fluid behavior upon fibrosis. Although cirrhosis is associated with liver stiffening and, intuitively, transition towards more rigid material properties, the observed increases in fluidity and slope of shear-wave-speed-dispersion indicate abnormally high mechanical friction in cirrhotic livers. This biophysical signature might provide a prognostic imaging marker for the detection of end-stage fibrosis independent of stiffness.
Introduction
We aimed to investigate the solid-fluid behavior of hepatic fibrosis and cirrhosis using multifrequency MR elastography (MRE). Despite the success of stiffness-based assessment of hepatic fibrosis, only a few studies have investigated the sensitivity of viscosity-related mechanical parameters to liver fibrosis using MRE.1–7 A parameter related to the tissue’s viscous behavior is the phase angle φ of the complex shear modulus1,8 which has been associated with a material’s fluidity, motivated by studies showing that it continuously ranges from 0 radians (rad) for pure solids (with storage modulus G’ > 0 and loss modulus G’’ = 0) to π/2 rad for pure fluids (G’’ > 0, G’ = 0) with π/4 rad as a threshold for the solid-fluid phase transitions.9–11 By analyzing the rotation of the Laplacian operator imposed to the complex shear modulus, φ can be quantified independently of storage and loss modulus.12Methods
This institutional review board approved study is a secondary analysis of prospectively collected data at a single institution.4 Fifteen healthy volunteers and 37 patients with chronic liver disease and biopsy-proven fibrosis were investigated by MRE on a 1.5 Tesla clinical scanner (Magnetom Aera, Siemens Healthineers, Erlangen, Germany) using six drive frequencies from 35-60 Hz as described in 10,13. Maps of shear-wave speed (SWS, in m/s) and loss angle (φ, in rad), as a surrogate marker of stiffness and fluidity, respectively, were generated using tomoelastography data processing. The image processing pipeline is publicly available at https://bioqic-apps.charite.de. The slope of SWS-dispersion (in m/s/kHz) for each subject was analyzed by fitting a linear function to spatially-averaged, frequency-resolved SWS values. Cirrhosis severity was assessed using the Child-Pugh score.Results
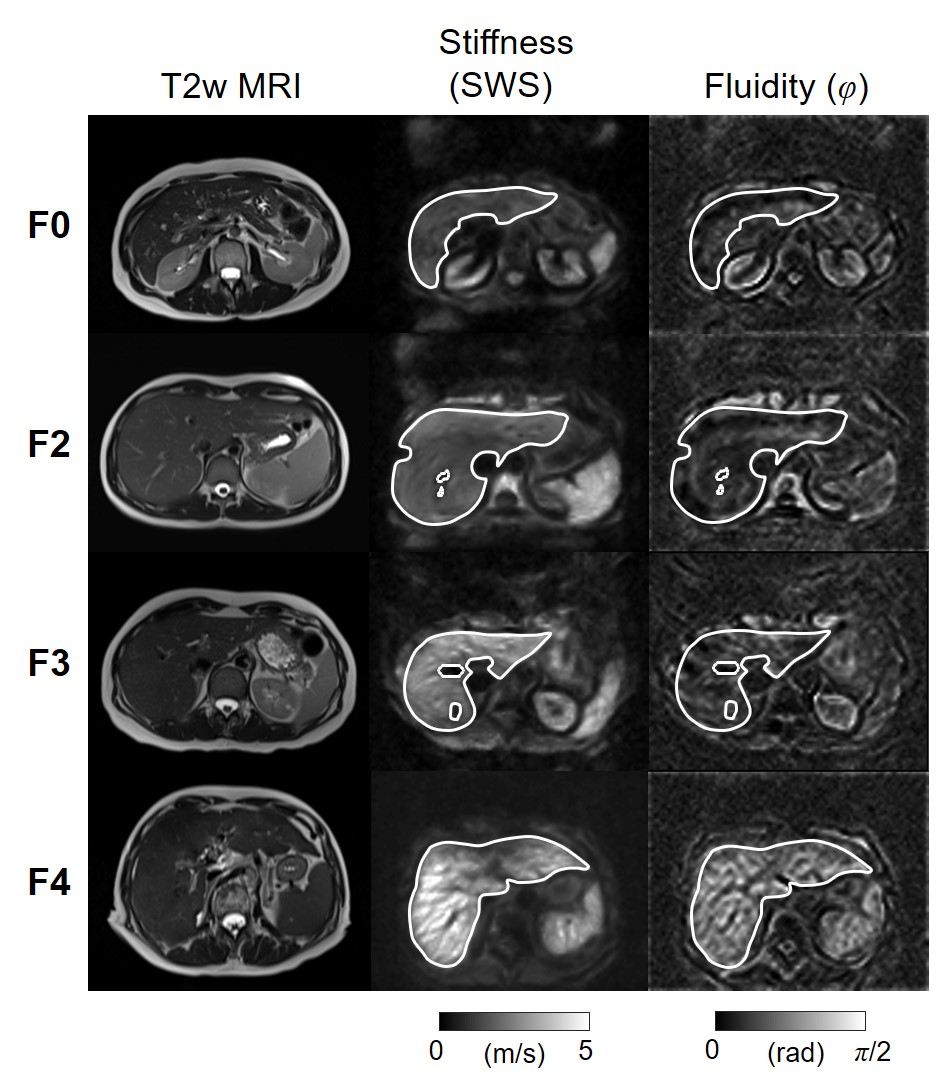
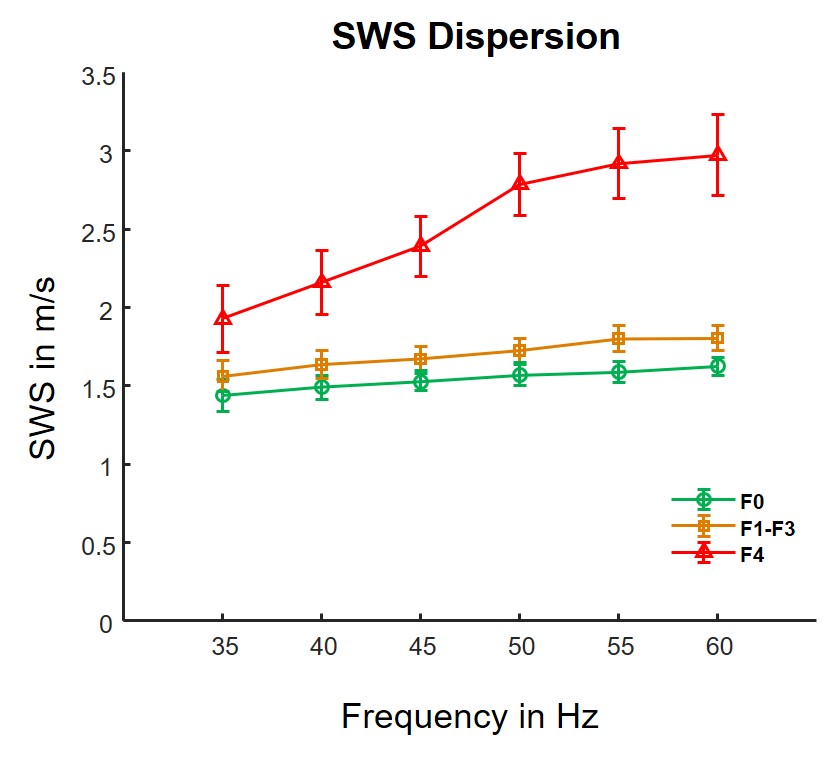
Figure 1 shows representative examples of SWS and φ maps along with anatomical T2-weighted images for different fibrosis stages. Distribution of hepatic fibrosis stages in our study population was as follows: F0: n = 15, F1: n = 10, F2: n = 4, F3: n = 6, and F4: n = 17. The mean volume of interest size was 283.6 ± 126.4 cm3. Whereas SWS continuously increased with fibrosis by 12 % from F0 to F1-3 and by 46 % from F1-3 to F4 (F0: 1.53 ± 0.11 m/s, F1-F3: 1.71 ± 0.17 m/s, F4: 2.50 ± 0.39 m/s; P < 0.001), φ remained unchanged during mild to severe fibrosis (F0: 0.63 ± 0.05 rad, F1-F3: 0.60 ± 0.05 rad; P = 0.21) but increased by 35 % in cirrhosis beyond the threshold of fluid properties of π/4 (F4: 0.81 ± 0.16 rad; P < 0.001). Correspondingly, figure 2 shows the slope of SWS-dispersion within the investigated range of vibration frequencies which increased from minor (F0-F3: 10 ± 7 m/s/kHz, P < 0.001) to pronounced (F4: 37 ± 24 m/s/kHz; P = 0.005). The slope of SWS-dispersion showed strong correlation with SWS (R = 0.69, P < 0.001) and even stronger correlation with φ (R = 0.79, P < 0.001). Significant correlation with the Child-Pugh score was found for φ (R = 0.60, P = 0.01) but not for SWS. A preliminary evaluation of diagnostic performance provided the following AUC values (95 % confidence intervals) for φ: F1, 0.56 (0.43-0.69); F2, 0.75 (0.63-0.86); F3, 0.77 (0.64-0.89); F4, 0.84 (0.70-0.96); for SWS: F1, 0.91 (0.83-0.97); F2, 0.97 (0.93-0.99); F3, 0.98 (0.95-1.00); F4, 0.99 (0.96-1.00); and for the slope of SWS-dispersion: F1, 0.79 (0.66-0.89); F2, 0.78 (0.65-0.88); F3, 0.78 (0.66-0.89); F4, 0.85 (0.72-0.95).Discussion
We investigated the solid-fluid behavior in hepatic fibrosis using tomoelastography by multifrequency MRE. Maps of tissue stiffness (SWS) and fluidity (φ) were generated to quantify viscoelastic tissue properties. Two key observations were made in this study: i) Stiffness continuously increased with fibrosis, whereas fluidity remained unchanged during mild to severe fibrosis but increased significantly beyond the threshold of fluid properties (φ > π/4) in cirrhosis. ii) Unlike stiffness, fluidity was found to be a sensitive marker for the prognostic assessment of cirrhosis using the Child-Pugh score as a reference. While fluidity was not found to have superior performance over stiffness as an individual biomarker of fibrosis, our results indicate that consideration of the full viscoelastic information provides a more detailed picture of changes in advanced liver fibrosis.Although cirrhosis is associated with liver stiffening and, intuitively, transition towards more rigid material properties, the observed increases in fluidity and slope of SWS-dispersion indicate abnormally high mechanical friction in cirrhotic livers. This biophysical signature might provide a prognostic imaging marker for the detection of end-stage fibrosis independent of stiffness.
Acknowledgements
This work was supported by the Deutsche Forschungsgemeinschaft (DFG, German Research Foundation): RE 4161/1-1, RE 4161/1-2, RE 4161/2-1 (Rolf Reiter); SFB 1340 Matrix in Vision, project number 372486779; and GRK 2260 BIOQIC.References
1. Yin M, Glaser KJ, Manduca A, et al. Distinguishing between Hepatic Inflammation and Fibrosis with MR Elastography. Radiology. 2017;284(3):694-705.
2. Reiter R, Freise C, Jöhrens K, et al. Wideband MRE and static mechanical indentation of human liver specimen: Sensitivity of viscoelastic constants to the alteration of tissue structure in hepatic fibrosis. J Biomech. 2014;47(7):1665-1674.
3. Klatt D, Asbach P, Somasundaram R, et al. Assessment of the Solid-Liquid Behavior of the Liver for the Diagnosis of Diffuse Disease Using Magnetic Resonance Elastography. RoFo. 2008;180(12):1104-1109.
4. Reiter R, Tzschätzsch H, Schwahofer F, et al. Diagnostic performance of tomoelastography of the liver and spleen for staging hepatic fibrosis. Eur Radiol. 2020;30(3):1719-1729.
5. Asbach P, Klatt D, Schlosser B, et al. Viscoelasticity-based Staging of Hepatic Fibrosis with Multifrequency MR Elastography. Radiology. 2010;257(1):80-86.
6. Sinkus R, Lambert S, Abd-Elmoniem KZ, et al. Rheological determinants for simultaneous staging of hepatic fibrosis and inflammation in patients with chronic liver disease. NMR Biomed. 2018;31(10):e3956.
7. Huwart L, Sempoux C, Salameh N, et al. Liver Fibrosis: Noninvasive Assessment with MR Elastography versus Aspartate Aminotransferase–to-Platelet Ratio Index. Radiology. 2007;245(2):458-466.
8. Hirsch S, Braun J, Sack I. Magnetic Resonance Elastography. Weinheim, Germany: Wiley-VCH Verlag GmbH & Co. KGaA; 2016.
9. Streitberger K-J, Lilaj L, Schrank F, et al. How tissue fluidity influences brain tumor progression. Proc Natl Acad Sci. 2020;117(1):128-134.
10. Shahryari M, Tzschätzsch H, Guo J, et al. Tomoelastography Distinguishes Noninvasively between Benign and Malignant Liver Lesions. Cancer Res. 2019;79(22):5704-5710.
11. Asbach P, Ro S, Aldoj N, et al. In Vivo Quantification of Water Diffusion, Stiffness, and Tissue Fluidity in Benign Prostatic Hyperplasia and Prostate Cancer. Invest Radiol. 2020;55(8):524-530.
12. Papazoglou S, Hirsch S, Braun J, et al. Multifrequency inversion in magnetic resonance elastography. Phys Med Biol. 2012;57(8):2329-2346.
13. Dittmann F, Tzschätzsch H, Hirsch S, et al. Tomoelastography of the abdomen: Tissue mechanical properties of the liver, spleen, kidney, and pancreas from single MR elastography scans at different hydration states. Magn Reson Med. 2017;78(3):976-983.
Figures