0032
Quantification of in-vivo myocardial stiffness in the rat heart using transient mechanical waves
Anna Sophie Wittgenstein1, Marco Barbero Mota2, Giacomo Annio2, Guillaume Rucher2, Rachida Aid-Launais2, Rami Mustapha3, David Alexander Nordsletten1,4, and Ralph Sinkus1,2
1School of Biomedical Engineering and Imaging Sciences, King's College London, London, United Kingdom, 2INSERM-Université de Paris, Paris, France, 3chool of Cancer and Pharmaceutical Sciences, King's College London, London, United Kingdom, 4Department of Biomedical Engineering and Cardiac Surgery, University of Michigan, Ann Habor, MI, United States
1School of Biomedical Engineering and Imaging Sciences, King's College London, London, United Kingdom, 2INSERM-Université de Paris, Paris, France, 3chool of Cancer and Pharmaceutical Sciences, King's College London, London, United Kingdom, 4Department of Biomedical Engineering and Cardiac Surgery, University of Michigan, Ann Habor, MI, United States
Synopsis
In vivo assessment of biomechanical properties in the left ventricle carries substantial promises for disease characterization. Its proper quantification, however, is far from straightforward. We propose an ECG-gated 3D CINE GRE sequence with motion encoding gradients (TR=7ms) and time-shifted mechanical excitation to quantify the propagation of transient shear waves at a temporal resolution of 0.7ms. In-vivo results in anesthetised rats show apparent shear waves speeds around 8m/s at mid diastole, compatible with recent human in-vivo data.
Introduction
Magnetic Resonance Elastography (MRE) is a non-invasive medical imaging modality that generates quantitative maps of stiffness properties of soft tissue (e.g. liver, brain, breast), primarily used to detect fibrosis and characterize tumour mechanics. While some extensions of MRE to the heart have been published [1],[2],[3],[4],[5] widespread use has been limited largely due to the physiological buffering isolating the heart from surrounding organs and tissues, and challenges regarding the proper quantification of biomechanics using stationary shear waves in a thin and stiff structure such as the septum. To simplify the step from shear waves to mechanical properties we therefore propose the usage of a short transient wave pulse that exhibits a distinct directionality and does not suffer from reflections. Wave guidance effects will lead to geometrically induced dispersion effects that need to – but can easily - be taken properly into account. Recent human data revealed shear wave speeds of ~5m/s at frequencies around 200Hz for the time of aortic valve closure in healthy volunteers. Here, using a 7T preclinical MRI system, we investigate the possibility to track the spatio-temporal propagation of an externally generated shear wave (200Hz, one single period) through the septum of an anesthetized rat during mid diastole (100ms after the beginning of the R-R cycle).Methods
A 3D printed custom-build setup allows to generate a mechanical push via a piston located just underneath the thorax of the rat (Fig.1B). An ECG+respiratory gated 3D GRE Flash cardiac CINE sequence (TE=3.5, TR=7ms) was rendered motion sensitive via a bipolar gradient (1ms length, 150mT/m strength) with 20 movie frames covering the cardiac cycle of the rat. The external 200Hz mechanical excitation was delayed by 100ms relative to the beginning of the R-R cycle to probe the septum during mid diastole (Fig.1A) . To enhance the otherwise limited temporal resolution of 7ms (i.e. one TR), image acquisition was repeated 10x times with the 200Hz push delayed each time by an accumulative delay of 7ms/10=0.7ms (Fig.2) [6]. Importantly, image acquisition remained temporarily locked to the beginning of the R-R cycle to ensure fidelity of space with respect to the cardiac cycle. Retrospective re-ordering of the data allowed to investigate the transient propagation of the shear wave. Image resolution was 1x1x1.5mm3 with an effective data acquisition time of approximately 20mins. Experiments in an US-gel sample were performed to test the ability to thereby track at high temporal resolution the propagation of shear waves and to recover correct values for wave speed (Fig 3). Subsequently, three rats were used to demonstrate the feasibility of the proposed method in-vivo. Wave propagation was quantified via waterfall diagrams showing the temporal phase evolution along a predefined line. Hence, the slope of the perturbation within the waterfall diagram yields the apparent wave speed.Results
Figure 4 shows the wave propagating through the gel (A,B) and the waterfall diagram (C) along the line drawn in A. The known speed within the gel of ~1m/s is properly recovered. Figure 5 shows three slices through the cardiac cycle -early systole, early diastole and end of diastole.with a predefined line on the MRI magnitude image (red) at the beginning of diastole as well as the corresponding waterfall diagram for a selected rat. We find a propagation speed of ~2.5m/s in the tissue before the thorax (space-time 0 to 1), matching expectations at a frequency of 200Hz. From the waterfall diagram it is obvious that the wave experiences a significant acceleration within the septum, reaching values around ~8m/s (space-time 2 to 3) with currently a significant error of 3m/s. This error can be greatly reduced by increasing the temporal resolution of the acquisition.Despite the currently large uncertainty, it is obvious that propagation is not compatible with shear wave speeds around 2m/s = 2mm/ms.Conclusion
We have developed an ECG+Respiratory gated 3D CINE Flash MRE sequence that is capable to capture transient waves at very high temporal resolution. The current resolution of 0.7ms can easily be increased to 0.175ms by sampling less slices (4 instead of 8) and doubling the data acquisition time to approximately 40mins. In-vitro experiments show that the approach yields correct wave speeds in gauged materials. The in-vivo application to the rat heart shows exciting initial results: first, we are able to track the propagation of the transient wave within the septum; second, we clearly observe very high wave speeds during mid diastole compatible with recent human in-vivo data. Those speeds clearly indicate levels of stiffness well beyond 2kPa measured with other approaches. The current methodology allows to actually sample several punches throughout the cardiac cycle whereby enabling a simple way to quantify changes in biomechanics during systole and diastole, without prolongation of data acquisition time. The advantage of this approach lies in its simplicity: due to the transient nature of the wave and its predefined direction of propagation, we do not deal with wave reflections and thus there is not necessity to solve for a 3D wave equation. The only limit is to properly consider geometrically induced dispersion which can be dealt with easily via computational modelling. The next step is to quantify biomechanics over the entire cardiac cycle and study a cardiac infarct model.Acknowledgements
No acknowledgement found.References
[1] Arani A, Arunachalam SP, Chang ICY, Baffour F, Rossman PJ, Glaser KJ, Trzasko JD, McGee KP, Manduca A, Grogan M, Dispenzieri A, Ehman RL, Araoz PA. Cardiac MR elastography for quantitative assessment of elevated myocardial stiffness in cardiac amyloidosis. J Magn Reson Imaging. 2017 Nov;46(5):1361-1367. doi: 10.1002/jmri.25678. Epub 2017 Feb 25. PMID: 28236336; PMCID: PMC5572539.[2] Robert B, Sinkus R, Gennisson J, Fink M. Application of DENSE-MR-elastography to the human heart. Magn Reson Med. 2009; 62(5):1155–1163. [PubMed: 19780150]
[3] Arani A, Glaser KL, Arunachalam SP, et al. In-vivo, high-frequency three-dimensional cardiac MR elastography: Feasibility in normal volunteers. Magn Reson Med. 2016
[4] Elgeti T, Tzschaetzsch H, Hirsch S, et al. Vibration-synchronized magnetic resonance imaging for the detection of myocardial elasticity changes. Magn Reson Med. 2012; 67(4):919–924. [PubMed: 22294295] [5] Elgeti T, Beling M, Hamm B, Braun J, Sack I. Cardiac magnetic resonance elastography toward the diagnosis of abnormal myocardial relaxation. Invest Radiol. 2010; 45(12):782–787. [PubMed: 20829709] [6] Troelstra M, Runge J, Burnhope E, Polcaro A, Guenthner C, Schneider T et al. Shear wave cardiovascular MR elastography using intrinsic cardiac motion for transducer-free non-invasive evaluation of myocardial shear wave velocity. Nature Scientific Reports. 2020 Nov 30
Figures
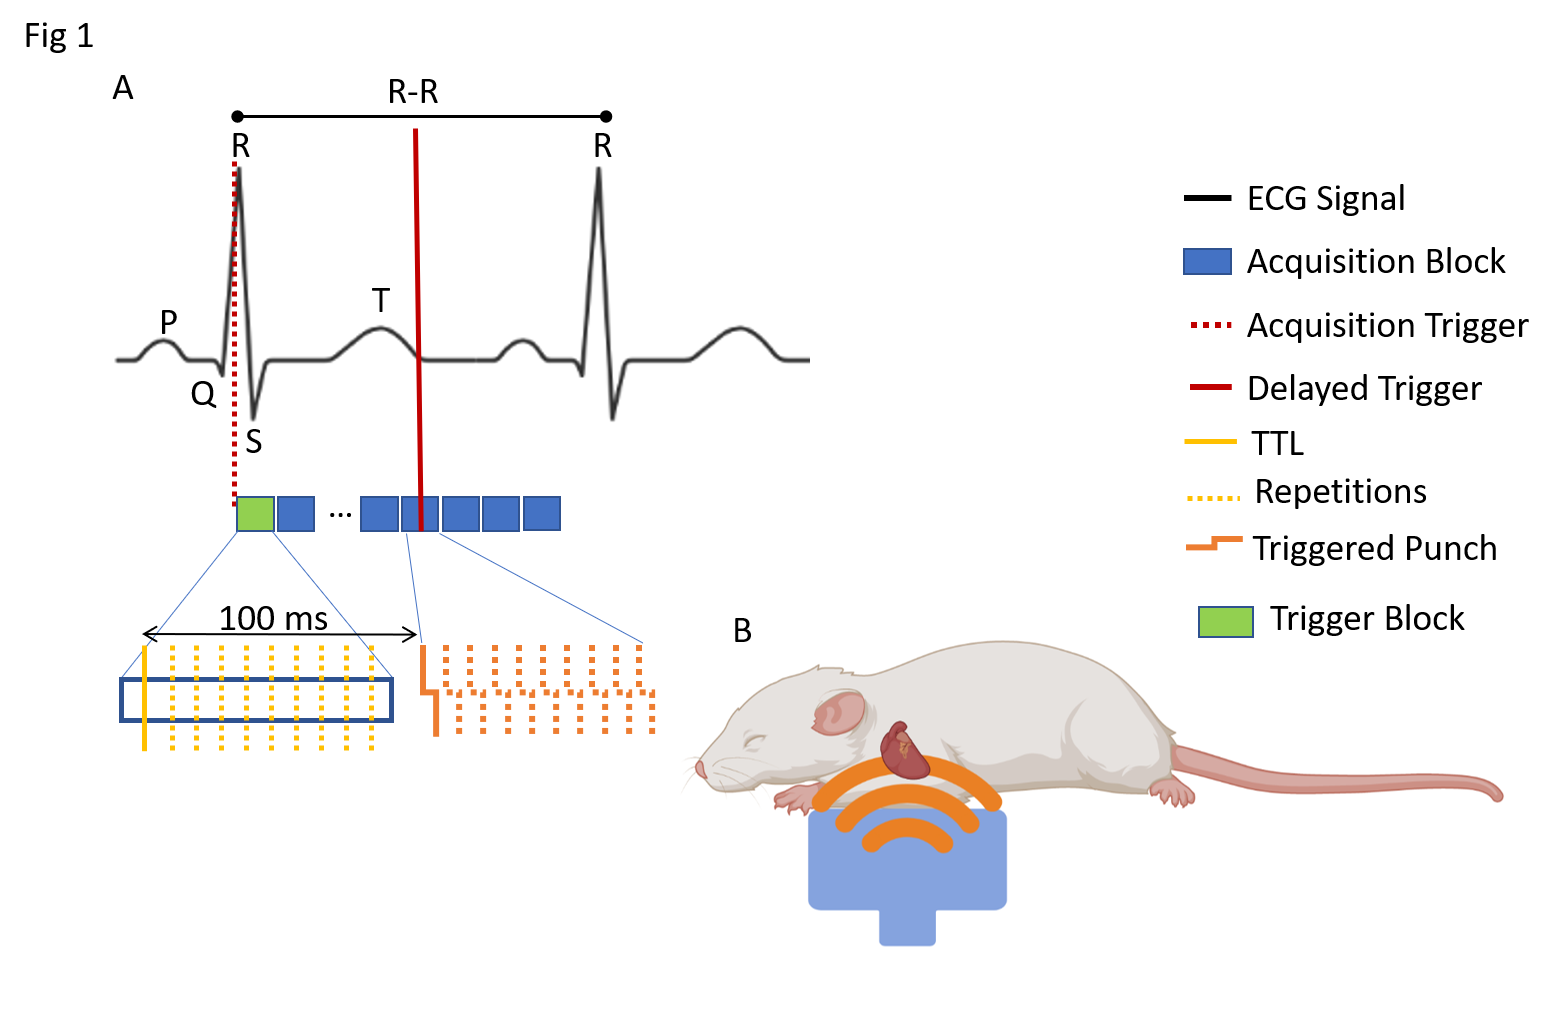
Figure 1: TTL: Transistor-transistor logic trigger; A) ECG+respiratory gated acquisition. Delaying 100 ms each mechanical push (200 Hz) trigger with respect to R spike (TTL) ensures consistent diastolic acquisition. 10 acquisition repetitions with an increment of 0.7 ms delays among them artificially lower temporal resolution to 0.7 ms. B) Diagram of the anesthetized rat and how thoracic excitation is executed for generation of internal shear waves that travel towards and through the heart.
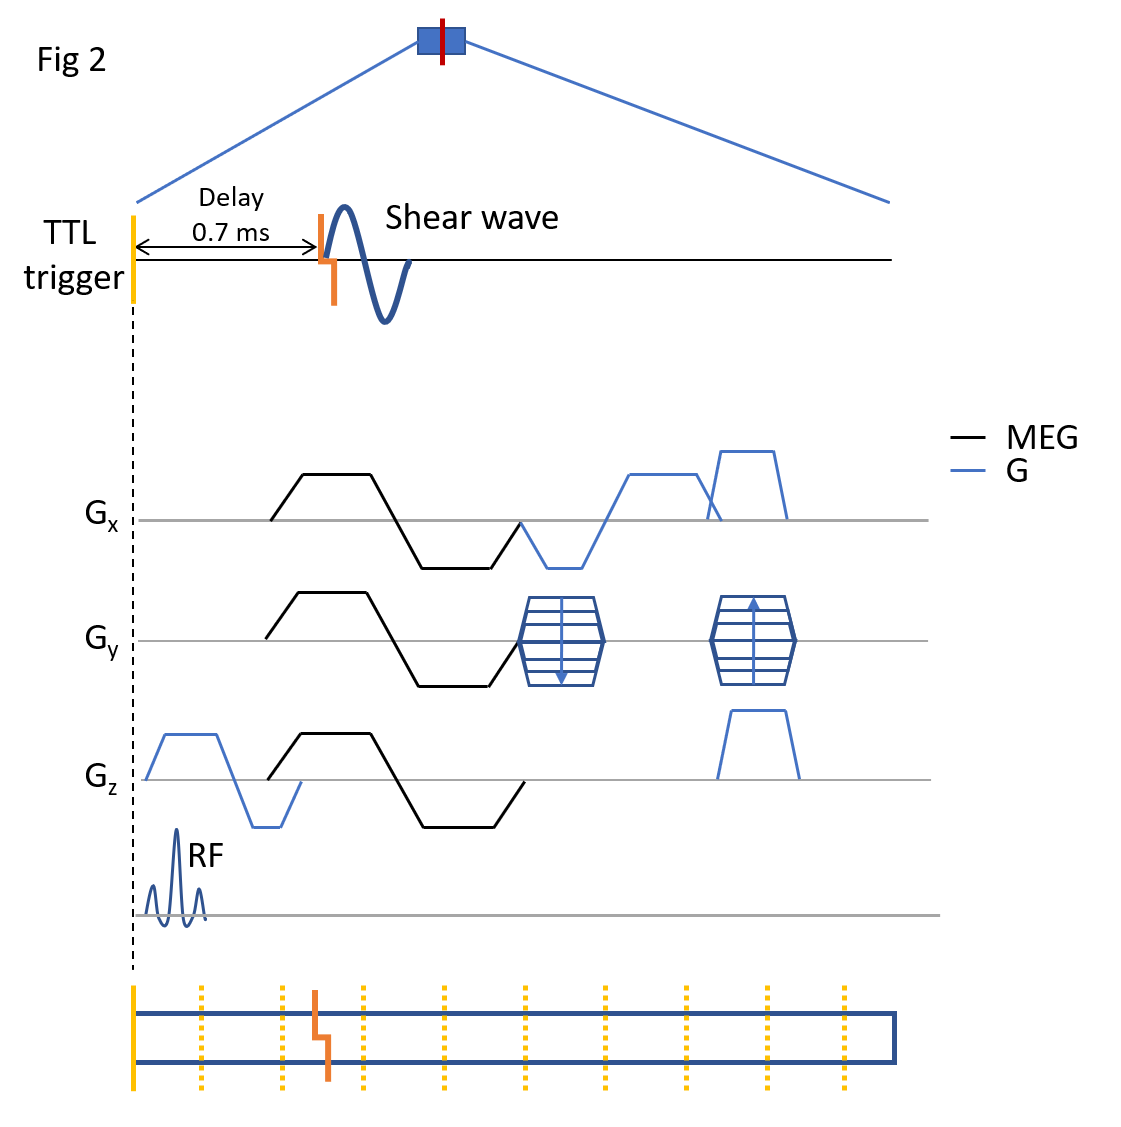
Figure 2: Detailed diagram of the presented MRE sequence individual acquisition block and the delayed trigger for the punch. The imaging information is encoded through spatial and motion encoding gradients in x,y and z as shown. The red line represents mechanical punch (200 Hz). Refer to legend figure 1 for repeated elements.
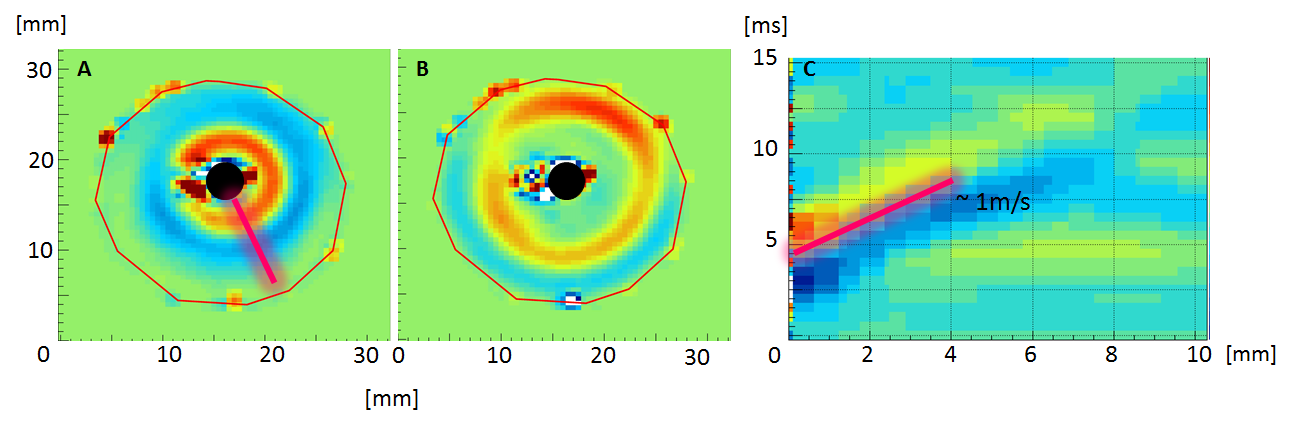
Figure 3: Example of a wave propagating through a gel phantom and the respective waterfall diagram (A) Wave location shortly after triggering the wave at the centre (black circle). (B) wave has propagated further into the gel away from trigger location (black circle). (C) Waterfall diagram – time plotted over distance- showing the wave speed of approximately 1m/s.
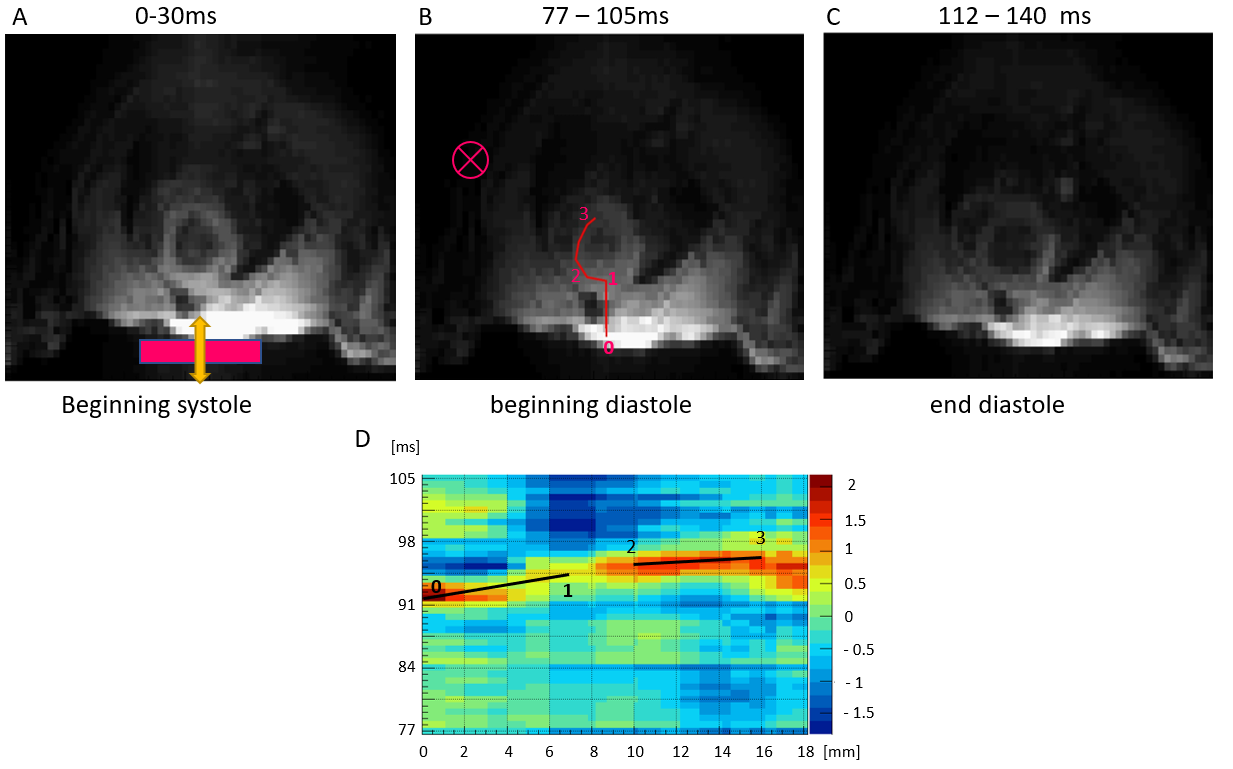
Figure 4: Magnitude images with a resolution of 1x1mm and the waterfall diagram along the indicated path (pink) (A) The location of the transducer underneath the torso is indicated by the block and the direction of vibration by the arrow in the magnitude image.(B) Magnitude image at the start of diastole with the wave plane through slices (pink cross) and the path for the waterfall-diagram (C) Magnitude image of the rats’ shape of the heart at end diastole, showing the left and right ventricle. (D) Waterfall-diagram, showing the travelled distance over time along the path indicated in B.