0031
Regional Brain Mechanical Properties Throughout Maturation from Childhood to Adulthood1Biomedical Engineering, University of Delaware, Newark, DE, United States, 2Department of Linguistics, University of Delaware, Newark, DE, United States, 3Department of Psychology, University of Delaware, Newark, DE, United States, 4Thayer School of Engineering, Dartmouth College, Hanover, NH, United States
Synopsis
Brain mechanical properties are markers of microstructural health and have been extensively studied in neurodegeneration using MR elastography. However, brain mechanical changes during maturation have yet to be comprehensively explored. Here we present preliminary findings from an ongoing study which uses OSCILLATE, a fast acquisition, high-resolution sequence to characterize brain mechanical properties in people ages 5-21. We present notable regional brain mechanical property differences during development and aim to categorize brain mechanical property developmental trajectories in major anatomical structures. This data will provide a platform for brain mechanical property comparison when studying atypical maturation.
Introduction
Magnetic resonance elastography (MRE) is a technique capable of creating sensitive maps of brain viscoelastic mechanical properties1. MRE has been used extensively to study aging and neurodegeneration, and to assess individual cognitive differences in adults, but little is known about mechanical properties of the pediatric brain. We were the first to report measures of brain mechanical properties of the adolescent population and observed notable regional differences compared to adults2, which were shown to reflect heightened risk-taking behavior in this population3. Here we build on that work to examine brain mechanical properties throughout brain maturation. In this work we use higher resolution imaging and a larger sample size to map average brain mechanical properties in a wide age range from childhood to adulthood.Methods
Sixty-four healthy subjects from three age groups (5-7y, N =17; 12-14y, N=24; 19-21y, N=22) were scanned on a Siemens 3T Prisma scanner with 64-channel head coil. Each subject had an OSCILLATE MRE scan4 with 50 Hz vibration, 1.5x1.5x1.5 mm3 resolution, and 80 slices for whole brain coverage. OSCILLATE is a multiband spiral MRE sequence5 which uses low-rank image reconstruction to allow for data under-sampling. Each MRE scan took 4 minutes 29 seconds. MRE displacement data was processed through a nonlinear inversion algorithm (NLI)6 to solve for the complex shear modulus, G, which was converted to viscoelastic shear stiffness, μ=2|G|2/(G’+|G|) and damping ratio ξ=G’’/2G’7. Each subject also had an MPRAGE scan at 0.9x0.9x0.9 mm3 resolution for region segmentation and volumetric measures using Freesurfer. Regional volume measures were normalized to intracranial volume, z-scored to allow for comparison between structures of different sizes, and a linear regression was used to normalize for group-wise age. Statistical analysis included an ANOVA to test for age dependence of properties in each region and post hoc t-tests to compare each pair of age groups.Results
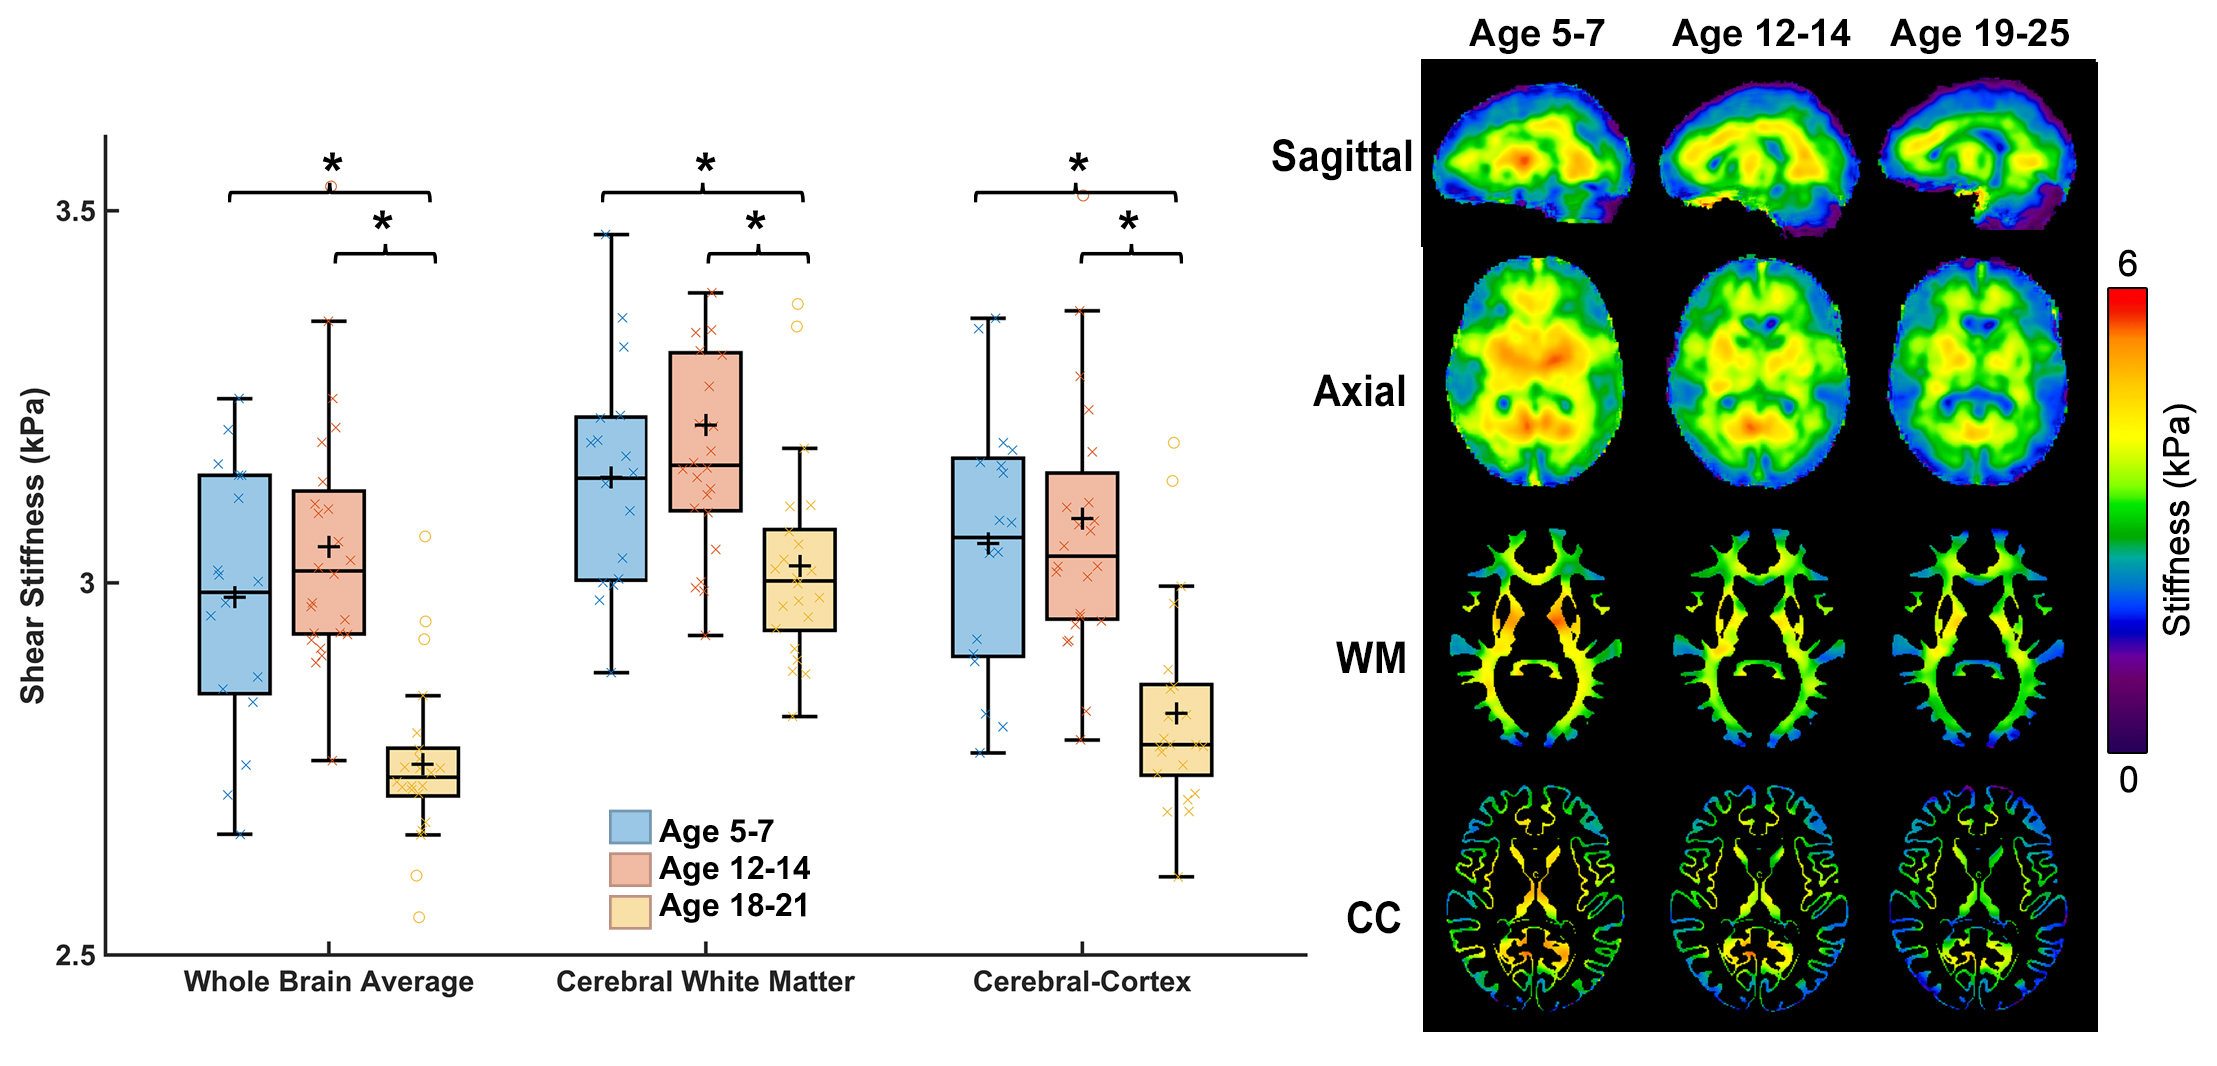
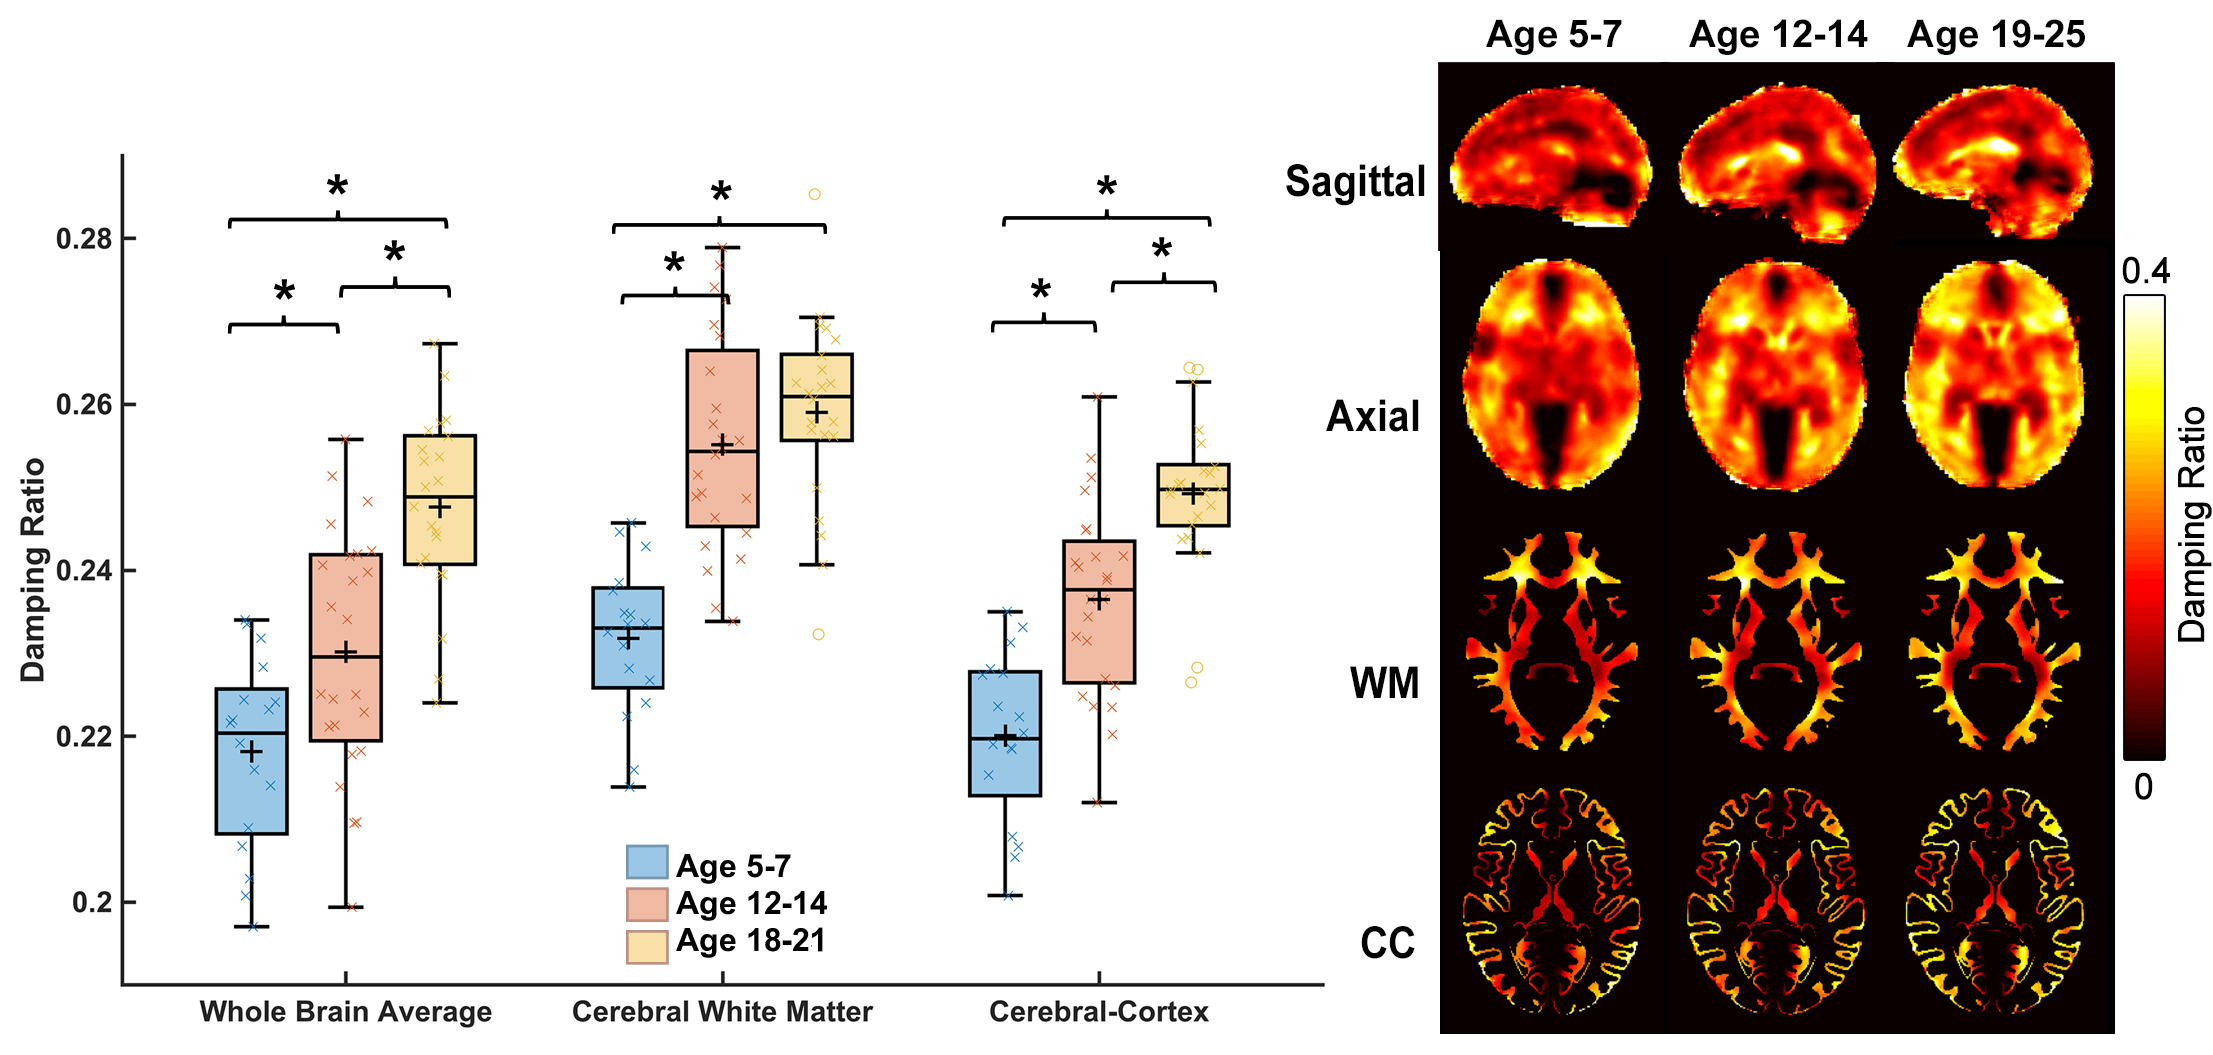
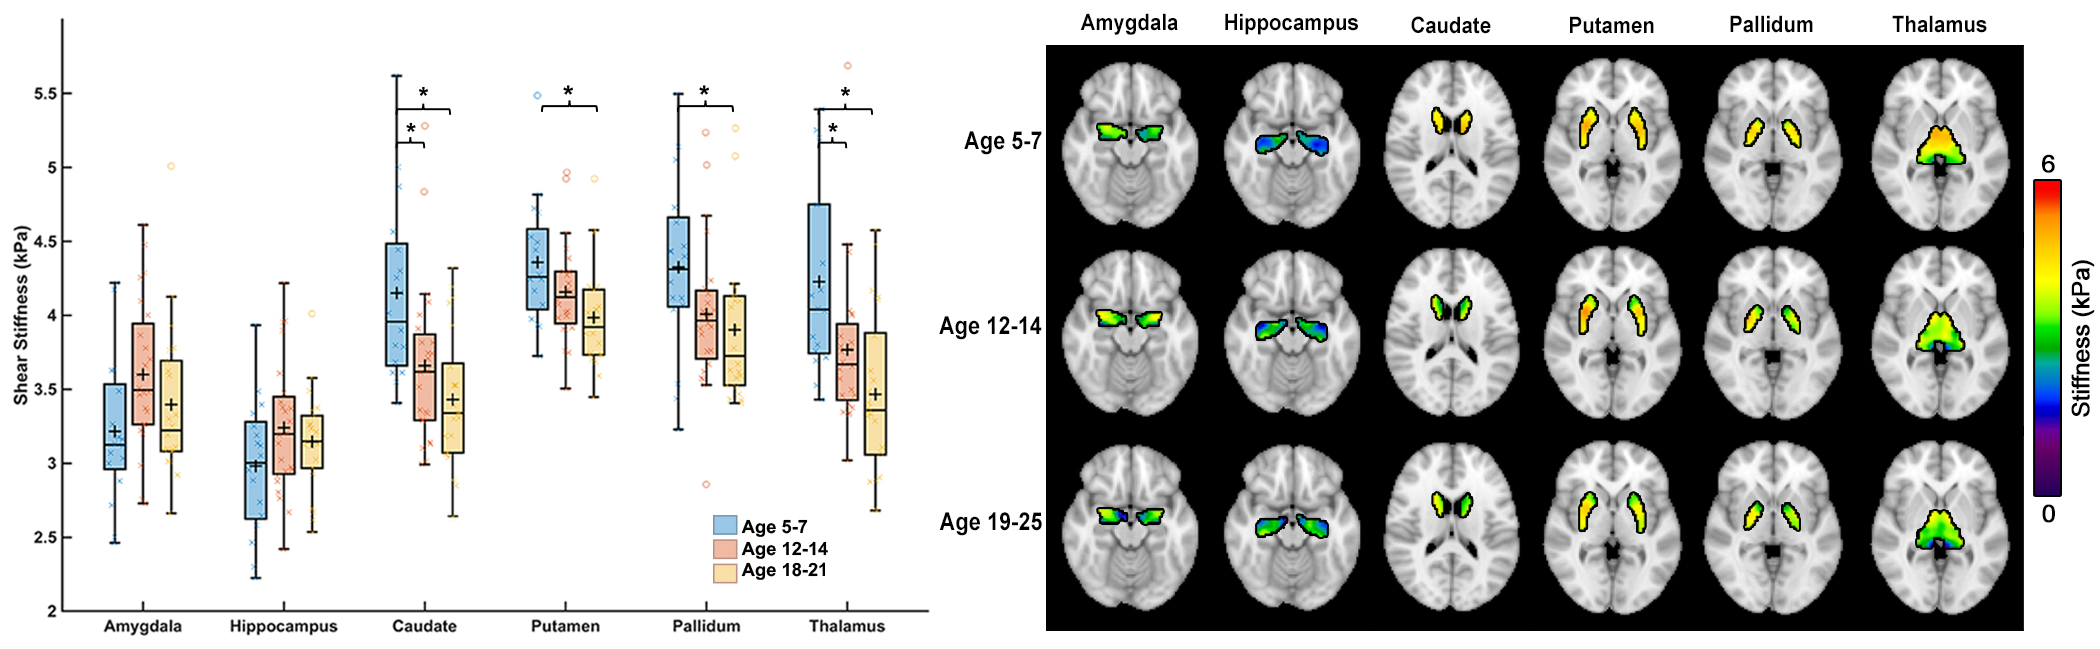
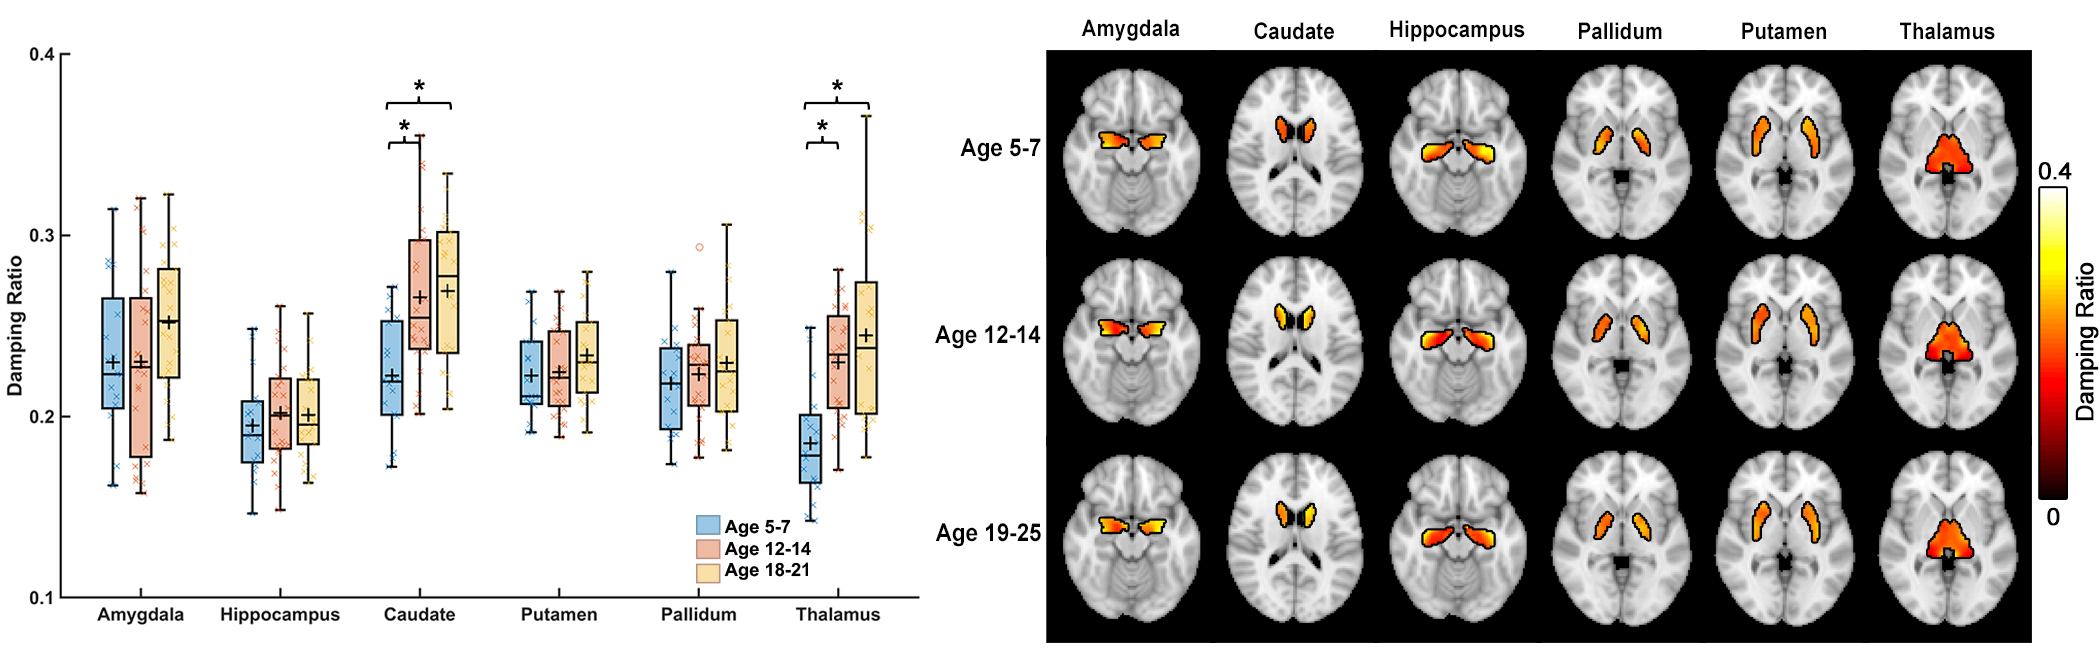
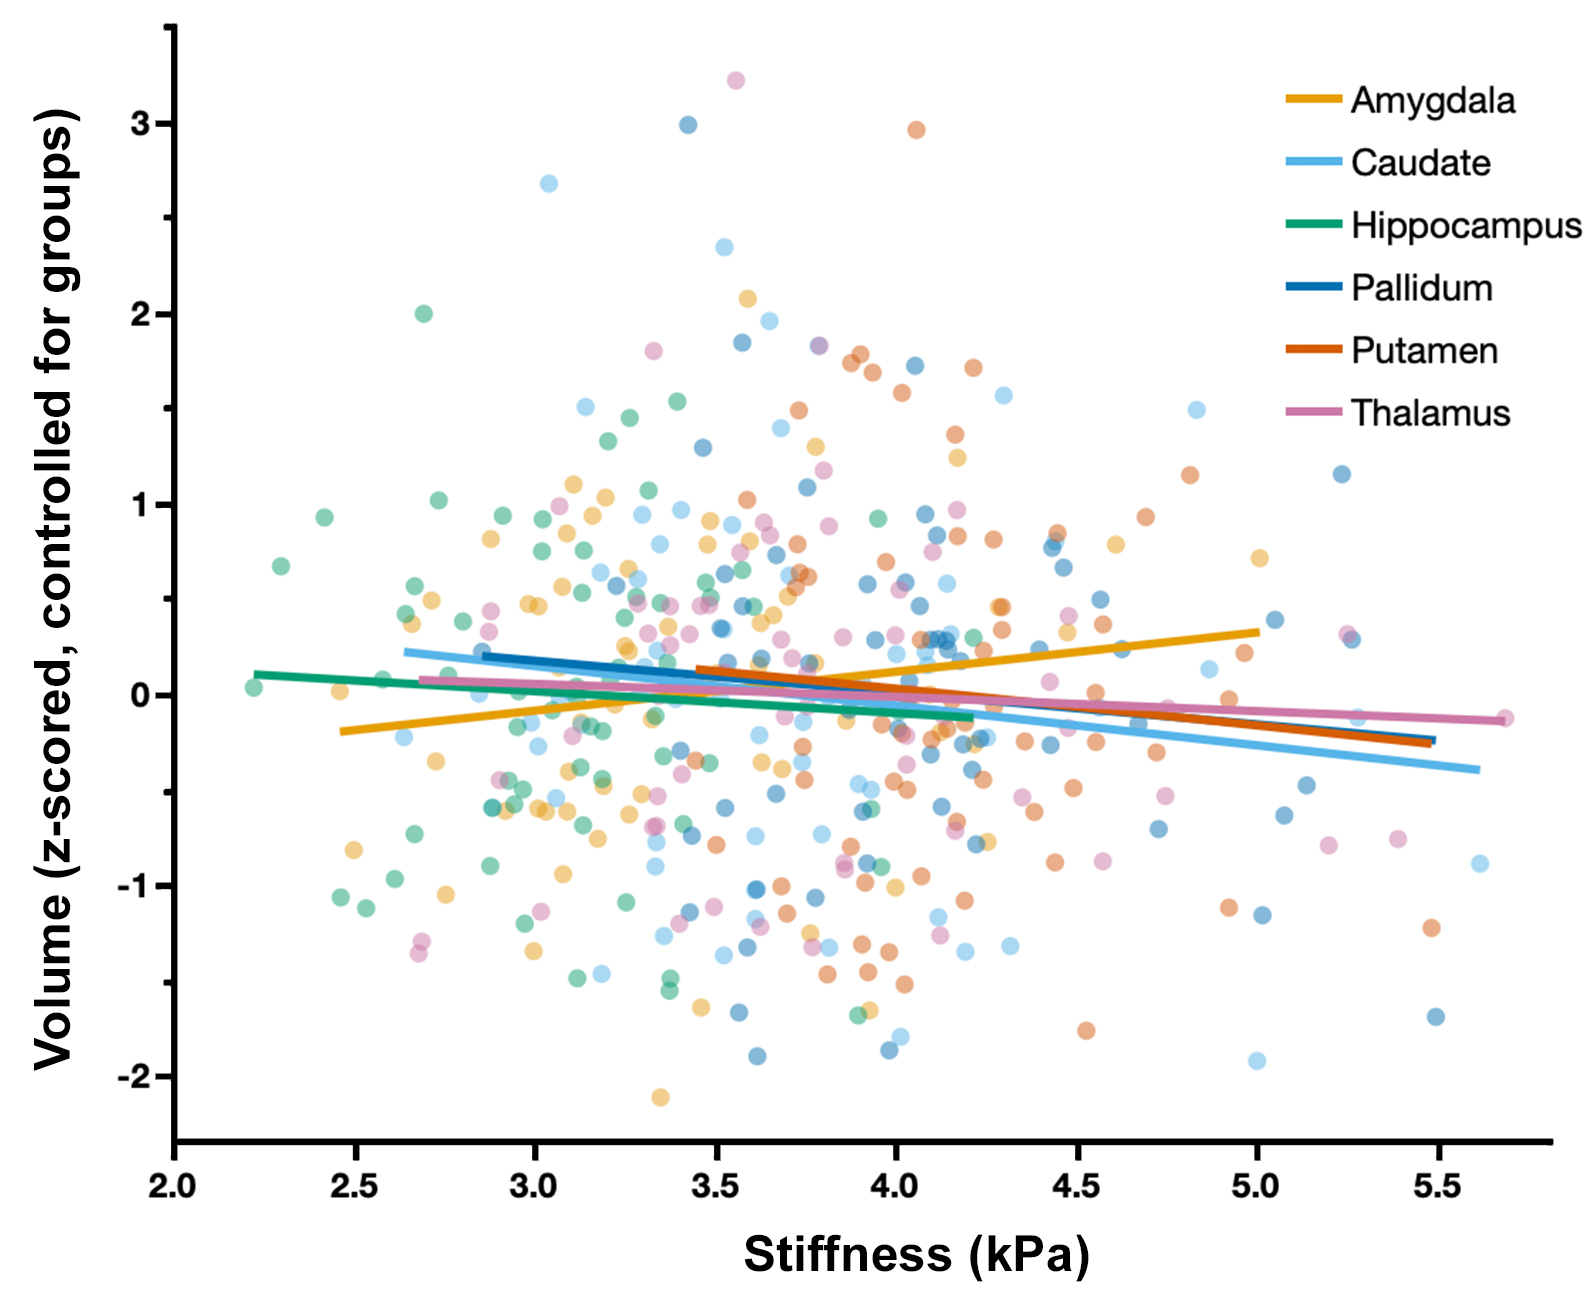
Whole-brain stiffness was significantly different in the 18-25 group compared to the two younger groups. Average stiffness decreased 7.54% between the 5-7 and 18-25 groups (3.05 vs. 2.82 kPa; p<0.001), with no difference found between the 5-7 and 12-14 age groups (3.05 vs. 3.08 kPa) (Figure 1). Whole brain damping ratio was significantly different between all three age groups (p<0.001) with an increasing trend across age and a 13.6% whole brain increase from the 5-7 to the 18-25 group (0.22 vs. 0.25 kPa; p<0.001) (Figure 2). Both the global white matter and cortical gray matter follow the same trends as the average brain for stiffness and damping ratio. In subcortical gray matter structures (SGMs), it was found that the caudate, putamen, pallidum, and thalamus exhibited significantly reduced stiffness with age, while the amygdala and hippocampus showed no significant changes but trended towards increased stiffness with age (Figure 3). The caudate and thalamus were the only structures to show significantly higher damping ratio with age (Figure 4). Volume, generally used as a marker of structural brain development, was not seen to be significantly correlated with stiffness for any of the SGMs (Figure 5).Discussion and Conclusion
The results of this work indicate that brain stiffness changes both globally and regionally during maturation from childhood to adulthood. Damping ratio, a measure of tissue organization, was also found to significantly change during maturation globally, with increases between all three age groups. These findings are in contrast to previous null whole brain mechanical property findings from Yeung, et al,8 and to a recent animal study showing a maturation-driven increase in stiffness9. This discrepancy may have resulted from improved methods including higher resolution and faster acquisition times. Notably, we find that mechanical properties change regionally during maturation. Of the four SGMs that decrease in stiffness with age, all are components of brain networks important for procedural learning and locomotion regulation, while the hippocampus and amygdala of the medial temporal lobe show no decrease or potentially even an increase in stiffness with age, and are critical in emotional regulation, decision making, and memory formation. The differential change in mechanical properties may reflect how these functions mature. These SGMs findings agree with our previous work2 which also reported differences in mechanical properties of the caudate and the putamen and showed similar trends in stiffness of the medial temporal lobe, however that work did not assess children under the age of 12. Group averaged property maps further show a pronunciation of white matter tract properties during maturation, which is supported by literature that white matter tracts increase in density and fractional anisotropy during maturation10. Regional mechanical property maturational differences are supported through histology in a recent murine MRE study9, which showed that specific structural protein up- and down-regulation during development are reflected through mechanical property measurements. Interestingly, there was a lack of significant correlations between SGM stiffness and volume, even though volume is known to change across this age range11,12, demonstrating that mechanical properties are a distinct measure of brain structural development. We present measures of maturational brain mechanical properties that will allow for the compilation of a comprehensive set of standardized, high resolution, brain mechanical property maps for prominent time points during development, and can be important to inform future studies investigating the neural basis of neurodevelopmental disorders13.Acknowledgements
F31-HD103361, NIH R01-EB027577, U01-NS112120, NIH/NIA R01-AG058853, NSF SBE SPRF-FR #1911462, Delaware Neuroscience COBRE (P20-GM103653), and Delaware INBRE (P20-GM103446).References
1. Hiscox L V, Johnson CL, Barnhill E, et al. Magnetic resonance elastography (MRE) of the human brain: technique, findings and clinical applications. Phys Med Biol. 2016;61:R401. doi:10.1088/0031-9155/61/24/R401
2. McIlvain G, Schwarb H, Cohen NJ, Telzer EH, Johnson CL. Mechanical properties of the in vivo adolescent human brain. Dev Cogn Neurosci. 2018;34. doi:10.1016/j.dcn.2018.06.001
3. McIlvain G, Clements RG, Magoon EM, Spielberg JM, Telzer EH, Johnson CL. Viscoelasticity of reward and control systems in adolescent risk taking. Neuroimage. 2020;215(February):116850. doi:10.1016/j.neuroimage.2020.116850
4. McIlvain G, Cerjanic AM, Christodoulou AG, McGarry MD, Johnson CL. OSCILLATE: A Low-Rank Approach for Accelerated Magnetic Resonance Elastography. In: 28th Annual Meeting of the International Society for Magnetic Resonance in Medicine. ; 2020.
5. Johnson CL, Holtrop JL, Anderson AT, Sutton BP. Brain MR Elastography with Multiband Excitation and Nonlinear Motion-Induced Phase Error Correction. In: 24th Annual Meeting of the Interational Society for Magnetic Resonance in Medicine, Singapore. ; 2016:p 1951.
6. McGarry MDJ, Houten EEW Van, Johnson CL, et al. Multiresolution MR elastography using nonlinear inversion. Med Phys. 2012;39(6388):6388-6396. doi:10.1118/1.4754649
7. McGarry MDJ, Van Houten EEW. Use of a Rayleigh damping model in elastography. Med Biol Eng Comput. 2008;46(8):759-766. doi:10.1007/s11517-008-0356-5
8. Yeung J, Jugé L, Hatt A, Bilston LE. Paediatric brain tissue properties measured with magnetic resonance elastography. Biomech Model Mechanobiol. 2019;(0123456789). doi:10.1007/s10237-019-01157-x
9. Guo J, Bertalan G, Meierhofer D, et al. Brain maturation is associated with increasing tissue stiffness and decreasing tissue fluidity. Acta Biomater. 2019;99:433-442. doi:10.1016/j.actbio.2019.08.036
10. Barnea-Goraly N, Menon V, Eckert M, et al. White matter development during childhood and adolescence: A cross-sectional diffusion tensor imaging study. Cereb Cortex. 2005;15(12):1848-1854. doi:10.1093/cercor/bhi062
11. Raznahan A, Shaw PW, Lerch JP, et al. Longitudinal four-dimensional mapping of subcortical anatomy in human development. Proc Natl Acad Sci. 2014;111(4):1592-1597. doi:10.1073/pnas.1316911111
12. Walhovd KB, Fjell AM, Reinvang I, et al. Effects of age on volumes of cortex, white matter and subcortical structures. Neurobiol Aging. 2005;26(9):1261-1270. doi:10.1016/j.neurobiolaging.2005.05.020
13. Johnson CL, Telzer EH. Magnetic resonance elastography for examining developmental changes in the mechanical properties of the brain. Dev Cogn Neurosci. 2018;33:176-181. doi:10.1016/j.dcn.2017.08.010
Figures