0029
Respiratory Motion-Resolved Free-Breathing MR Elastography Of Liver1Radiology, Mayo Clinic, Rochester, MN, United States
Synopsis
A free-breathing hybrid radial-cartesian 3D MRE technique (TURBINE-MRE) was developed for MR elastography of the liver. This technique provides motion-resolved wave images and stiffness maps in single 4-minute free breathing acquisition. The feasibility of the new technique was demonstrated in healthy volunteers and a NASH patient with hepatic cirrhosis.
Introduction
MR Elastography (MRE) has been widely used for assessing liver diseases by quantitatively measuring the mechanical properties of the liver in vivo [1]. Liver MRE is typically performed with breath-holds to reduce motion artifacts. While well tolerated by most adult patients, imaging during suspended respiration is difficult in young pediatric patients and in adults who are unable to breath-hold. While uncommon, some MRE exams may exhibit errors in stiffness estimation due to inconsistent breath-holds [2]. A 2D-radial-GRE technique has been adapted for free-breathing liver MRE [3], though it was limited to only one slice and a single motion state. Recently, we developed a 3D, hybrid radial-cartesian, EPI acquisition for MRE (designated here as TURBINE-MRE) and demonstrated high encoding efficiency and full 3D coverage in the brain [4, 5]. In this study, we adapted the TURBINE-MRE to achieve respiratory motion-resolved free-breathing (FB) MRE for the liver using a multidimensional golden-angle radial sparse-sampling framework (XD-GRASP) [6]. To date, we have demonstrated the feasibility of the technique in volunteer studies, which has now prompted initiation of clinical testing.Methods
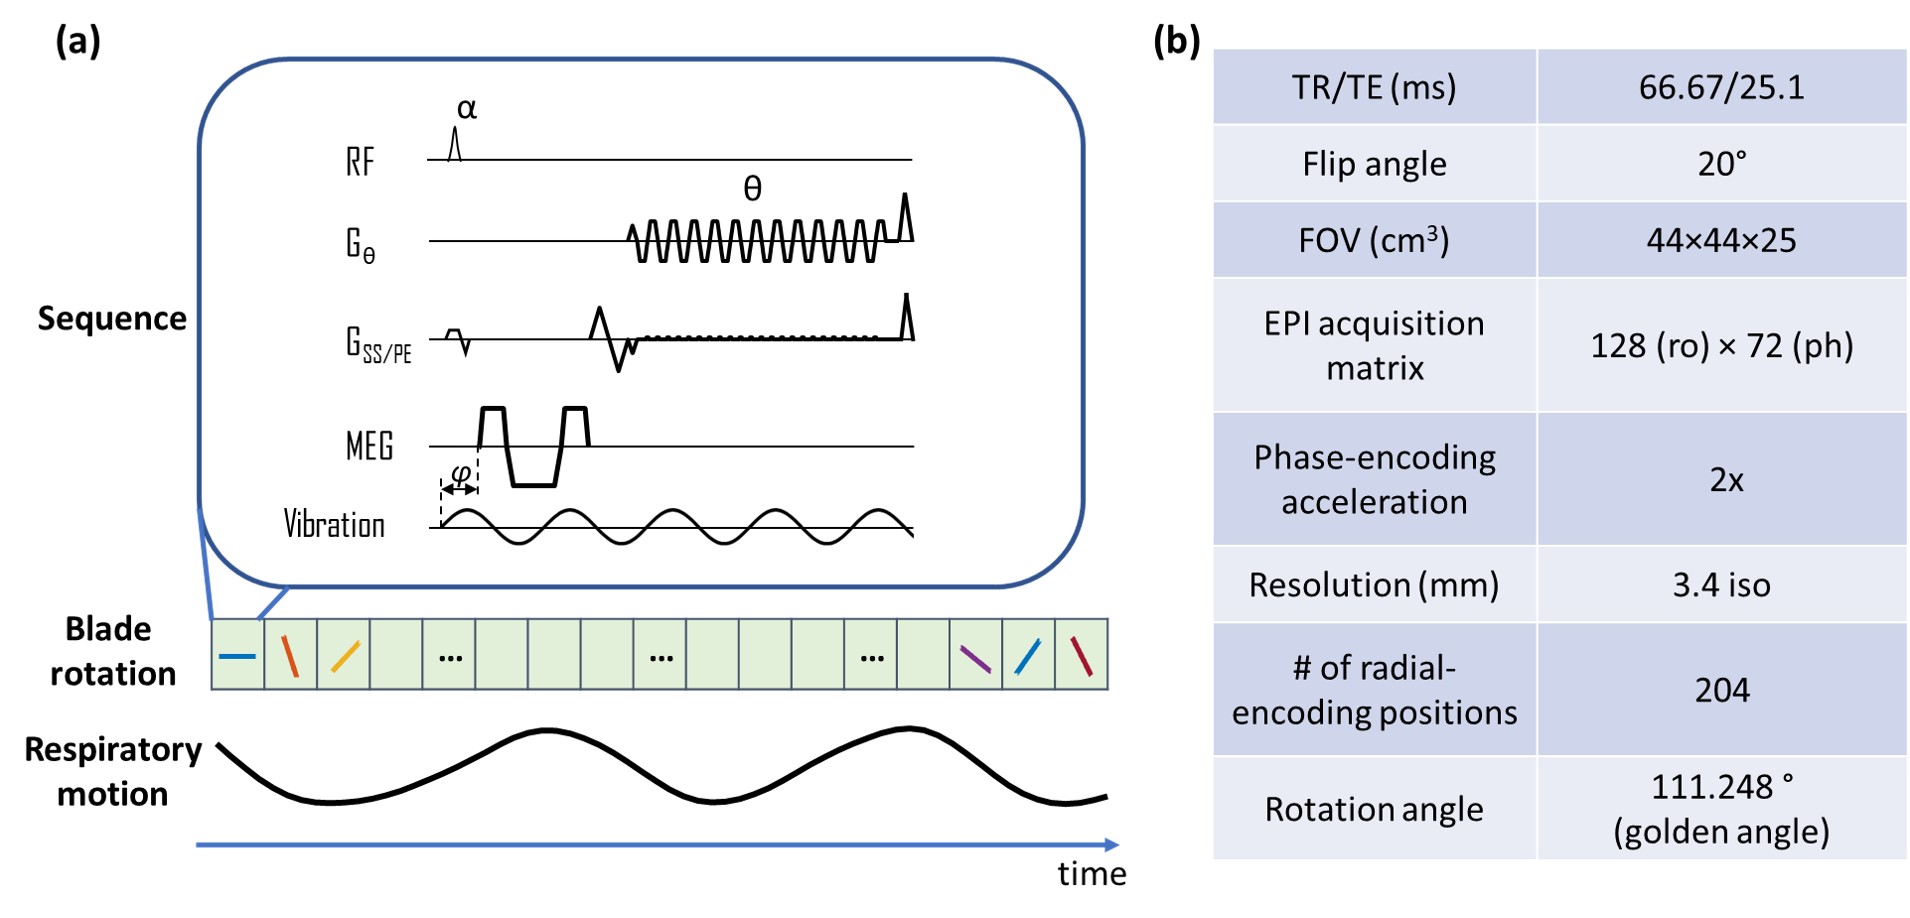
Pulse sequence:The TURBINE-MRE sequence, as described in Figure 1a, was executed continuously with the subject freely breathing. The imaging parameters are shown in Figure 1b. With IRB approval and informed consent, 2 healthy volunteers and 1 NASH (nonalcoholic steatohepatitis) patient with hepatic cirrhosis were scanned on a GE 1.5T scanner (Optima MR 450w) with a 32-channel coil, 60-Hz external vibrations, an 11.8-ms, 33-mT/m MEG (36.9 µm/π-radians encoding efficiency), 6 motion-encoding directions, 3 time-offsets and 4:18 minutes scan time.
Image Reconstruction:
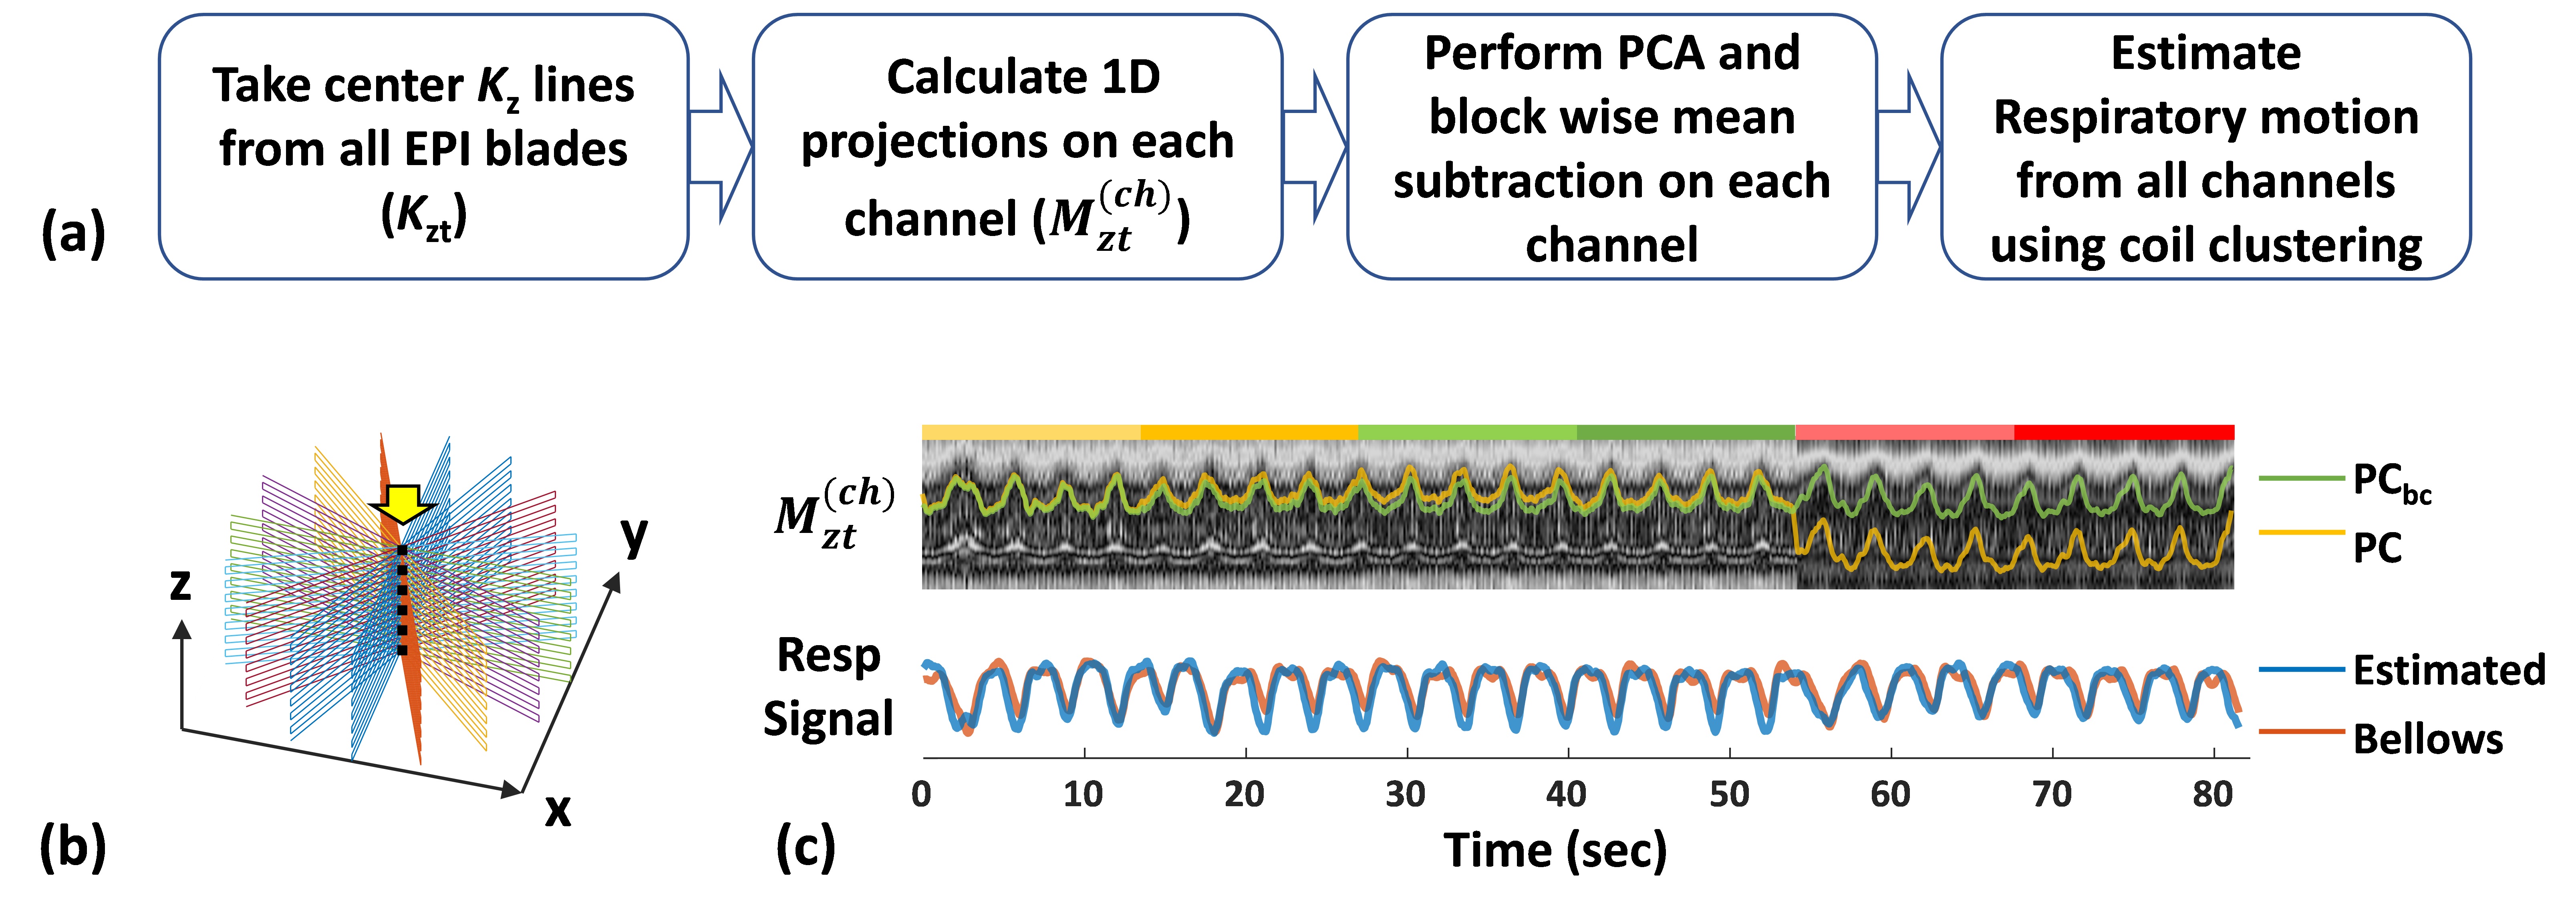
1) Respiratory motion estimation: As summarized in Figure 2a, the center Kz lines (dashed line in Fig. 2b) were first taken out from all EPI blades and concatenated along the time dimension (Kzt). Z-projections Mzt were then computed by taking a 1D Fourier transform of Kzt along z. For each channel (coil), the two largest principal components (PCs) of Mzt were calculated using principal component analysis (PCA). Because MEG’s concomitant fields can cause a PC baseline difference on each MEG direction, a block-wise mean subtraction was performed on the PCs. Finally, after 1D smoothing, the baseline-corrected PCs (PCbc) from all coil channels were used to estimate the respiratory motion using a coil-clustering method [7]
2) Sparse reconstruction: After EPI phase-correction, the EPI blades of each MRE repetition were sorted into 5 respiratory states. Then, the XD-GRASP type reconstruction was performed by solving the following optimization problem.
$$x=arg\min_{x}‖E ⋅C⋅x-g‖_2^2+λ_1 ‖S⋅x‖_1$$
Where E is the TURBINE trajectory encoding operator using NUFFT [8] for radial sampling and FFT for z-direction Cartesian sampling, C is coil sensitivity map estimated from a separate calibration scan, x is the 4D image series with the respiratory motion at the last dimension, and g is the multicoil k-space data. In this study, the temporal finite difference along the respiratory (4th) dimension was chosen for the sparsifying transform S, and λ1 is the regularization parameter. The reconstruction was done in Matlab with the adapted open source code from [9].
3) MRE reconstruction: MRE stiffness maps were generated by adaptively taking the curl of the 3D displacement fields and performing a 3D direct inversion (DI) algorithm to invert the wave-field as described in the previous study [10, 11].
Results
Figure 2c shows an example of the respiratory motion estimated from the patient scan k-space data (blue), which is consistent with the recorded respiratory bellows signal (orange).The animation in Figure 3 shows the TURBINE-MRE results from one healthy volunteer in both coronal and axial views. The motion-resolved MRE magnitude images, curl wave images, and stiffness maps are looping through the respiratory cycle. It is interesting to notice that the wave pattern in the liver keeps relatively steady (not moving up and down) during the respiratory motion. This is because the wave speed in the liver is much faster than the respiratory motion speed, and the vibration source (the passive driver) is typically secured over the rib cage and does not move much along the SI direction.
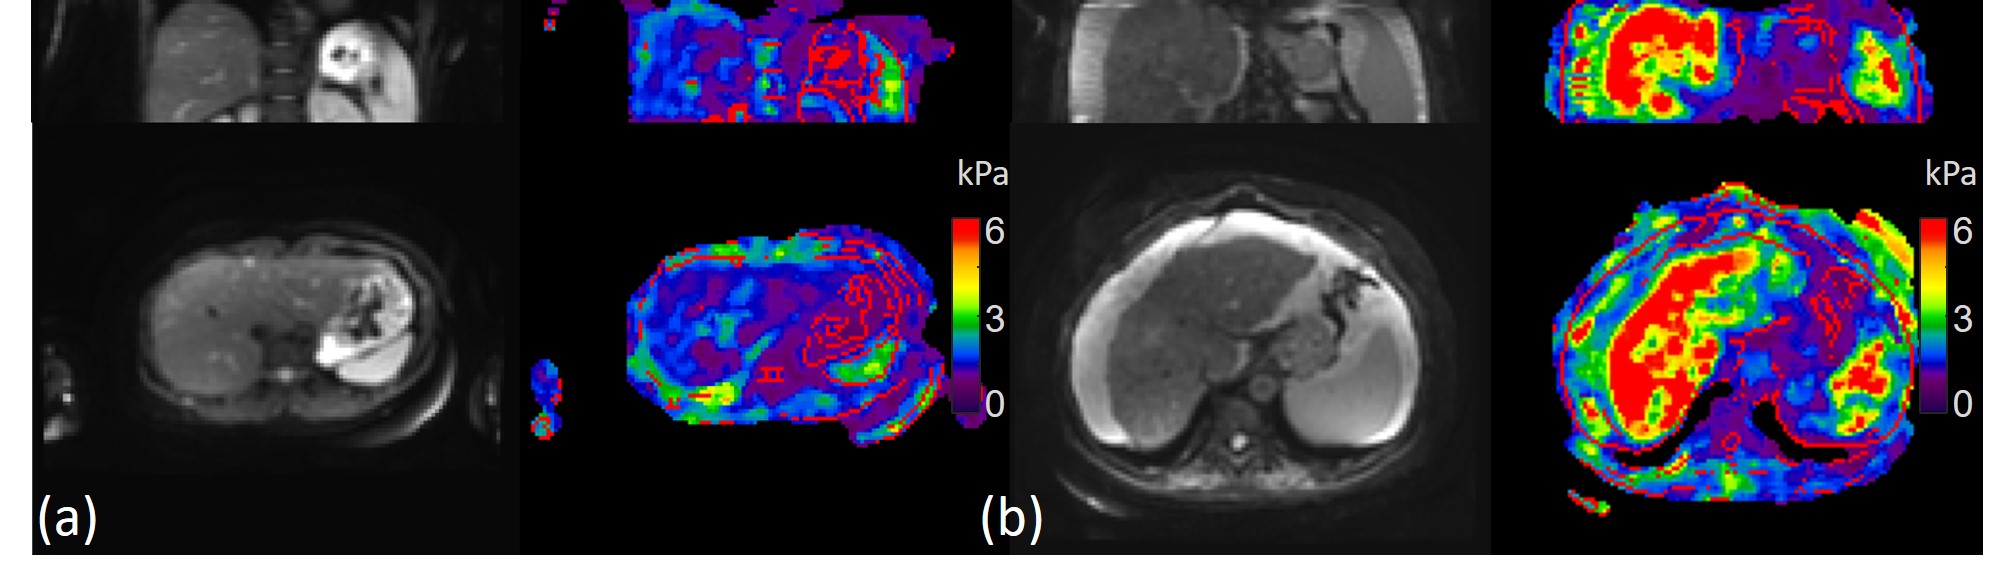
The animation in Figure 4 shows the TURBINE-MRE results from the NASH patient with hepatic cirrhosis and ascites. The high values (red) shown in the stiffness maps indicate a very stiff liver due to the disease.
Compared with the standard 2D-EPI-MRE results with 32 slices in 6 breath-holds (Figure 5), the FB TURBINE-MRE demonstrate comparable wave images and stiffness maps, as well as the advantage of larger imaging volume to cover the whole liver in larger patients.
Discussion and Conclusion
In this study, we have demonstrated the feasibility of the free-breathing TURBINE-MRE sequence on healthy volunteers and a patient. The sequence has several advantages over the conventional 2D SE-EPI-MRE technique, including being a free-breathing acquisition, having a larger volume of coverage, and being robust to respiratory motion. It has great potential to improve MRE repeatability and improve patient comfort by eliminating the need for breath-holds. This technique can also efficiently measure tissue stiffness at multiple respiratory stages in one scan, allowing for exploration of viscoelastic nonlinearity, a promising biomarker for characterizing histopathologic processes in organs such as the liver, spleen, pancreas, and kidneys [12].Acknowledgements
This work was supported by grants from the NIH (R01 EB001981, R01 NS113760, and R01 EB017197)References
1. Venkatesh, S.K., M. Yin, and R.L. Ehman, Magnetic resonance elastography of liver: technique, analysis, and clinical applications. J Magn Reson Imaging, 2013. 37(3): p. 544-55.
2. Murphy, I.G., et al., Comparison of breath-hold, respiratory navigated and free-breathing MR elastography of the liver. Magn Reson Imaging, 2017. 37: p. 46-50.
3. Holtrop, J.L., et al. Free Breathing Radial Magnetic Resonance Elastography. in ISMRM. 2019.
4. Sui, Y., et al., TURBINE-MRE: A 3D hybrid radial-Cartesian EPI acquisition for MR elastography. Magn Reson Med, 2021. 85(2): p. 945-952.
5. Arani, A., et al. Sparse Reconstruction Strategy for Highly-Accelerated 3D TURBINE Magnetic Resonance Elastography. in ISMRM Workshop on Data Sampling & Image Reconstruction. 2020. Sedona, AZ.
6. Feng, L., et al., XD-GRASP: Golden-angle radial MRI with reconstruction of extra motion-state dimensions using compressed sensing. Magn Reson Med, 2016. 75(2): p. 775-88.
7. Zhang, T., et al., Robust Self-Navigated Body MRI Using Dense Coil Arrays. Magnetic Resonance in Medicine, 2016. 76(1): p. 197-205.
8. Fessler, J.A. and B.P. Sutton, Nonuniform fast Fourier transforms using min-max interpolation. Ieee Transactions on Signal Processing, 2003. 51(2): p. 560-574.
9. XD-GRASP Matlab Code. Available from: https://cai2r.net/resources/software/xd-grasp-matlab-code.
10. Manduca, A., et al., Magnetic resonance elastography: Non-invasive mapping of tissue elasticity. Medical Image Analysis, 2001. 5(4): p. 237-254.
11. Murphy, M.C., et al., Measuring the characteristic topography of brain stiffness with magnetic resonance elastography. PLoS One, 2013. 8(12): p. e81668.
12. Yun, M.H., et al., The effect of the respiratory cycle on liver stiffness values as measured by transient elastography. J Viral Hepat, 2011. 18(9): p. 631-6.
Figures