0021
Visualization of Post-Infarction Cardiac Tissue Remodeling at 7T using T2* contrast: Longitudinal Study in a Pig Myocardial Infarction Model1Chair of Molecular and Cellular Imaging, University Hospital Würzburg, Comprehensive Heart Failure Center, Wuerzburg, Germany, 2Department of Internal Medicine I, Cardiology, University Hospital Würzburg, Wuerzburg, Germany
Synopsis
Cardiac MRI at 7T is a developing methodology capable to increase physical sensitivity and spatial resolution of the cardiac MR-images. T2*-quantification at 7T is of particular interest because it is highly sensitive to cardiac microstructure and has the potential to improve data quality on cardiac tissue remodeling in both acute and chronic cardiac diseases compared to clinical B0-field. In this work, we present the results of a pilot study correlating the multi-slice T2*-data with late-gadolinium-enhancement and first-pass-perfusion results in the large animal model of myocardial infarction. 8 pigs measured prior and at three dates after inducing myocardial infarction are analyzed.
Introduction
MRI at 7T B0-field is a developing methodology capable to increase the physical sensitivity and spatial resolution of cardiac MR-images. Compared to clinical field strength, T2*-quantification becomes highly sensitive to the structural changes in cardiac tissue at 7T B0-field strength. It may provide valuable information on tissue remodeling in both acute and chronic cardiac diseases. In this work, we present the results of a pilot study correlating 7T cMRI T2*-measurements data with the results of (i) late-gadolinium-enhancement (LGE) imaging and (ii) first-pass myocardial perfusion measurements in a pig model of chronic myocardial infarction.Materials and Methods
In total n=8 pigs (German Landrace) were used with the approval of the local Animal Welfare Committee. Myocardial infarction (MI) was induced by occluding the left anterior descending coronary artery with a balloon catheter, followed by subsequent reperfusion after 90 minutes. All measurements were done using a Magnetom™ “Terra” 7T MR-scanner (Siemens, Erlangen, Germany) using three custom-designed 8Tx/16Rx cardiac array coils each adopted for specific animal weight range [1]. Each animal was scanned 7 days before induction of MI and at days 3, 14, and 58 after the operation (referred to as “pre-MI”, and MI-1,2,3 scans respectively). T2*-measurements were performed using a cardiac triggered by an acoustic system (EasyACT, MRI.Tools) mGRE-sequence with 9 TE-times distributed in the range [1.1..14.6]ms, and using an in-plane pixel size of 2.2x2.5mm. A contiguous stack of 10-13 slices with 6mm thickness was acquired in short-axis heart view orientation. The volume for B0-shimming volume was set to fit the visible heart dimensions on each measured slice [2]. Myocardial perfusion was visualized using the first-pass methodology and both low dose (~0.016mmol/kg bw) and high dose (~0.1mmol/kg bw) gadolinium DOTA (“Gadovist”) injection. Two slices per heartbeat were measured within healthy and infarcted myocardium zones using a spatial resolution of 0.95x1.4x6mm. The LGE stack was acquired using an IR-GRE sequence with TE/TI=1.9/400ms and voxel size=1.2x2x6mm. The previously acquired CINE stack was used for both T2* and LGE stack planning. The analysis of images was done using in-house developed Matlab scripts (Mathworks, Natick, USA) and MEDIS software (Medis Imaging, Leiden). Two methods of T2* analysis were compared: (i) manual ROI selection and (ii) “blind” evaluation based on the automatic splitting of LV myocardium on segments according to the AHA-scheme.Results
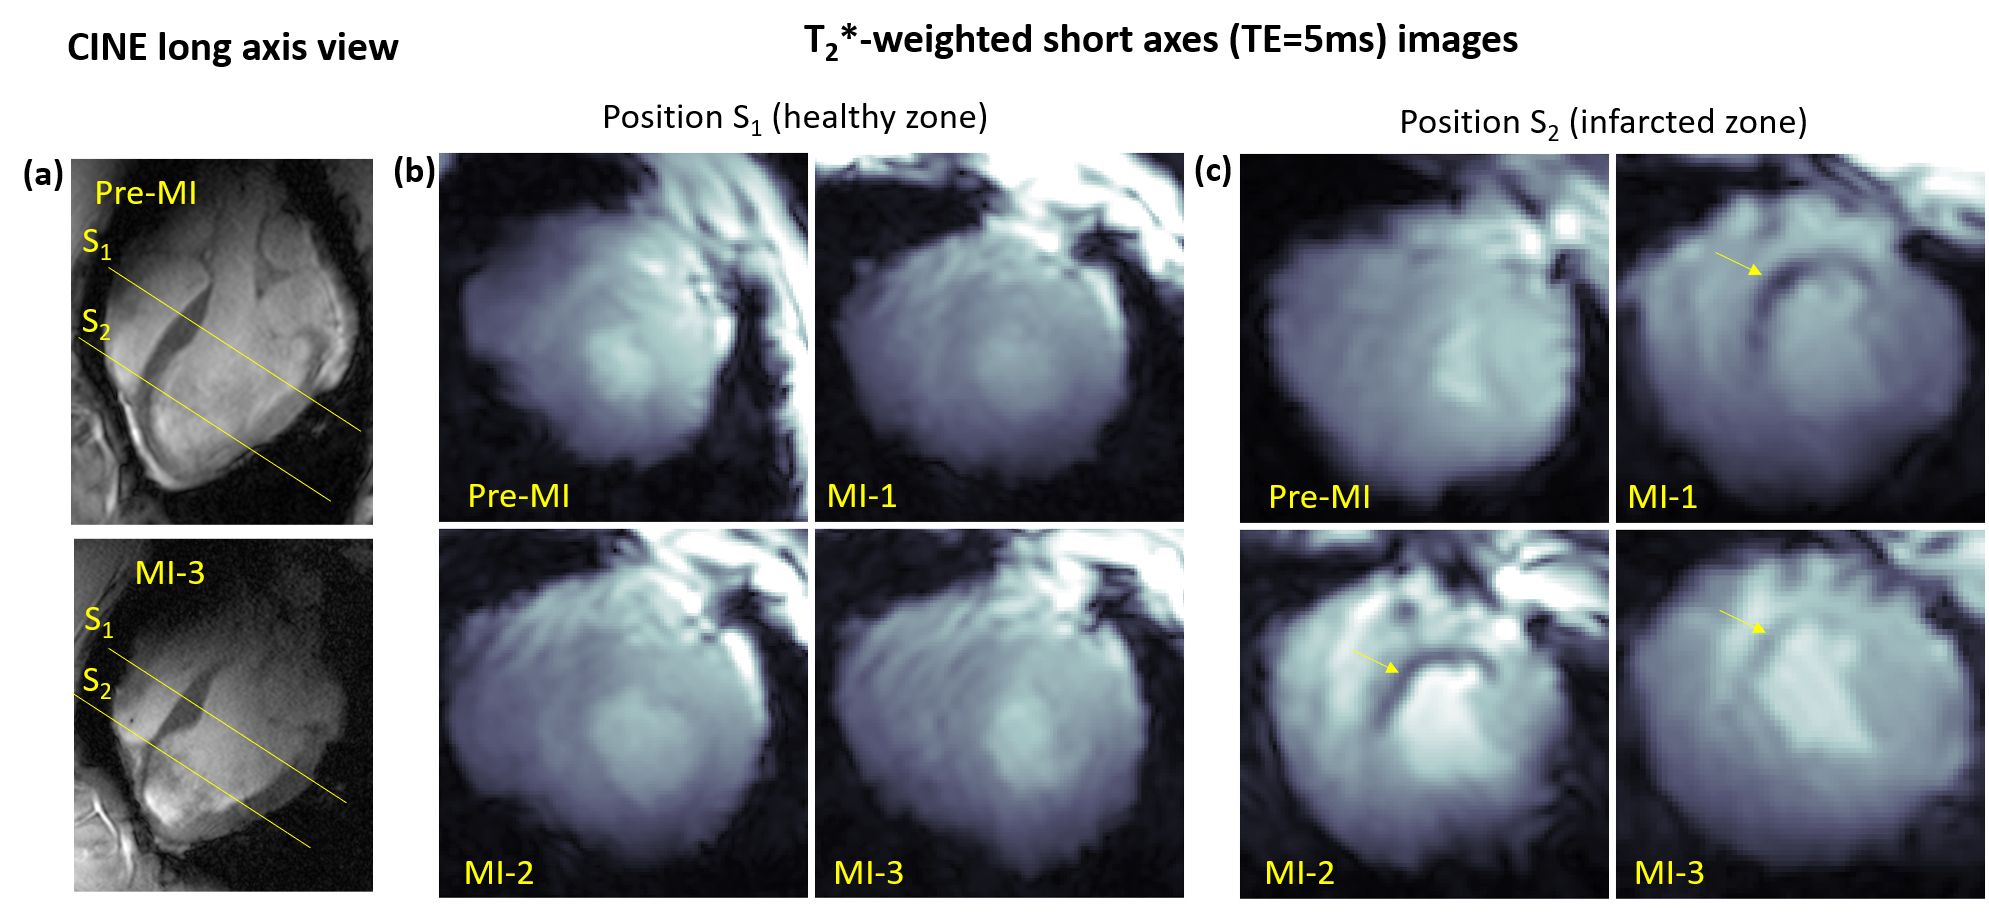
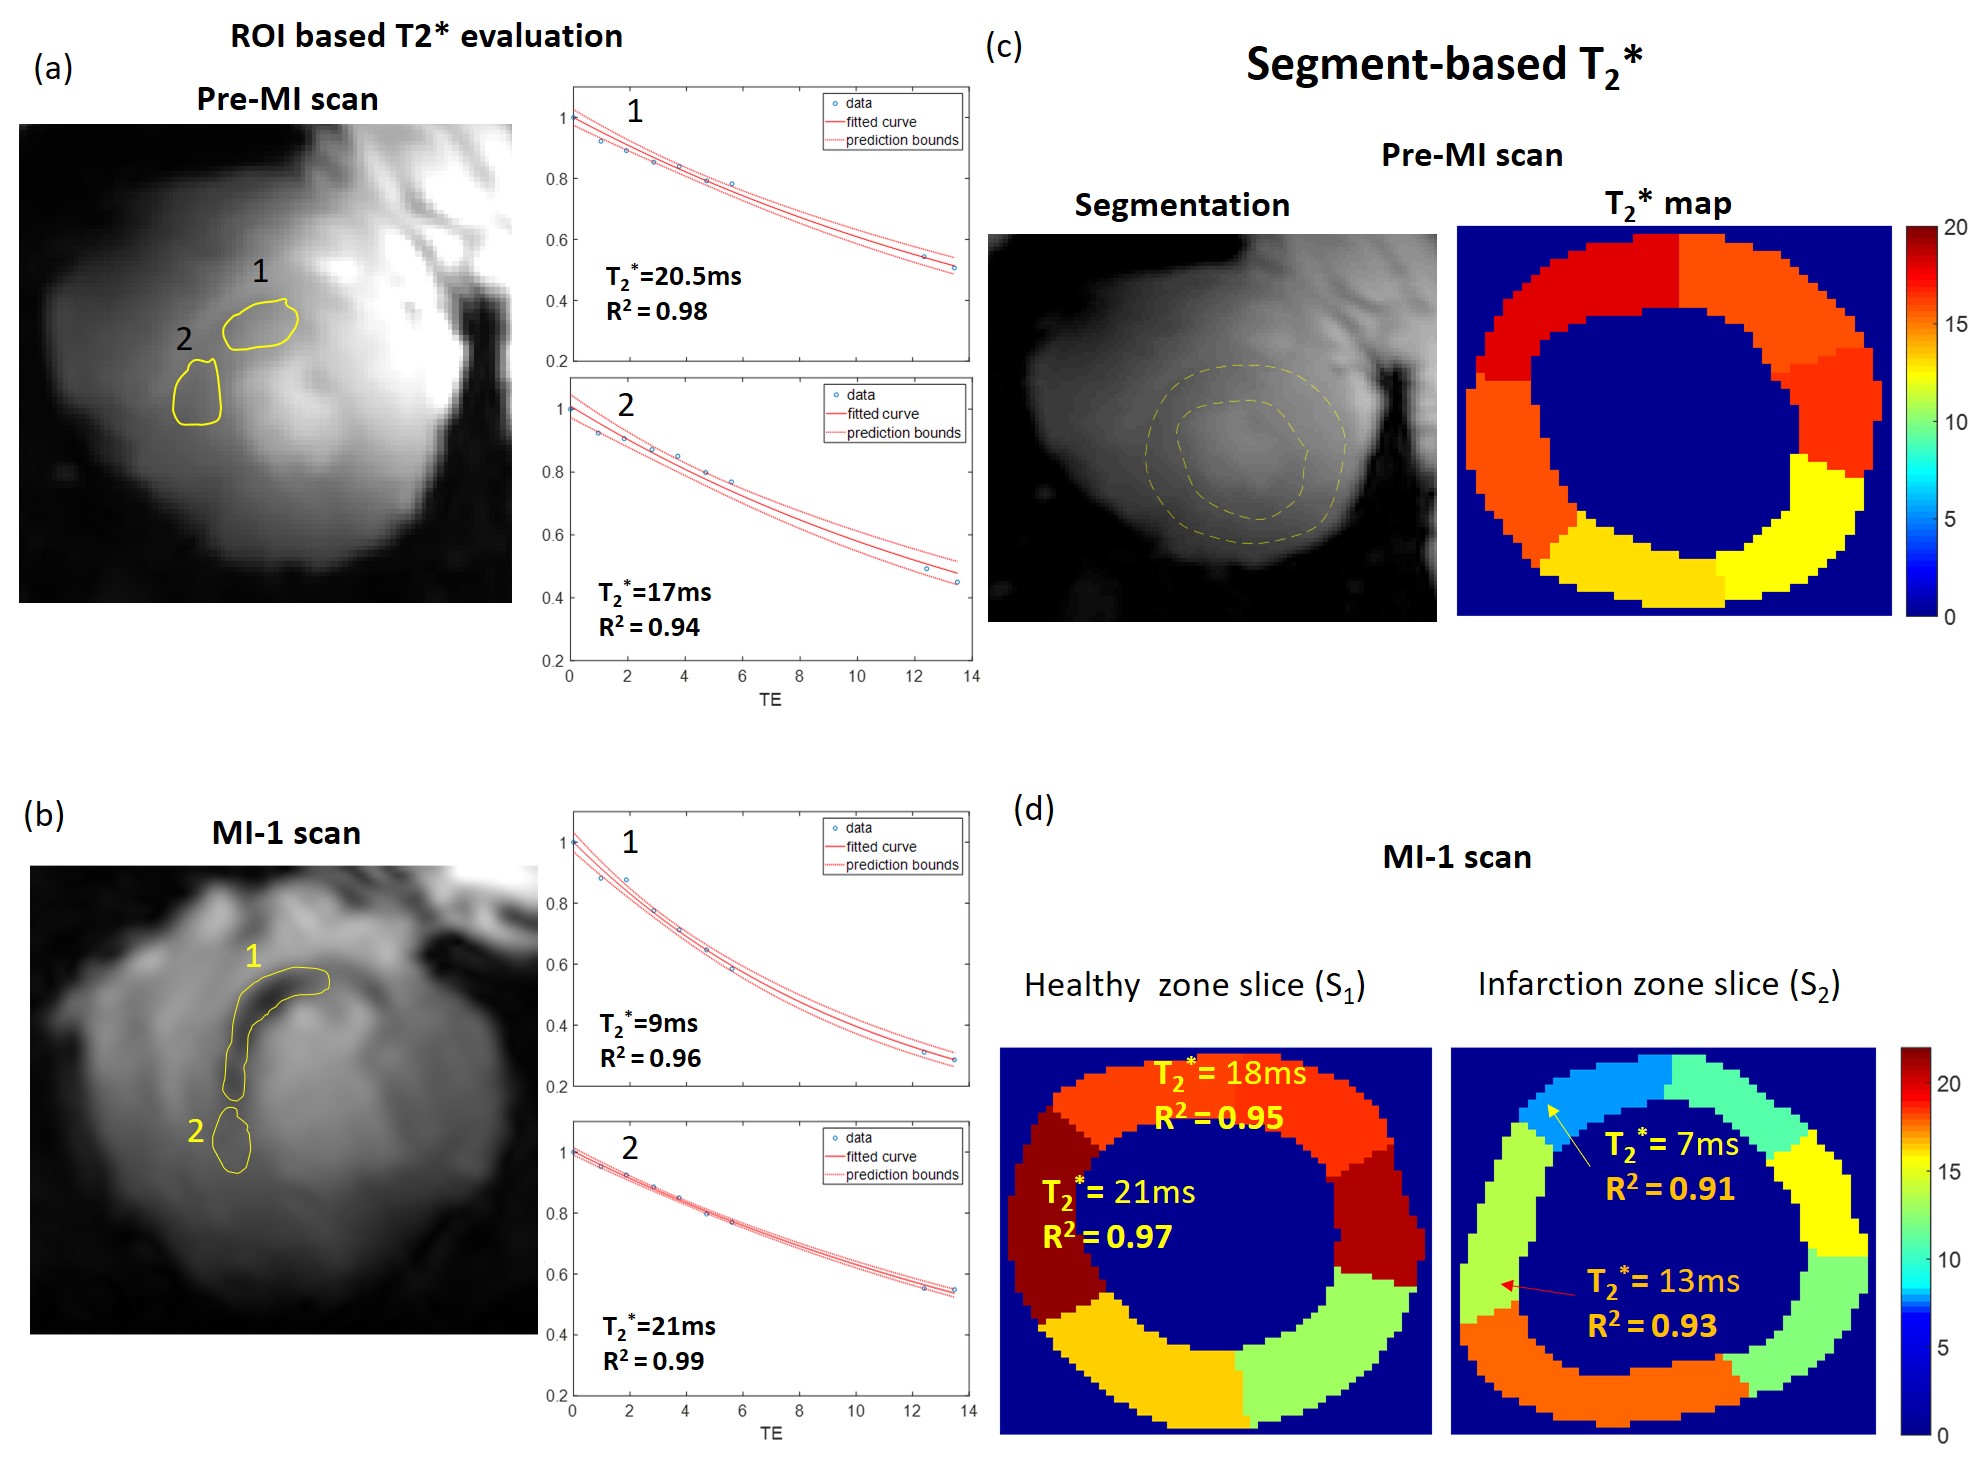
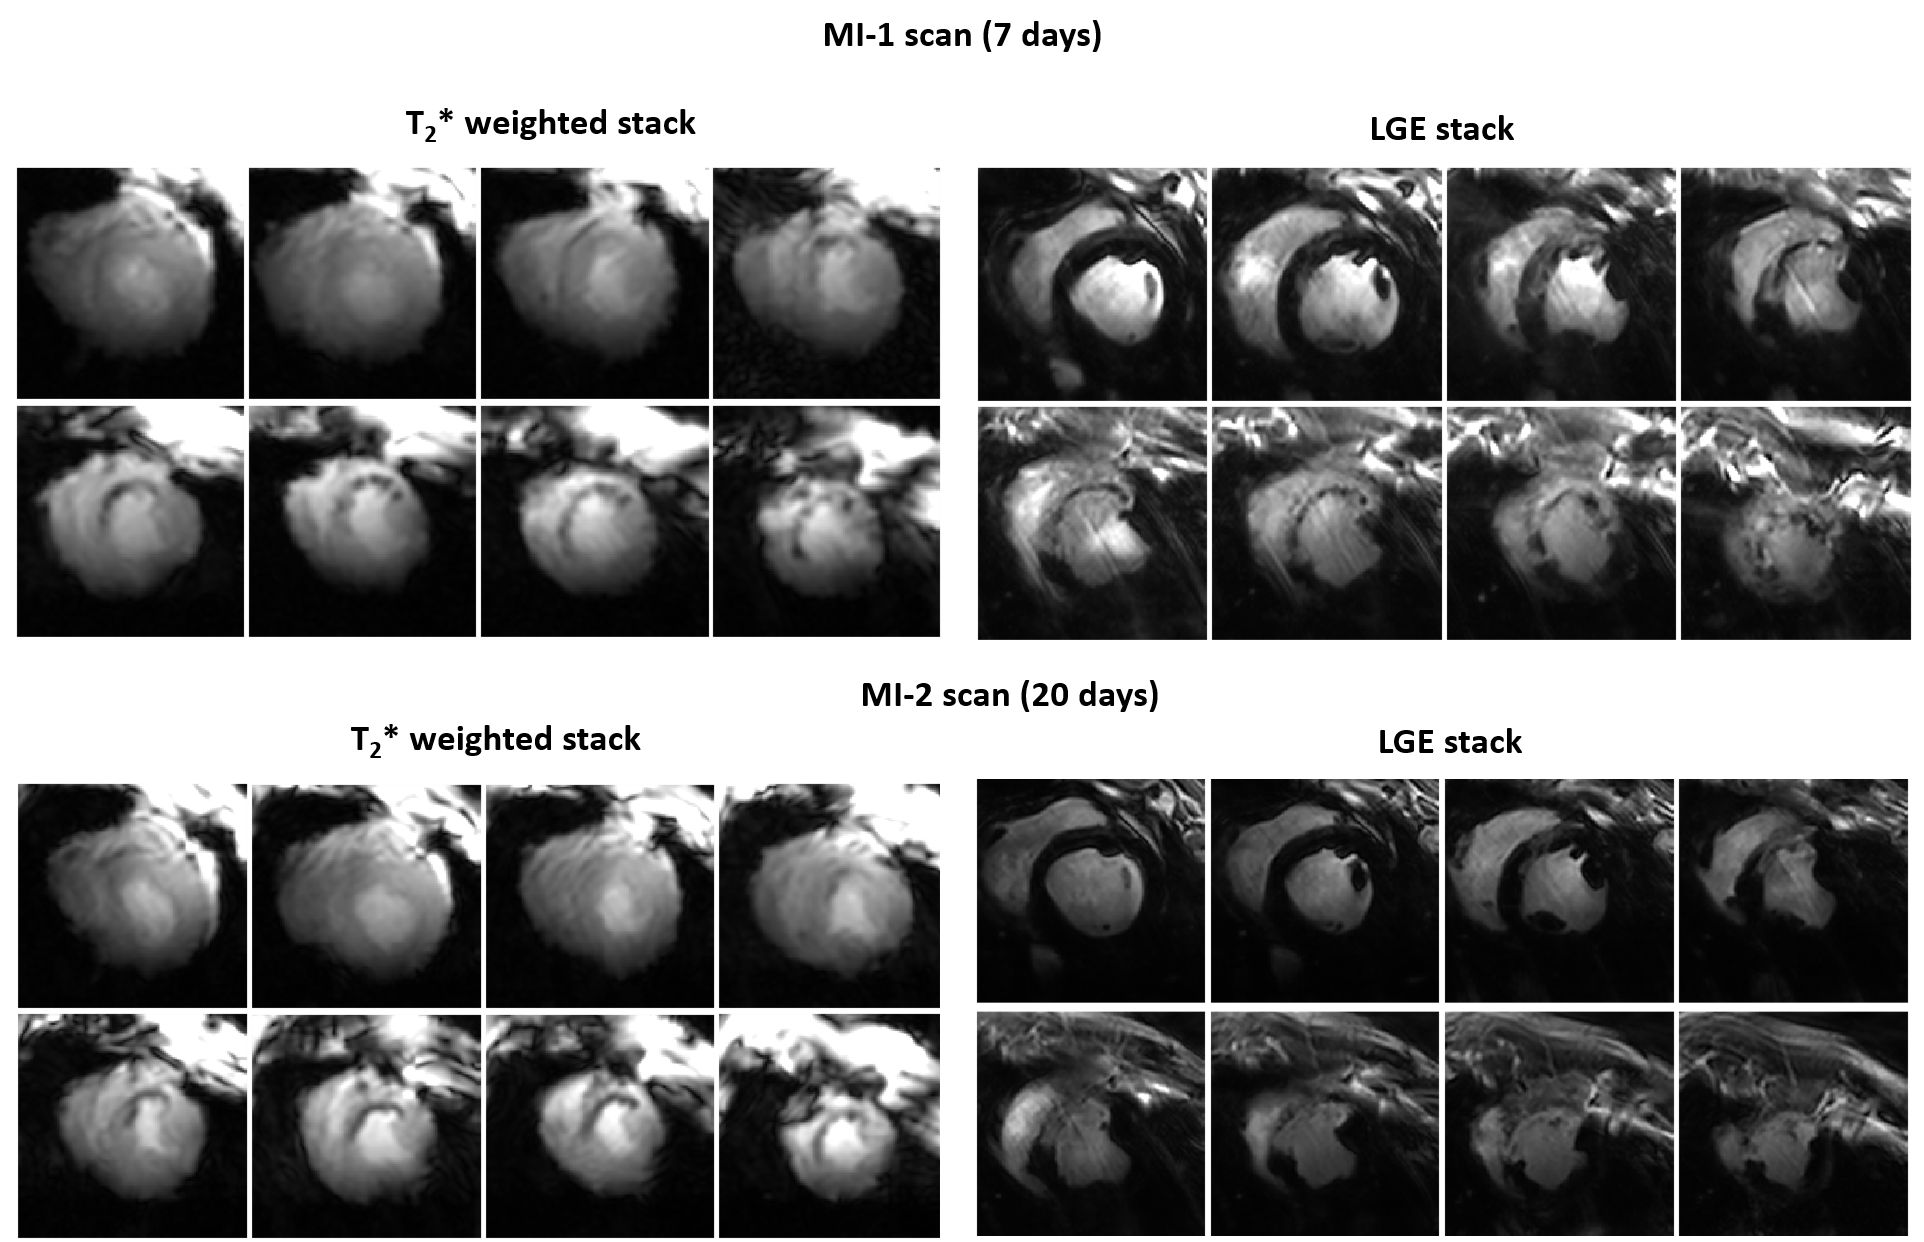
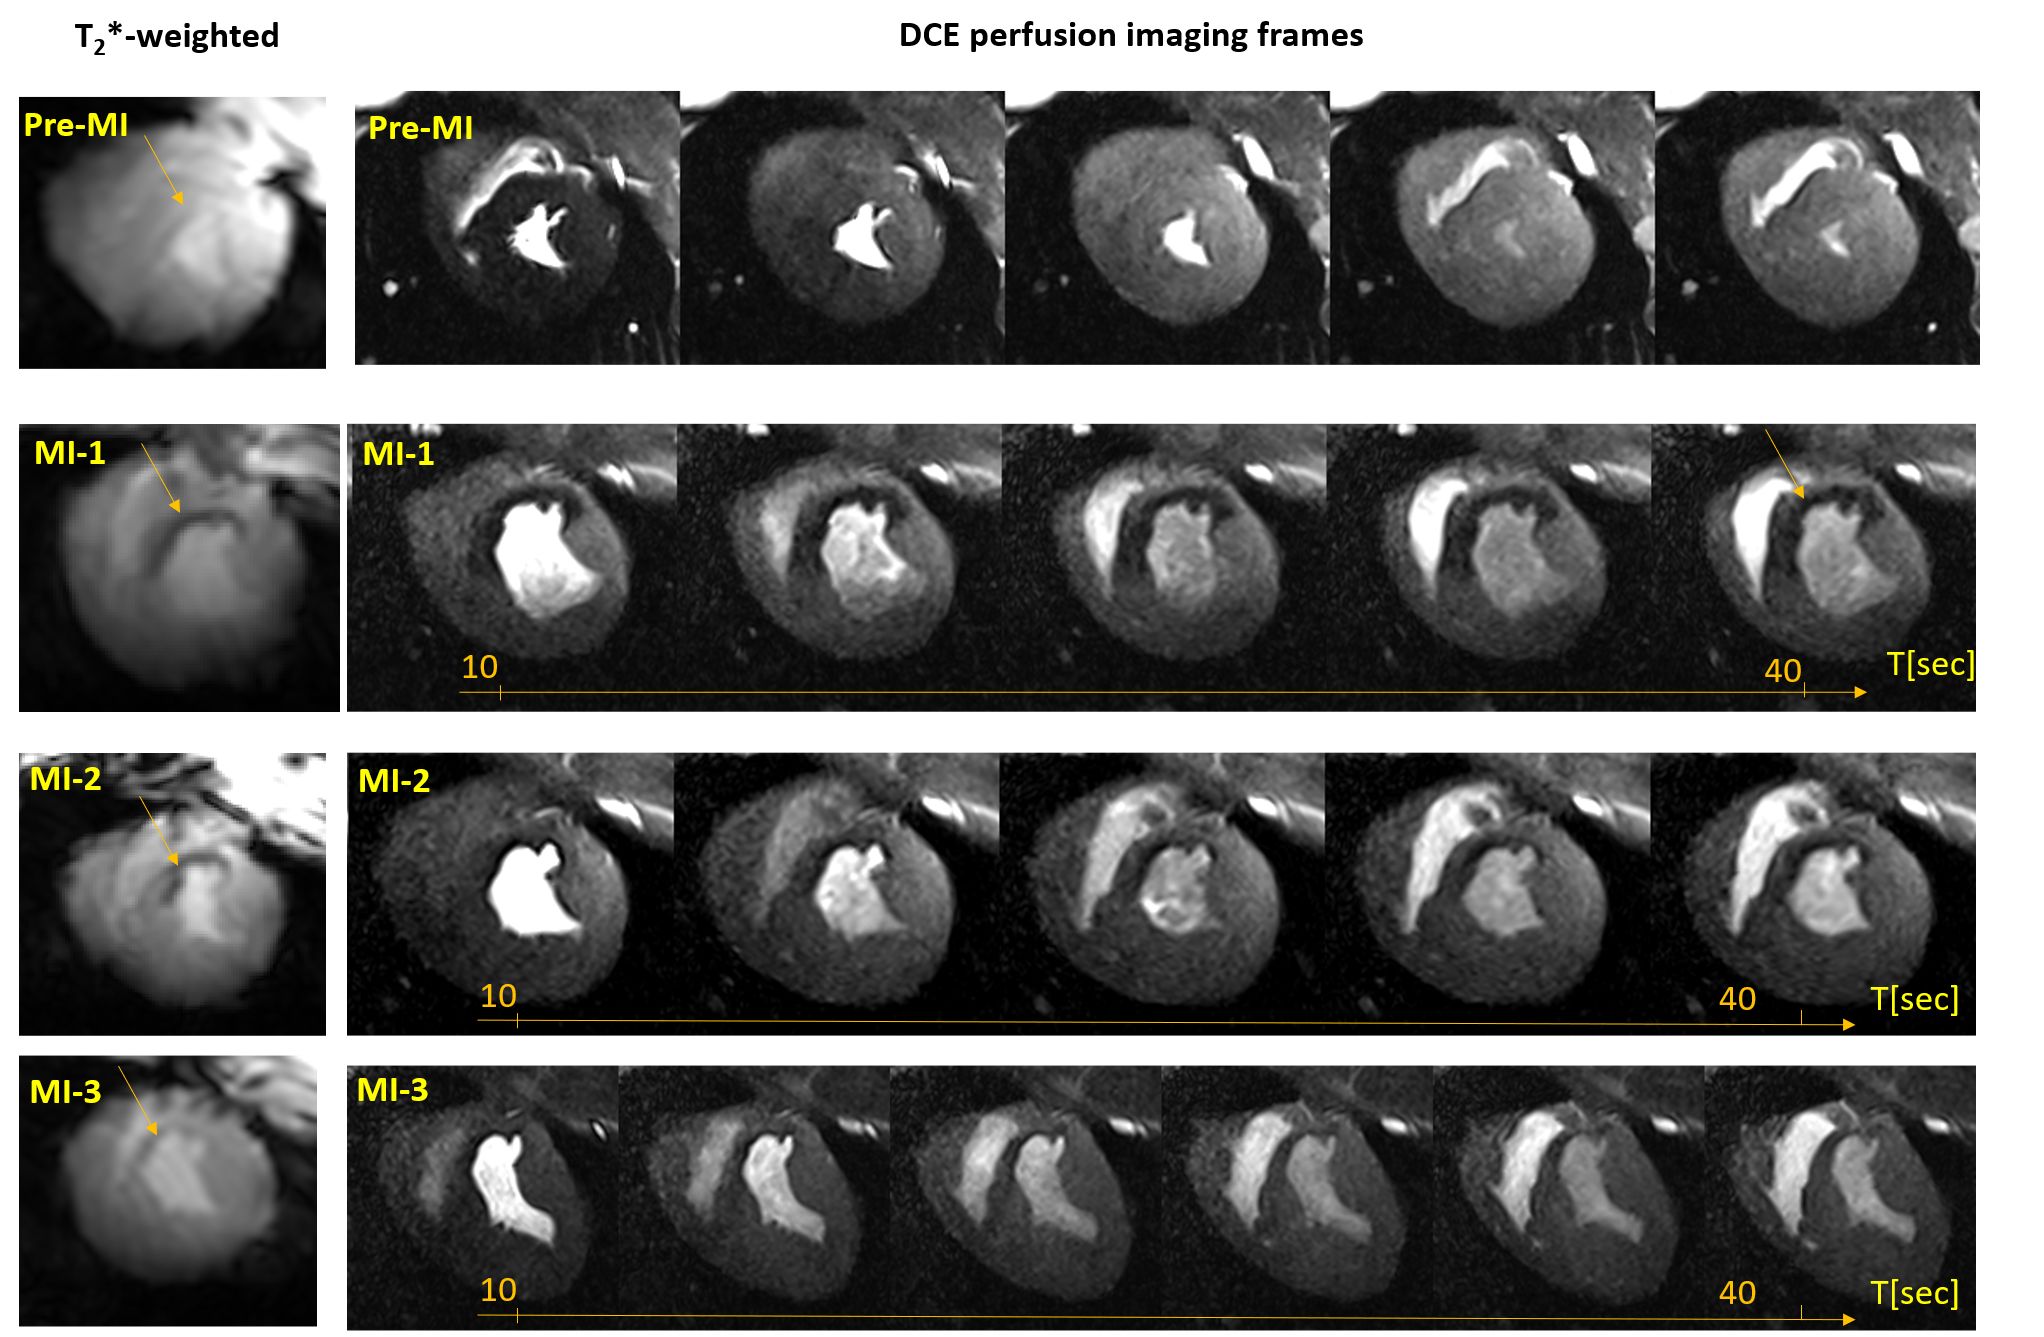
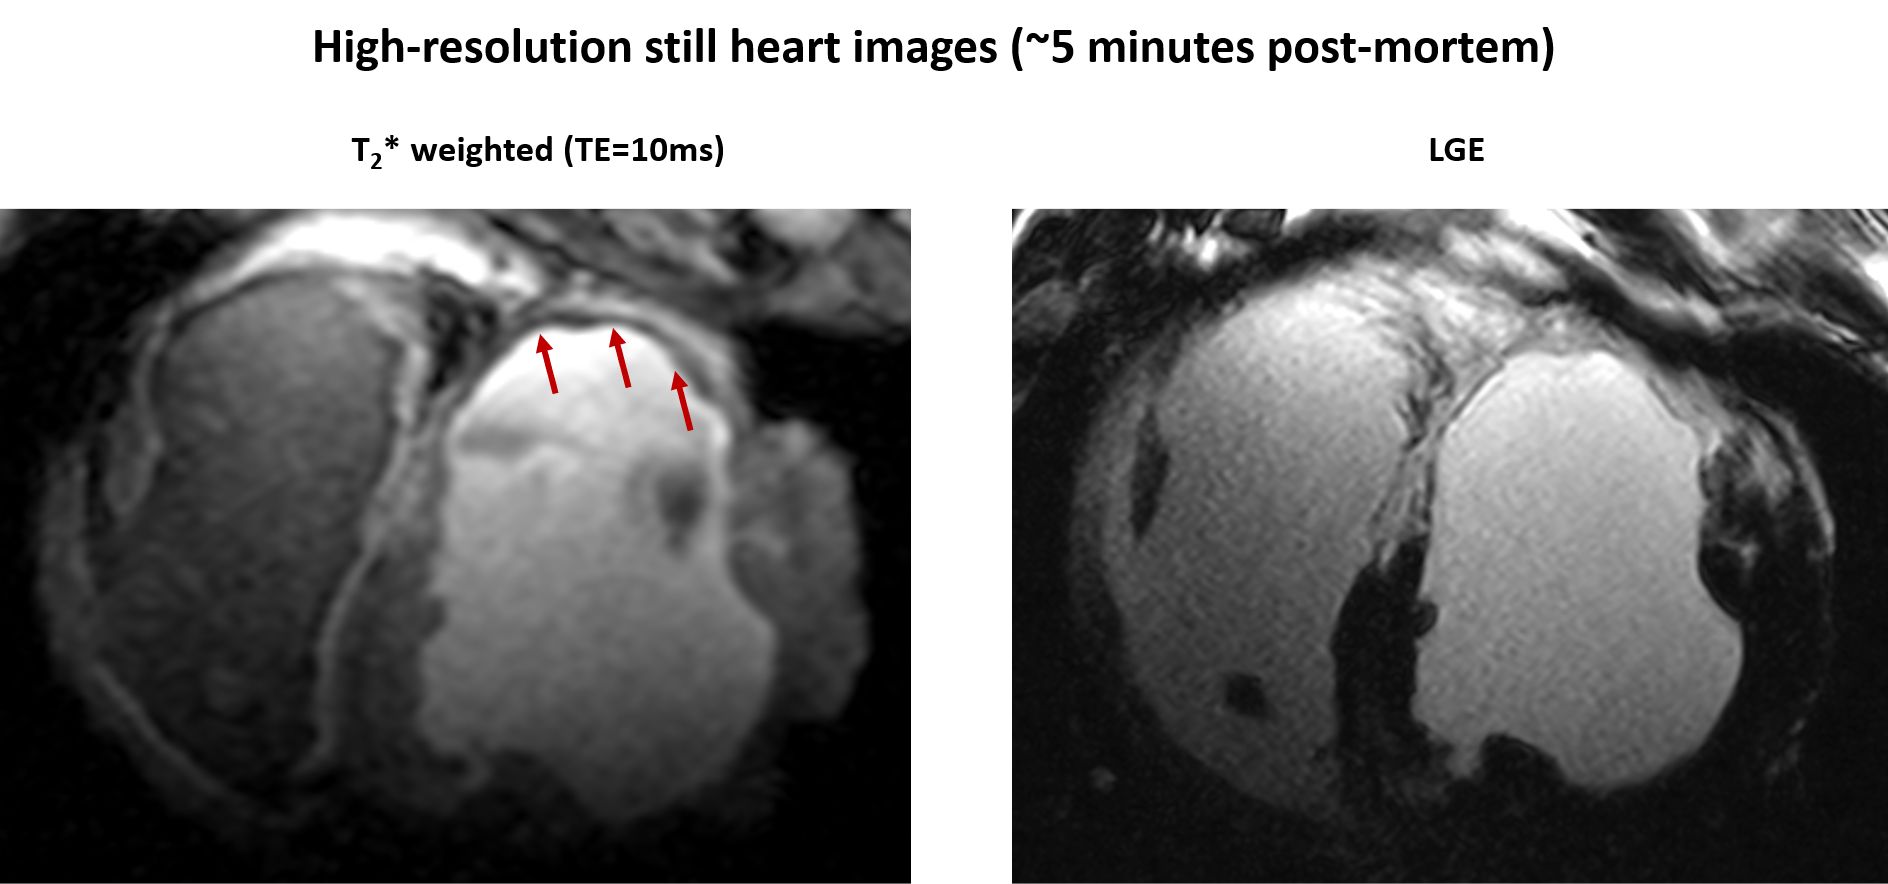
The mean weights of the animals were 34±4kg and 76±8kg in the first and last MR-sessions respectively. Figure 1 shows examples of T2*-weighted images in healthy and infarcted myocardium. A strong negative contrast of the infarction zone compared to healthy tissue is observed. Signal reduction is by a factor of 1.5-2.0 (at TE=5ms). Figure 2 demonstrates the example of ROI and segment based T2*-curves fitting for pre-MI and MI-1 scans. The coefficient of determination (R2) of fitting ranges within [0.95..0.99] for manually selected ROIs and is reduced to [0.9..0.97] for segment-based evaluation because of the intrinsically broader distribution of T2* within automatically distributed segments. Figure 3 shows the correlation observed between LGE and T2*-weighted imaging. In the acute stage (MI-1), T2*-weighted images show areas with a significant signal reduction which is localized inside the larger LGE-contrasted regions. T2*-contrast persists but becomes less prominent in the scans performed later (3-8 weeks after MI) when severe tissue remodeling and formation of scar zone occurs. Figure 4 depicts the correlation of the visualization of infarction areas by T2*-contrast with those in first-pass myocardial perfusion MRI. Figure 5 shows that without physiologic motion within a remodeled infarcted myocardial wall (highlighted by LGE) a tiny (~2mm) T2*-contrasting zone in the endocardium is revealed.Discussion
Our results allow suggesting that at 7T T2*-contrast may visualize tissue alterations after myocardial infarction at early stages (3-20 days). T2* reduction can be reliably quantified on both manually selected ROI data fitting as well as on segment-based analysis. The latter allows for better standardization of the T2*-quantification process using multi-slice data and finding correlations with parameters measured by the other MR-protocols. Regions with negative T2*-contrast correlate with scar regions highlighted by LGE. However, the area of T2*-reduction is systematically smaller when compared to the area with positive LGE-contrast. Moreover, it was observed to be smaller when tissue remodeling progressing. An interesting and probably essential observation is the substantial correlation of both localization and size of the T2*-contrasted regions with the regions of perfusion deficit detected by the DCE-MRI. To our best knowledge, such observation concerning T2* contrast in the myocardium tissue was not reported so far. The subsequent measurements with increased spatial resolution and followed by post-mortem, histology may help in a better understanding of the link between post-infarction tissue remodeling and obstruction of the microcirculation.Conclusion
Conclusion The obtained result allows supports the hypothesis that 7T B0-field T2* becomes essentially sensitive to the changes in micro-perfusion caused by the rupture of the cell membranes due to the ischemia. In the post-infarction tissue the shortening of T2* is related to both heterogeneity of a scar collagen matrix density and the structural disarray compared to the organized sheetlets of cardiomyocytes [2]. This combination of factors can make the T2*-contrast-based imaging at 7T a potentially valuable complementary methodology to the traditional cardiac MRI-techniques for assessment of the post-infarction tissue remodeling.Acknowledgements
Financial support: German Ministry of Education and Research (BMBF, grants: 01EO1004, 01E1O1504). Steven Nguen, Dr. Oleg Poznansky, and Alena Kollmann are acknowledged for the help in the animal experiments.References
[1] Elabyad, I.A., Terekhov, M., Lohr, D. et al. A Novel Mono-surface Antisymmetric 8Tx/16Rx Coil Array for Parallel Transmit Cardiac MRI in Pigs at 7T. Sci Rep 10, 3117 (2020)
[2] Hock, M, Terekhov, M, Stefanescu, MR, et al. B0 shimming of the human heart at 7T. Magn Reson Med. 2020; 85: 182– 196. https://doi.org/10.1002/mrm.28423
[3] Beyhoff N, Lohr D, Foryst-Ludwig at al Characterization of Myocardial Microstructure and Function in an Experimental Model of Isolated Subendocardial Damage. Hypertension. 2019 Aug;74(2):295-304.
Figures