0020
Imaging response to radio-chemotherapy in brain tumor models using [2,3-2H2]fumarate and deuterium magnetic resonance spectroscopic imaging1Cancer Research UK Cambridge Institute, Cambridge, United Kingdom, 2Department of Radiology, University of Cambridge, Cambridge, United Kingdom, 3Department of Chemistry, University of Cambridge, Cambridge, United Kingdom, 4Department of Biochemistry, University of Cambridge, Cambridge, United Kingdom
Synopsis
Metabolic imaging of brain tumor responses to radio-chemotherapy can give an early indication of treatment outcome. We show here that Deuterium Metabolic Imaging (DMI) with 2H-labeled fumarate can be used to detect early evidence of cell death following radio-chemotherapy in an orthotopic patient-derived glioblastoma model. 2H spectra were acquired from tumors, following an injection of 2H-labeled fumarate. Within one week of treatment the rate of tumor malate production increased significantly. Increased levels of labeled malate were also evident in spectroscopic images of the tumors. These measurements were compared with 13C MRSI measurements of [1,4-13C2]malate production from hyperpolarized [1,4-13C2]fumarate1.
Introduction
Cell death is an important imaging target for assessing early tumor treatment response and the effectiveness of therapy. The degree of tumor cell death can be a predictive indicator of patient outcome2. Imaging modalities available in the clinic, such as CT, PET-CT and MRI have focused on detecting late changes in tumor size rather than evaluating early changes in tumor physiology or metabolism. Here we investigated whether fast deuterium MRI can be used to detect cell death and assess early brain tumor treatment response using a new imaging biomarker, [2,3-2H2]fumarate. Fumarate is hydrated in a reaction catalyzed by the enzyme fumarase to produce malate1. Loss of plasma membrane integrity during cell necrosis results in fumarate rapidly gaining access to the enzyme and an increased rate of malate production1,3. Previously this has been assessed in vivo by using 13C magnetic resonance spectroscopic imaging to measure the rate of tumor malate production following intravenous injection of hyperpolarized [1,4-13C2]fumarate1.Methods and Materials
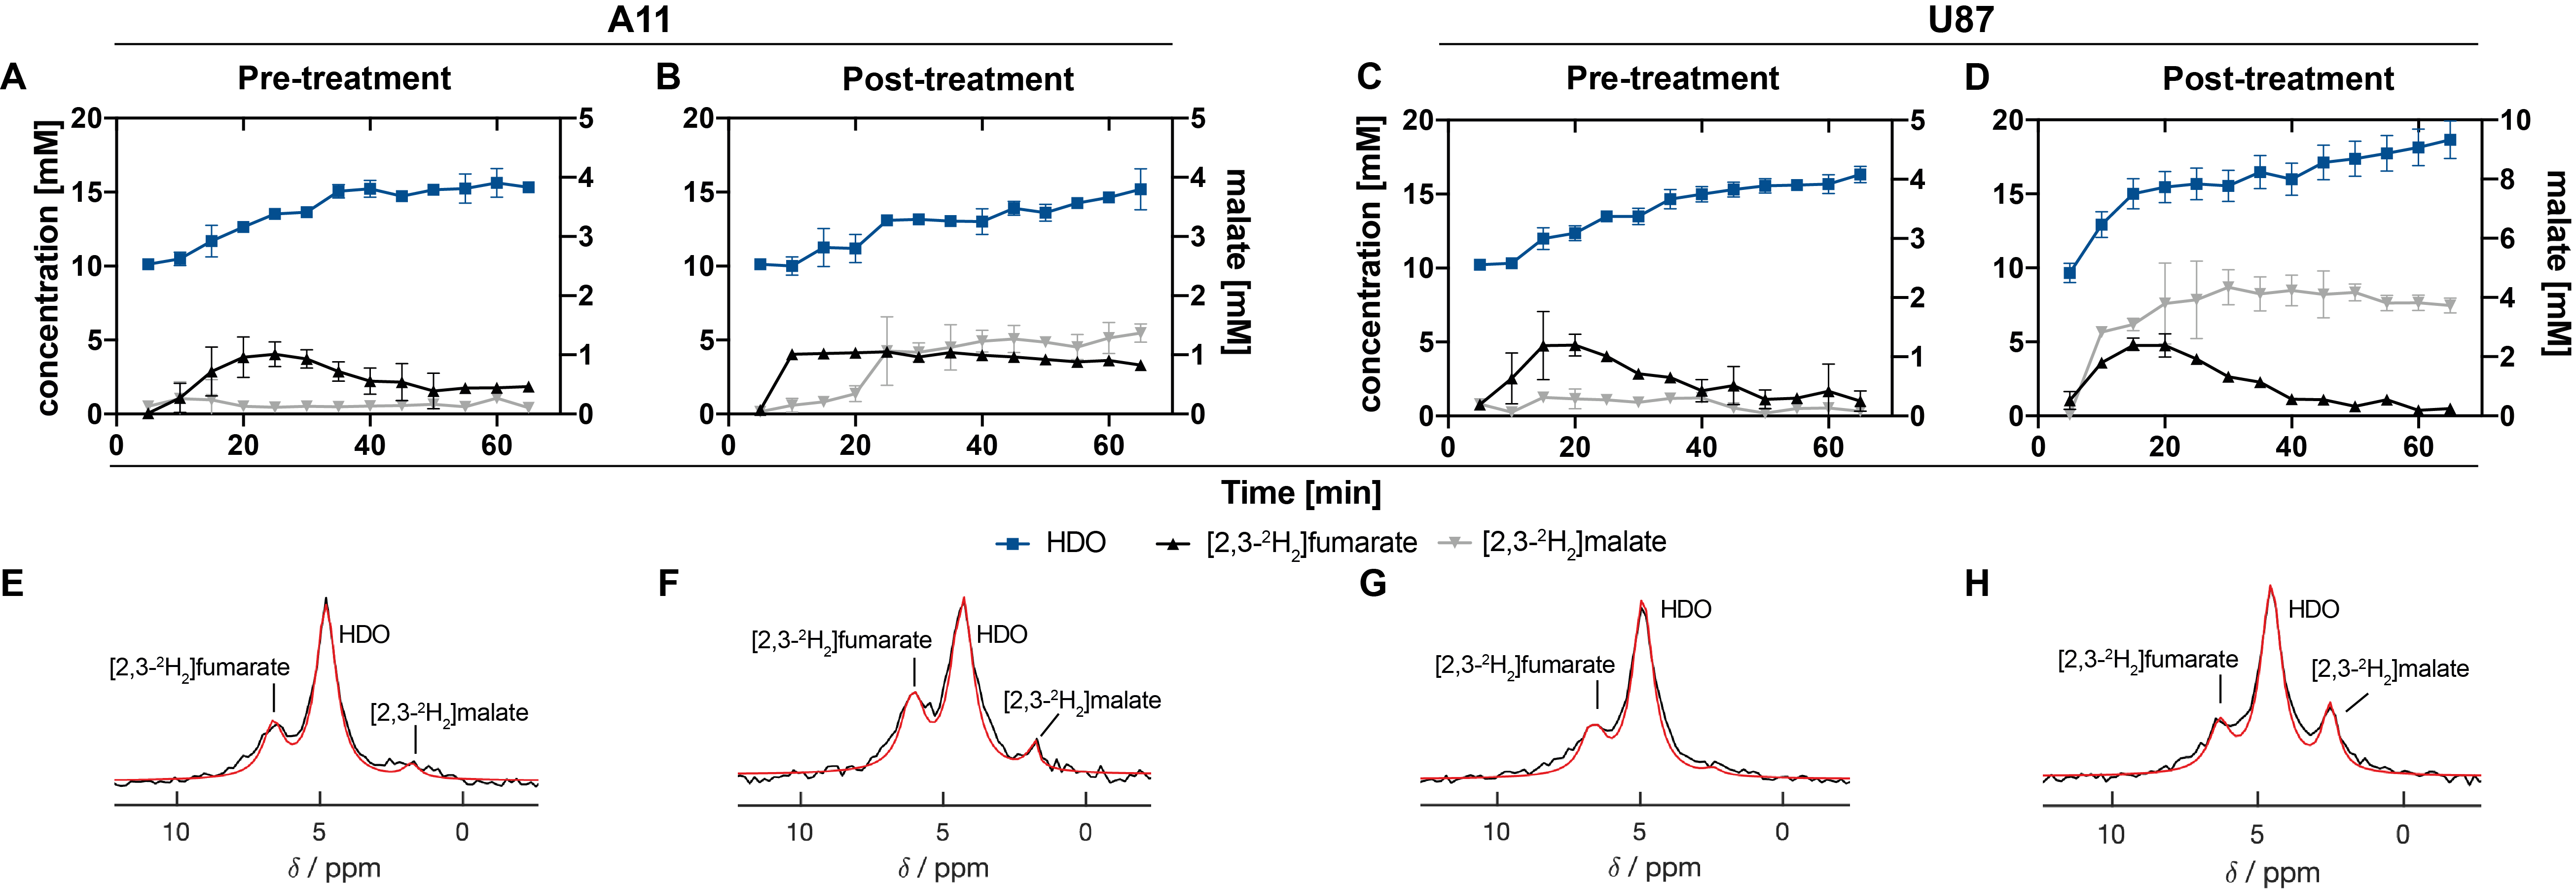
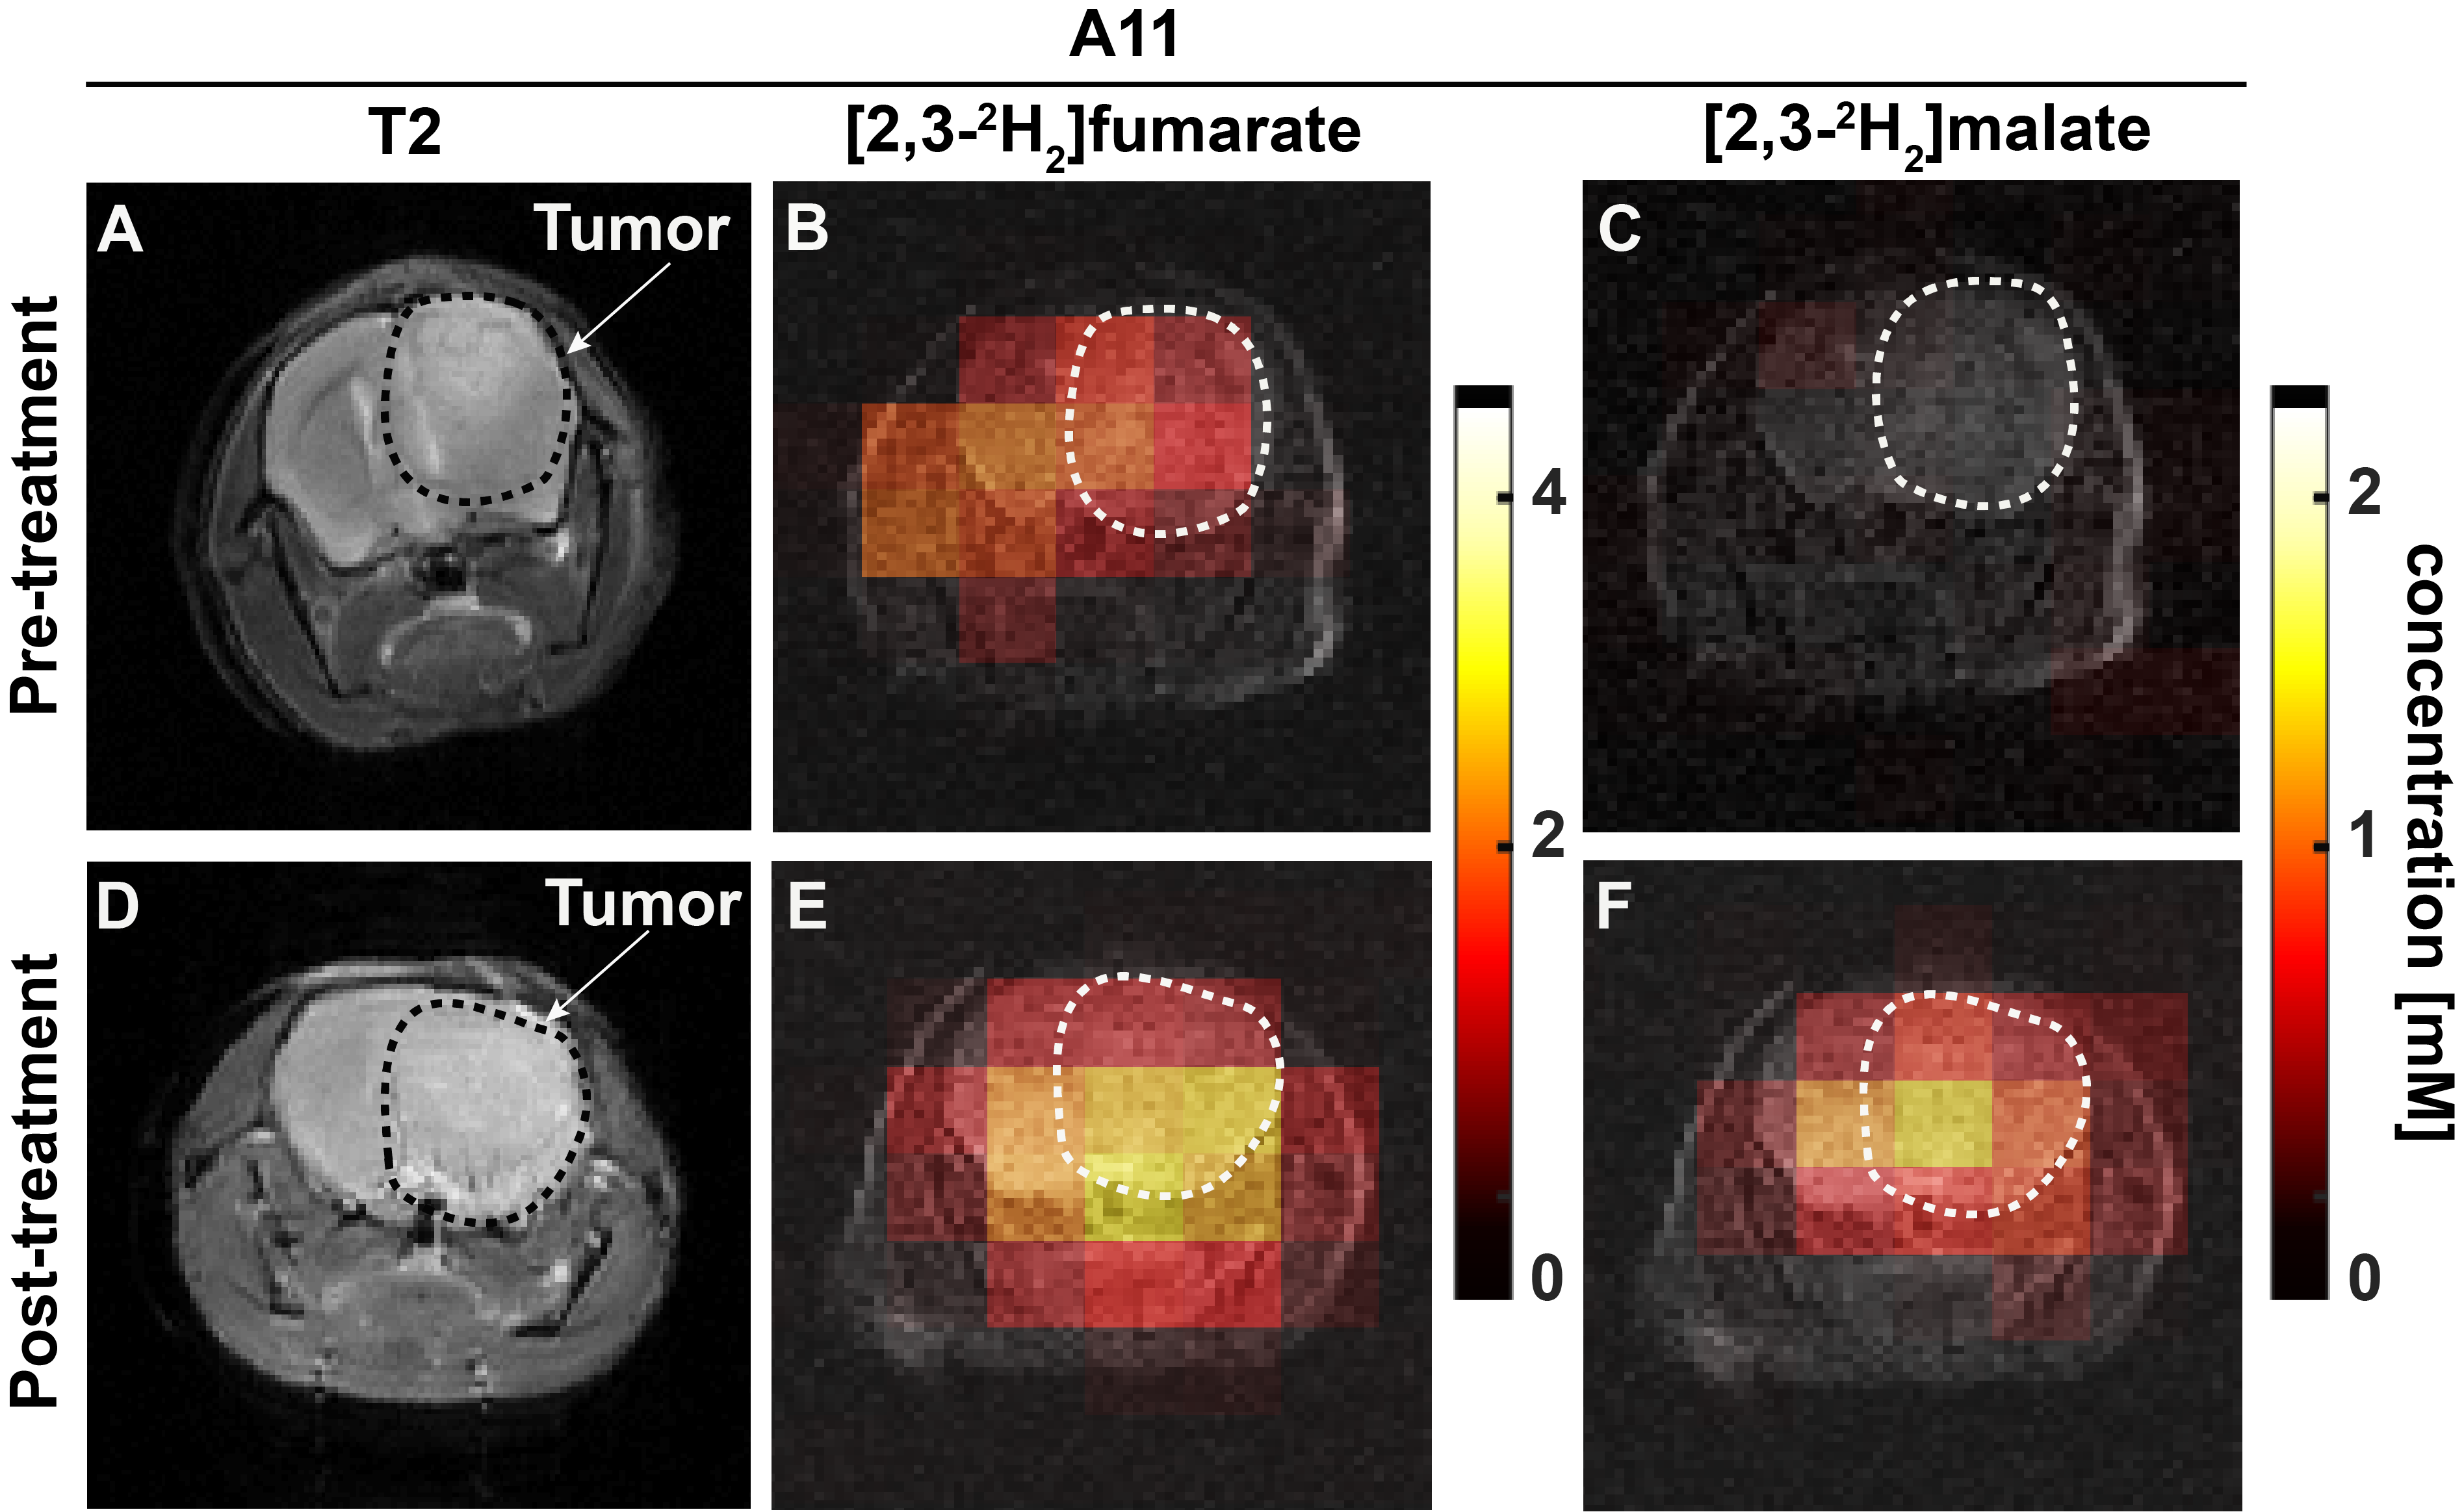
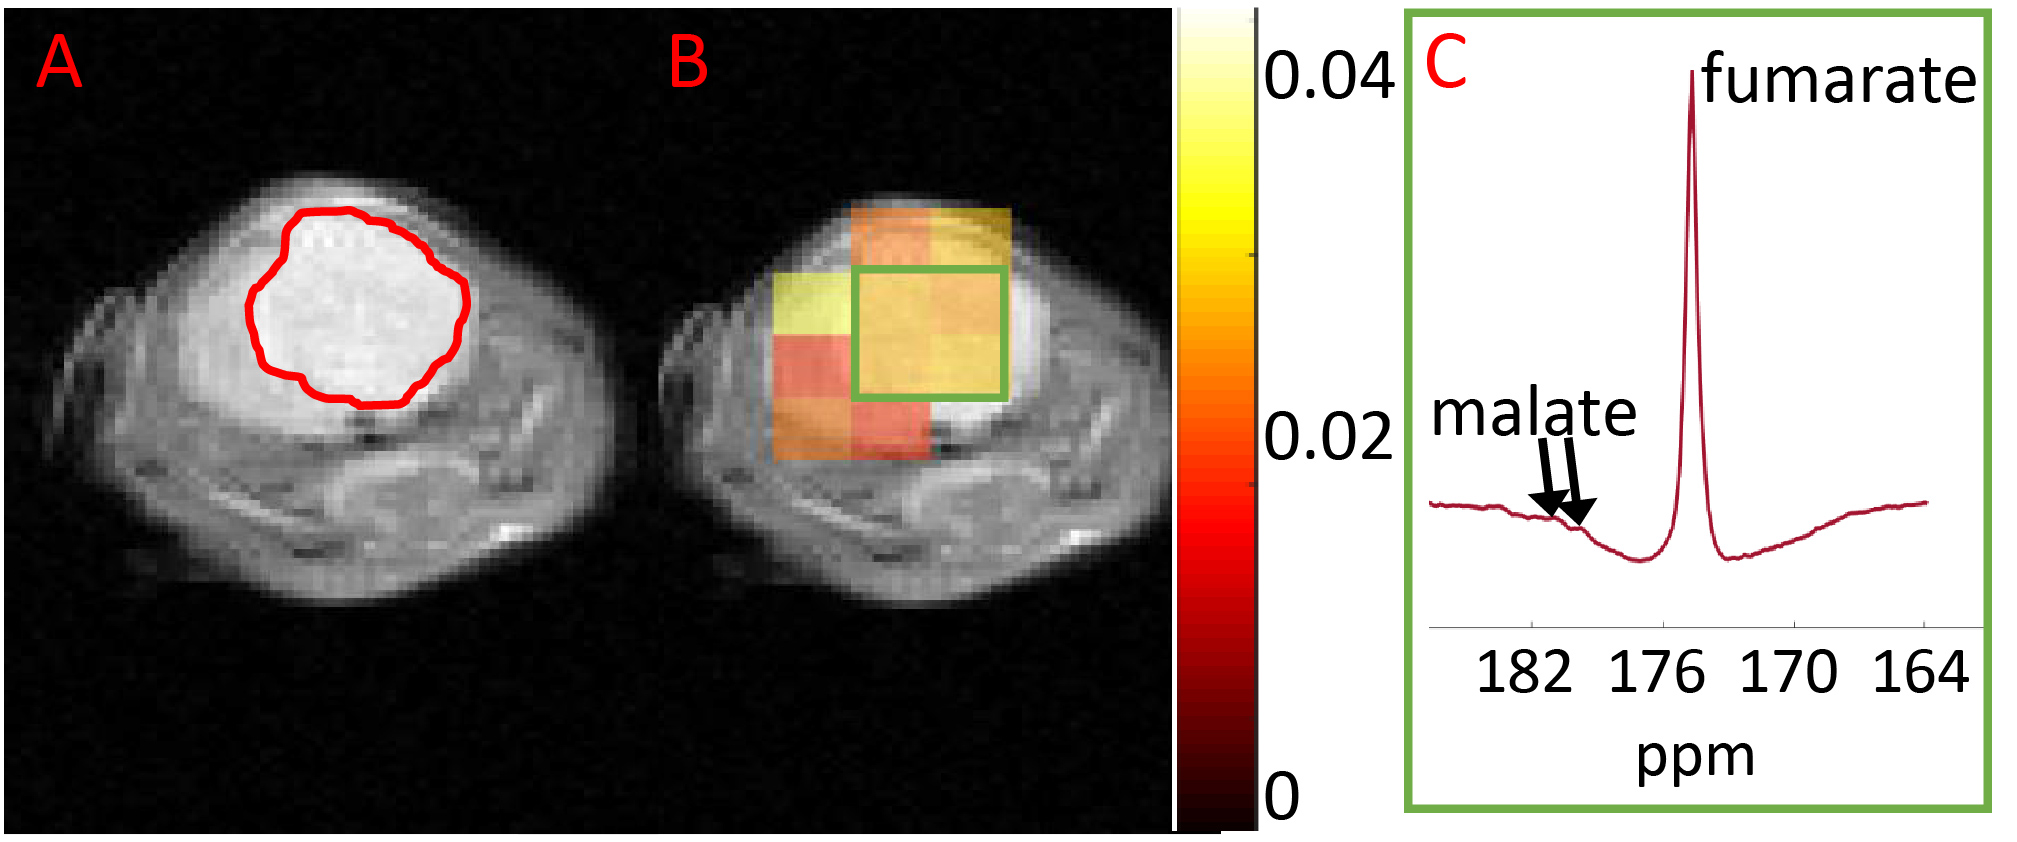
Serial 2H spectra were acquired from U87 and patient-derived (A11) glioblastoma (GB)-bearing mice using a pulse-acquire sequence with a 2 ms BIR4 adiabatic excitation pulse and were also imaged using a fast 2H chemical shift imaging sequence with a time resolution of 5 minutes, and a spatial resolution of 3 x 3 x 9 mm4, following an injection of [2,3-2H2]fumarate, before and 1 week after treatment with targeted radio-chemotherapy (10 Gy in total with 2 fractions per day, temozolomide (100 mg/kg)) delivered using a small-animal radiation research platform (SARRP). 2H MR spectroscopy and spectroscopic imaging were performed at 7 T, whereas the axial reference 1H images were acquired at 9.4 T. Hyperpolarized [1,4,13C2]fumarate imaging was performed at 7 T, as described previously1 using 2D chemical shift imaging of an axial 6 mm slice (40 x 40 mm, 16 x 16) at 20 s after a bolus injection of fumarate.Results
Surface-coil localized 2H MR spectroscopy and spectroscopic imaging were used to assess conversion of [2,3-2H2]fumarate to [2,3-2H2]malate in orthotopically implanted GB tumors following an injection of labeled fumarate (1g/kg) into tumor-bearing mice (Figures 1 and 2). Within 1 week of drug treatment the malate/fumarate ratio increased, from 0.072 ± 0.013 to 0.25 ± 0.11 (p=0.03, n=2), an ~3.5x increase, in patient-derived tumors (A11) and from 0.081 ± 0.023 to 0.91 ± 0.24 (p=0.01, n=2), an ~11x increase in U87 tumors. Only small amounts of [1,4-13C2]malate were produced from hyperpolarized [1,4-13C2]fumarate after radio-chemotherapy in this A11 tumor model (Figure 3).Discussion
Deuterium metabolic imaging (DMI) with [2,3-2H2]fumarate has great potential for quantitative assessment of GB tumor cell death in vivo. Both hyperpolarized 13C-labeled and 2H-labeled fumarate were able to cross the compromised blood brain barrier and be converted to malate. However, compared to 13C-labeled fumarate, the measured difference in malate production, pre- and post-treatment, was significantly greater after injection of 2H-labeled fumarate, which may reflect the considerably longer acquisition time. Hyperpolarized 13C experiments are limited by the short lifetime of the 13C hyperpolarization and the accumulation of labeled malate was measured over just 3 mins as compared to 65 min in the case of the 2H-labeled fumarate experiments.Conclusion
Tumor malate production from [2,3-2H2]fumarate increased significantly within seven days of targeted radio-chemotherapy, demonstrating the potential of 2H-labeled fumarate for assessing GB tumor cell death and the early responses of brain tumors to treatment.Acknowledgements
The work was supported by grants from Cancer Research UK (C197/ A17242, C197/A16465, C9685/A25177). FH is in receipt of a Cambridge European Scholarship from the Cambridge Trust.References
1. Gallagher FA, Kettunen MI, Hu D-E, et al. Production of hyperpolarized [1,4-13C2]malate from [1,4-13C2]fumarate is a marker of cell necrosis and treatment response in tumors. Proc Natl Acad Sci U S A. 2009;106(47):19801-19806.
2. Neves AA, Brindle KM. Imaging cell death. J Nucl Med. 2014;55(1):1-4.
3. Clatworthy MR, Kettunen MI. Magnetic resonance imaging with hyperpolarized fumarate allows detection of early renal acute tubular necrosis. Proc Natl Acad Sci U S A. 2012;109:13374-13379.
4. Kreis F, Wright AJ, Hesse F, et al. Measuring Tumor Glycolytic Flux in Vivo by Using Fast Deuterium MRI. Radiology. 2020;294(2):289-296.
Figures