0019
Early noninvasive metabolic biomarkers of mutant IDH inhibition in low-grade glioma models1Radiology and Biomedical Imaging, University of California San Francisco, San Francisco, CA, United States, 2Neurological Surgery UCSF Weill Institute for Neurosciences, University of California San Francisco, San Francisco, CA, United States, 3Brain Tumor Research Center, University of California San Francisco, San Francisco, CA, United States, 4Hotchkiss Brain Institute, University of Calgary, Calgary, AB, Canada
Synopsis
Targeting mutant IDH, which is present in ~80% of glioma, is being tested as a new therapeutic approach. In the current study, we investigated metabolic alterations in response to mutant IDH inhibition by either AG-881 or BAY-1436032 in orthotopic patient-derived glioma models. Using high resolution in vivo 1H MRS we detected, in addition to a decrease in 2HG, an early increase in glutamate and the combined glutamine/glutamate signals. These were associated with slowdown of tumor growth and ultimately longer animal survival. This identifies potential early metabolic biomarkers of glioma response to mutant IDH inhibition.
Introduction
Diffuse infiltrative low-grade gliomas (LLGs) are comprised of astrocytoma and oligodendroglioma based on histology and isocitrate dehydrogenase (IDH) mutational status.1 Mutant IDH catalyzes the conversion of α-ketoglutarate (α-KG) to 2-hydroxyglutarate (2HG), which is a tumorigenesis driving oncometabolite. Since ~80% of LGGs harbor IDH1/2 mutations, the mutations are considered a potential therapeutic target. The brain permeable pan IDH1/2 inhibitor AG-881, and the pan IDH1 inhibitor BAY-1436032, are in Phase-I clinical trials.2,3 In this study we used high resolution 1H MRS at 14.1T to characterize the in vivo metabolic profiles of orthotopic genetically engineered and patient-derived LGG models following treatment with these two inhibitors. Early clinically translatable metabolic imaging biomarkers of mutant IDH inhibition in gliomas were identified and may be used to assist in monitoring response to therapy in the clinic.Methods
LGG tumors were induced in immunocompromised mice by intracranial injection of the following cells: 1) U87IDHmut glioma genetically engineered to express mutant IDH (UCSF), 2) BT257 patient-derived astrocytoma (University of Calgary) and 3) SF10417 patient-derived oligodendroglioma (UCSF). Once tumors reached 2-3mm in diameter, mice were randomly divided into three groups and treated daily p.o. with either the oral suspending vehicle Ora-plus (controls; Perrigo) or AG-881 (50 mg/kg; MedChemExpress) resuspended in Ora-plus or BAY-1436032 (150 mg/kg; MedChemExpress) resuspended in Ora-plus. MR studies were performed in a vertical Agilent 14.1T scanner. Tumor size was determined from T2-weighted images acquired using a spin-echo multi-slice sequence (TE/TR=20/1200ms, FOV=30x30mm2, 256x256, slice thickness=1mm, NA=2) by summing manually contoured tumor areas in each slice and multiplying by slice thickness (in-house software). 1H MRS spectra were recorded from a single 8mm3 voxel using the PRESS sequence (TE/TR=20/4000ms, 512) and analyzed using LCmodel with normalization to total signal.Results and Discussion
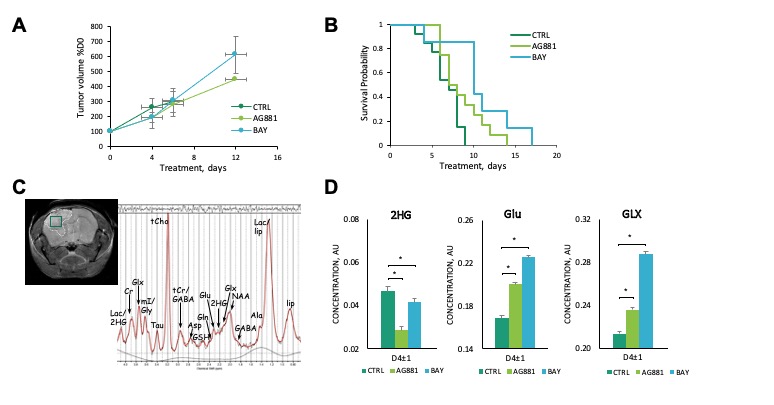
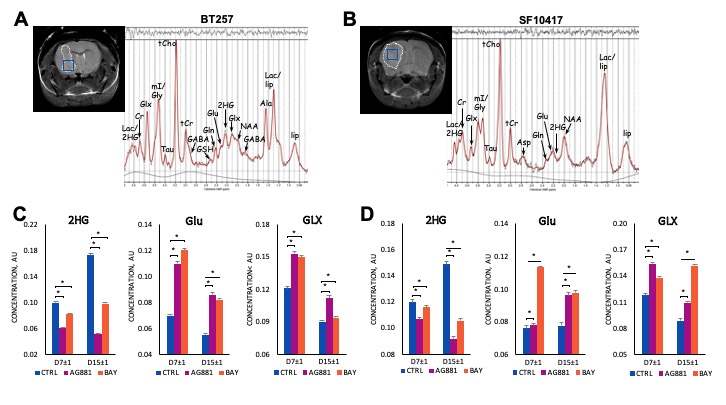
We first performed a small study on U87IDHmut-bearing mice by non-invasively monitoring metabolic changes that occurred in response to mutant IDH inhibition by AG-881 and BAY-1436032.2,3 While no significant changes in average tumor volume as a percent of day 0 (D0) were observed (Fig.1A), the overall survival was significantly longer in AG-881- and BAY-1436032-treated groups when compared to controls (Fig.1B). In vivo 1H MRS at D4±1 revealed that treatment with both inhibitors led to a significant decrease in 2HG levels, as expected (Fig.1C,D). Additionally, both treatments led to a significant increase in glutamate (Glu) and the sum of glutamate and glutamine (GLX). This confirmed previous in vitro findings.4,5 Moreover, treatment with both inhibitors resulted in a significant decrease in myoinositol, glutathione, lactate and taurine, and a significant increase in NAA and tCho. We next investigated the metabolic changes occurring in response to mutant IDH inhibition in patient-derived BT257 and SF10417 LGGs (Fig.2A,B). No significant differences were observed in average tumor volume in both models following either AG-881 or BAY-1436032 treatments at day 7 (D7), but slower growth could be observed starting at day 15 (D15), when comparing to controls (Fig.2C,D). Both AG-881 and BAY-1436032 treatments also led to significantly increased survival in both models (Fig.3). In order to determine the metabolic differences associated with mutant IDH inhibition, we acquired in vivo 1H MRS at D7, before changes in tumor volume were observed, and at D15, once tumor growth was observed to be slower compared to untreated controls (Fig.4). In both models, treatment with both inhibitors led to a significant decrease in 2HG concentration that was observed independent of changes in tumor growth (Fig.4B). Moreover, the levels of Glu and GLX were significantly increased at both D7 and D15 in both BT257 and SF10417 LGGs in response to both mutant IDH inhibitors when compared to controls (Fig.4). The early time point results from the two patient-derived LGG models confirm both our in vitro findings, and the in vivo observations in the genetically engineered U87IDHmut model. In addition, at D7 and in both models, AG-881 and BAY-1436032 treatments led to a significant decrease in the levels of tCho and an increase in NAA. tCho levels remained significantly decreased at D15 of the treatment, when differences in tumor volume compared to controls were more visible, but differences in NAA levels were no longer significant at D15. Overall, all three investigated LGG models showed a common drop in 2HG and an early common increase in Glu and GLX in response to both mutant IDH inhibitors.Conclusion
In this study, we non-invasively monitored metabolic alterations in response to longitudinal mutant IDH inhibition using high resolution in vivo 1H MRS in LGGs. In the genetically engineered U87IDHmut model as well as two patient-derived BT257 and SF10417 LGG models, during the course of either AG-881 or BAY-1436032 treatments, we observed a consistent reduction in 2HG, confirming brain penetration and action of the IDH inhibitors. Moreover, we detected changes in Glu and GLX prior to visible changes in tumor volume. These observations are consistent with previous reports that the IDH1 mutation alters Glu metabolism.4,5 Our study identifies the increase in Glu and GLX together with the drop in 2HG as potential translatable early metabolic biomarkers of LGG response to mutant IDH inhibition.Acknowledgements
NIH R01CA197254 and the UCSF Brain Tumor Center Loglio Collective.References
1. Louis DN, Ohgaki H, Wiestler OD, Cavenee WK. World Health Organization Histological Classification of Tumours of the Central Nervous System. (2016), International Agency for Research on Cancer, France
2. Mellinghoff IK, Penas-Prado M, Peters KB, Cloughesy TF, Burris HA, Maher EA, Janku F, Cote GM, De La Fuente MI, Clarke J, Steelman L, Le K, Zhang Y, Sonderfan A, Hummel D, Schoenfeld S, Yen K, Pandya SS, Wen PY. Phase 1 study of AG-881, an inhibitor of mutant IDH1/IDH2, in patients with advanced IDH-mutant solid tumors, including glioma. (2018), Journal of Clinical Oncology, 36.
3. Pusch S, Krausert S, von Deimling A, et al. Pan-mutant IDH1 inhibitor BAY 1436032 for effective treatment of IDH1 mutant astrocytoma in vivo (2017), Acta Neutopathologica, 133, 629-644.
4. Izquierdo-Garcia JL, Viswanath P, Eriksson P, Chaumeil MM, Pieper RO, Phillips JJ, Ronen SM. Metabolic reprogramming in Mutant IDH1 Glioma Cells. (2015), PLos One, 10(2).
5. Molloy AR, Najac C, Viswanath P, Lakhani A, Subramani E, Batsios G, Radoul M, Gillespie AM, Pieper RO, Ronen SM. MR-detectable metabolic biomarkers of response to mutant IDH inhibition in low-grade glioma. (2020), Theranostics 10(19) 8757-8770.
Figures