0018
Deuterium magnetic resonance spectroscopy using 2H-pyruvate allows non-invasive in vivo imaging of TERT expression in brain tumors1Radiology and Biomedical Imaging, UCSF, San Francisco, CA, United States, 2Neurological Surgery, UCSF, San Francisco, CA, United States
Synopsis
Telomerase reverse transcriptase (TERT) expression is essential for tumor proliferation. Since TERT is exclusively expressed in tumor cells, TERT is also an attractive therapeutic target. However, non-invasive methods of imaging TERT are lacking. Here, we show that TERT expression in preclinical patient-derived brain tumor models is associated with elevated steady-state levels of NADH, an effect that can be non-invasively visualized in vivo by deuterium metabolic imaging using [U-2H]pyruvate. Since 2H-MRS can be readily implemented on clinical MR scanners, our results provide an innovative, clinically translatable method of integrating information regarding a fundamental cancer hallmark, i.e. TERT, into glioma patient management.
INTRODUCTION
Telomere shortening constitutes a natural barrier to uncontrolled proliferation and all tumors must find a mechanism of maintaining telomere length [1]. Most human tumors, including high-grade primary glioblastomas (GBMs) and low-grade oligodendrogliomas (LGOGs) achieve telomere maintenance via reactivation of the expression of telomerase reverse transcriptase (TERT), which is silenced in normal somatic cells [2]. Since TERT expression is linked to tumor proliferation, TERT can serve as a tumor biomarker [3] and studies also indicate that inhibiting TERT expression is a therapeutic strategy for gliomas [4]. However, non-invasive methods of imaging TERT are lacking. Deuterium (2H)-magnetic resonance spectroscopy (MRS) has recently emerged as a novel, clinically translatable method of monitoring metabolic fluxes in vivo [5]. However, to date, studies have solely examined 2H-glucose [5,6] and the use of other 2H-MRS agents has not been evaluated. The goal of this study was to identify MRS-detectable metabolic biomarkers of TERT expression that will enable non-invasive, 2H-MRS-based visualization of tumor burden in LGOGs and GBMs.METHODS
Cell studies: We examined 2 patient-derived LGOG models (SF10417 and BT88) and 1 patient-derived GBM model (GS2). SF10417 and BT88 cells were maintained in serum-free Neurocult media [7,8] while GS2 cells were maintained in Dulbecco’s modified Eagles medium [9]. TERT expression was silenced by RNA interference using two non-overlapping siRNA pools (Dharmacon). NADH levels were measured by spectrophotometry using a commercial kit (Abcam).MRI: Orthotopic tumors were generated by intracranial implantation of 1-3x10⁵ cells in female SCID mice [10]. Age-matched tumor-free mice were investigated as controls. MRI studies were performed on a vertical 14T scanner (Varian) using a 1H volume coil. When tumors reached a volume of ~60±20mm3, axial high-resolution T2-weighted MR images were recorded using a spin echo sequence (TE/TR=20/1200ms, FOV=30x30mm2, 256x256, Slice thickness=1mm, NA=2). Tumor contours were manually drawn and volume evaluated using in-house software [11].
2H-MRS/I in vivo: 2H-MRS/I studies were performed using a 16mm 2H surface coil (DOTY Scientific). A bolus of 450mg/kg [U-2H]pyruvic acid in isotonic buffer (50mM Tris-HCl, 1M NaOH, 0.3mM EDTA, pH 7) was injected via a tail-vein catheter over 1min. 2H-MR spectra were acquired using a non-selective pulse (TR=500ms, spectral width=2kHz, number of points=512, flip angle= 64º) and signal was averaged over a period of 4min. For spatial location of metabolite signals, a 2D chemical shift imaging (CSI) sequence with TE/TR=1.35/250ms, FOV=30x30mm2, 7x7, 128 points, 2.5kHz spectral width, number of averages=20 was used. 2H-MR spectra were analyzed by deconvolution using MestReNova and lactate levels normalized to semi-heavy water (HDO). Since release of HDO is expected to occur following administration of [U-2H]pyruvate, the area under the curve (AUC) for lactate was normalized to the ratio of post-injection HDO to pre-injection HDO. CSI data was analyzed using in-house Matlab codes and metabolic heatmaps of the signal-to-noise ratio (SNR) for lactate and ratio of lactate to post-injection HDO were derived.
Statistical analysis: All results are expressed as mean±standard deviation. Statistical significance was assessed using an unpaired two-tailed Student’s t-test with p<0.05 considered significant.
RESULTS AND DISCUSSION
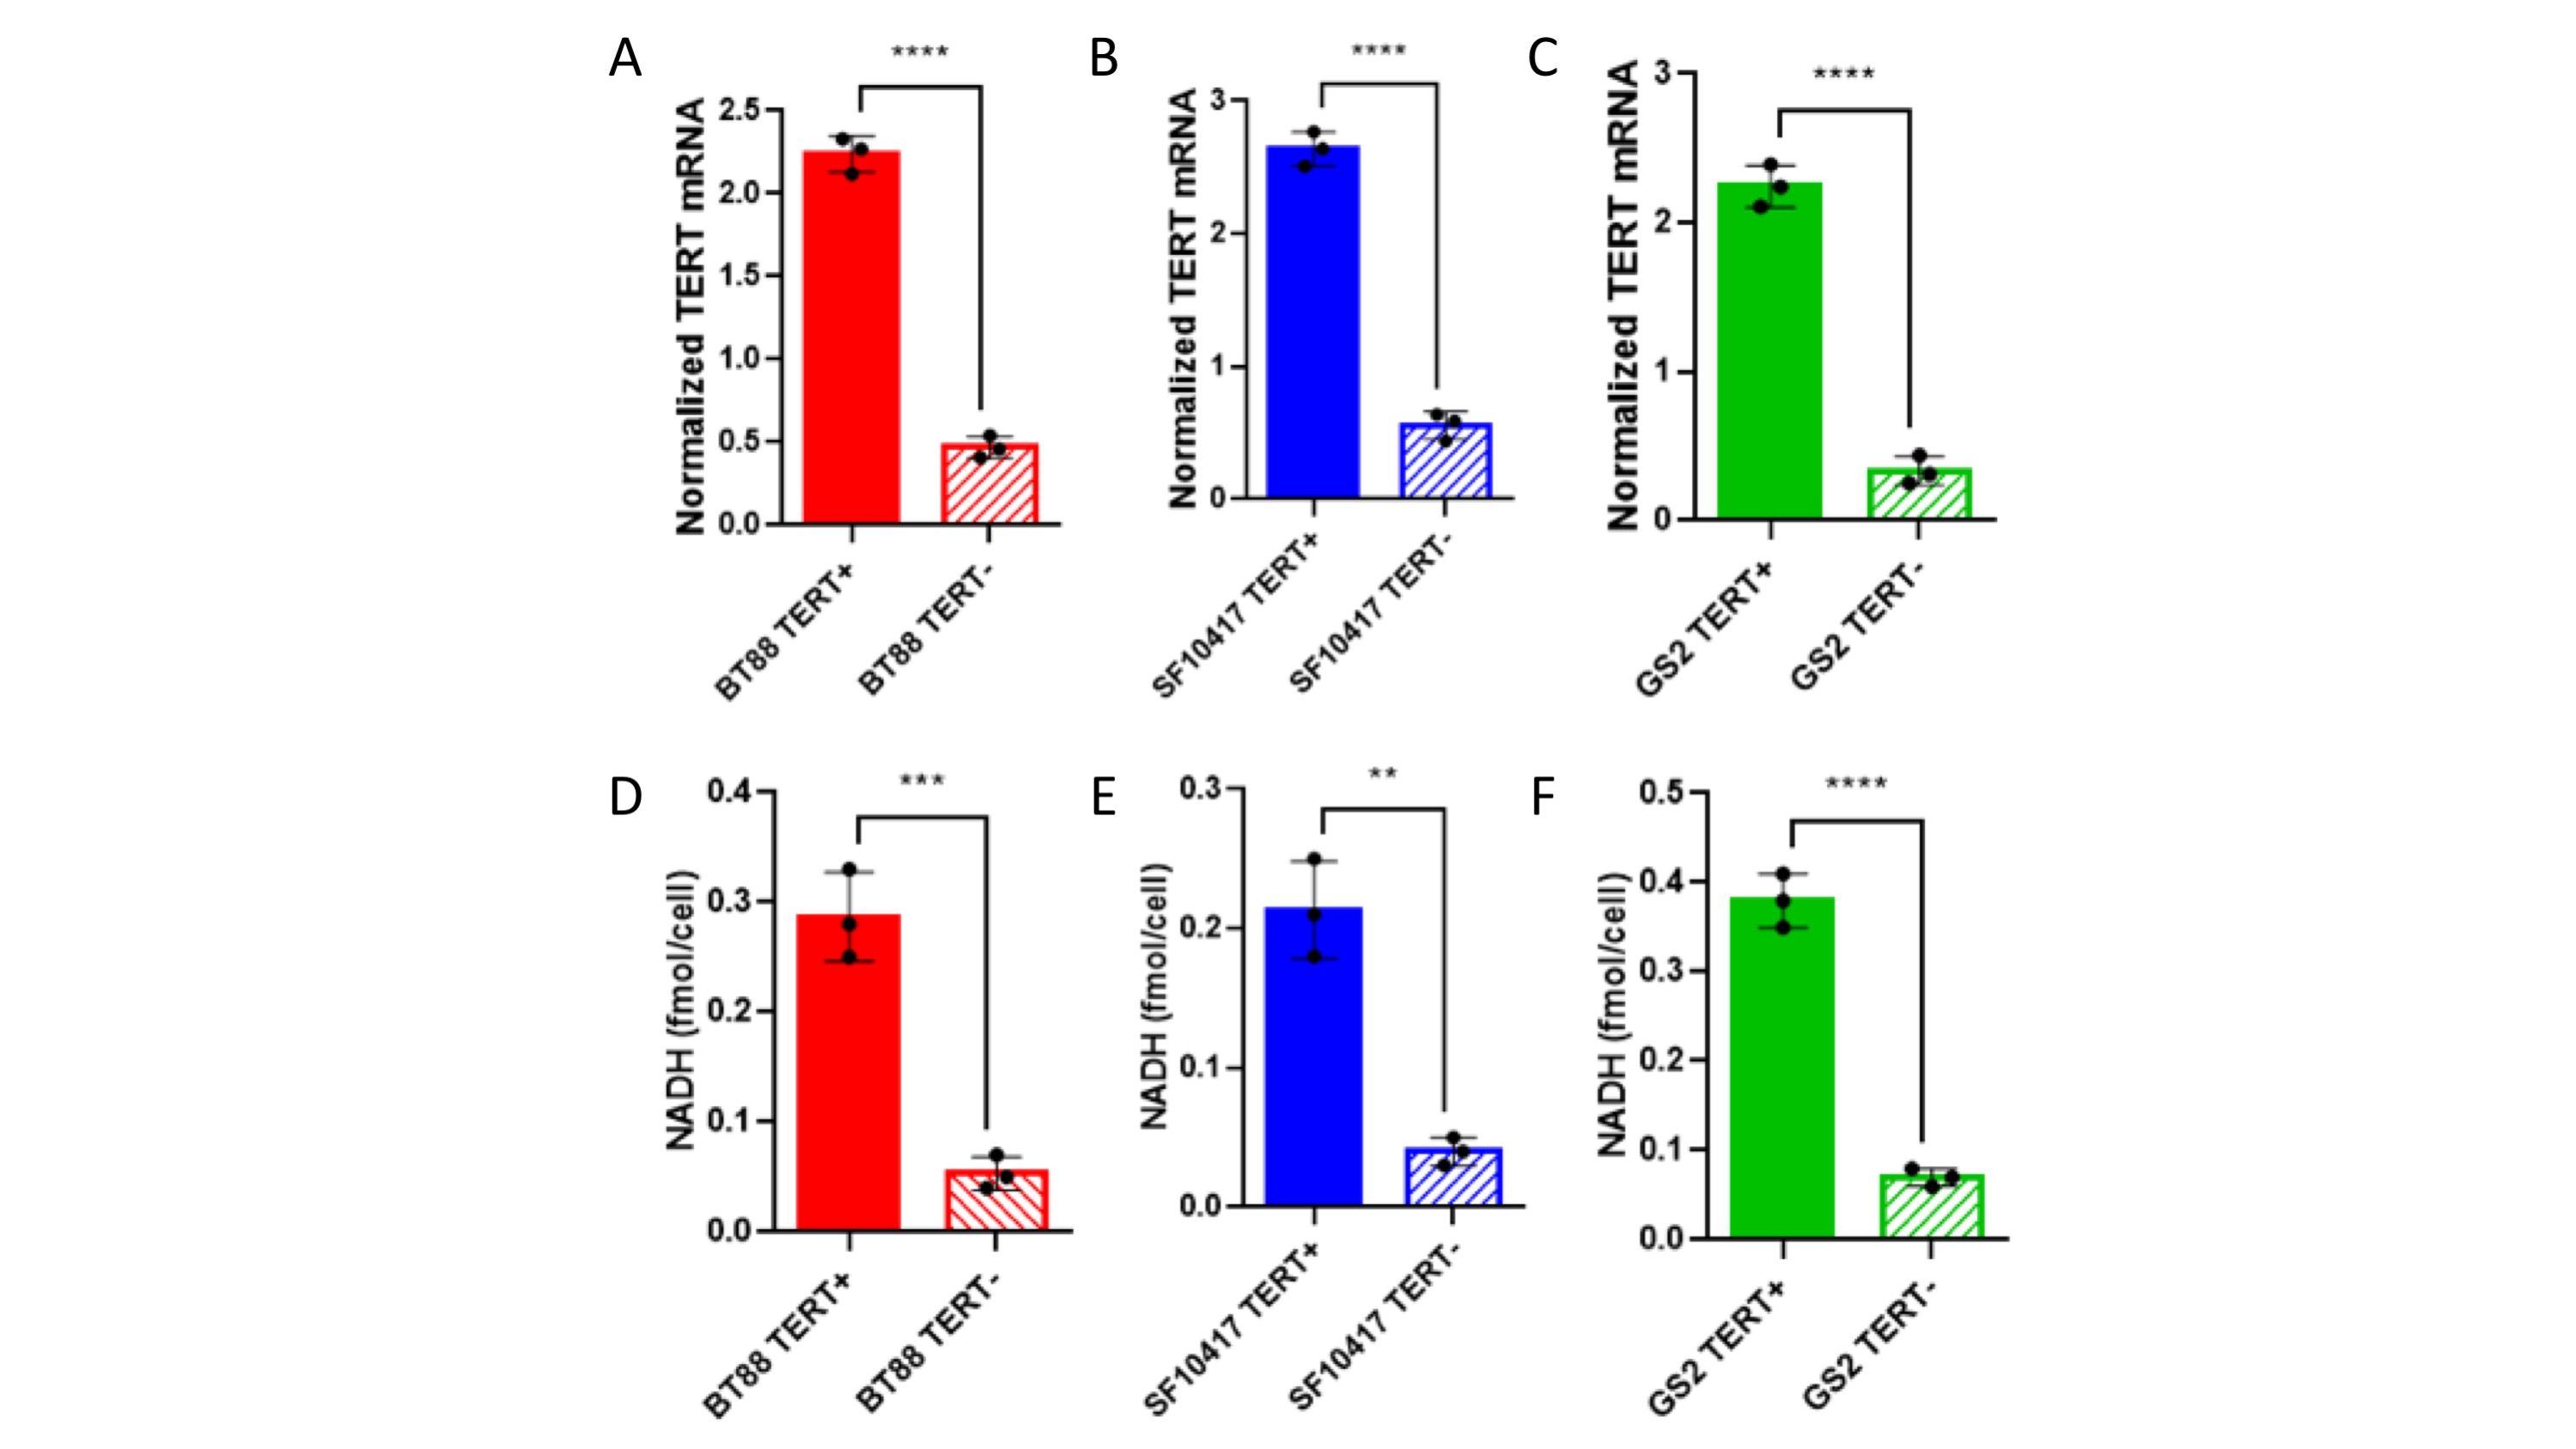
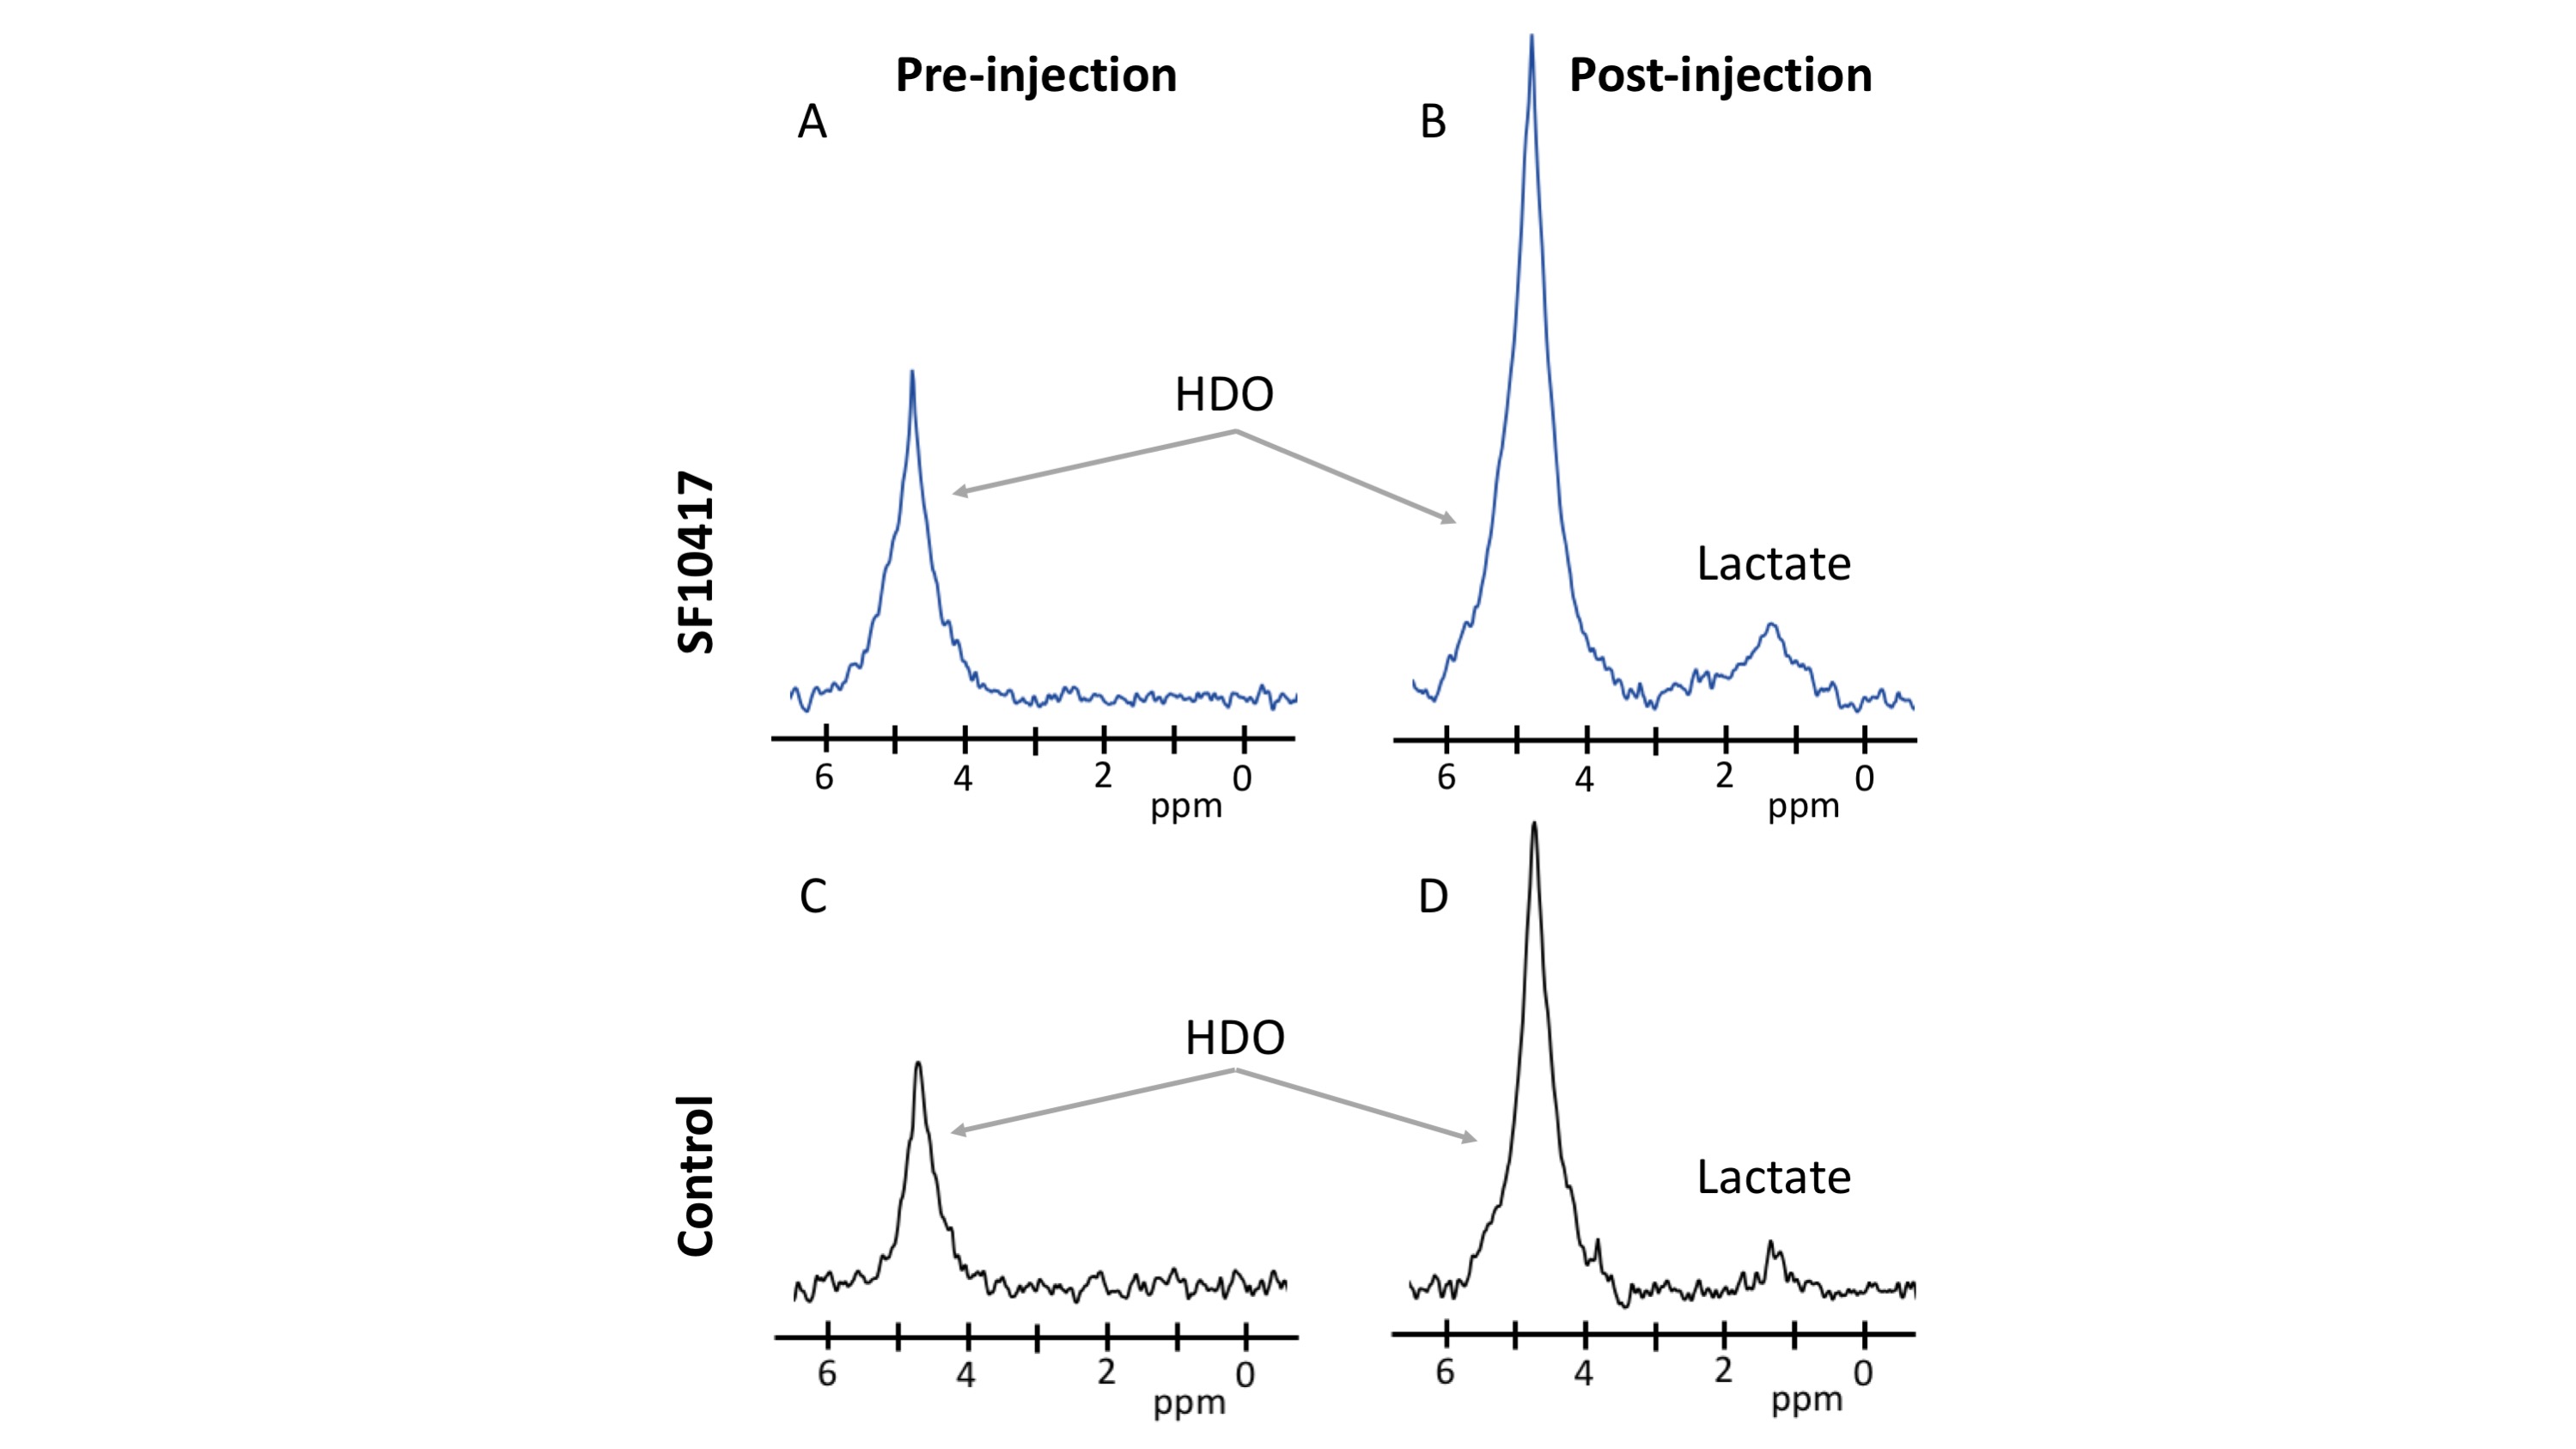
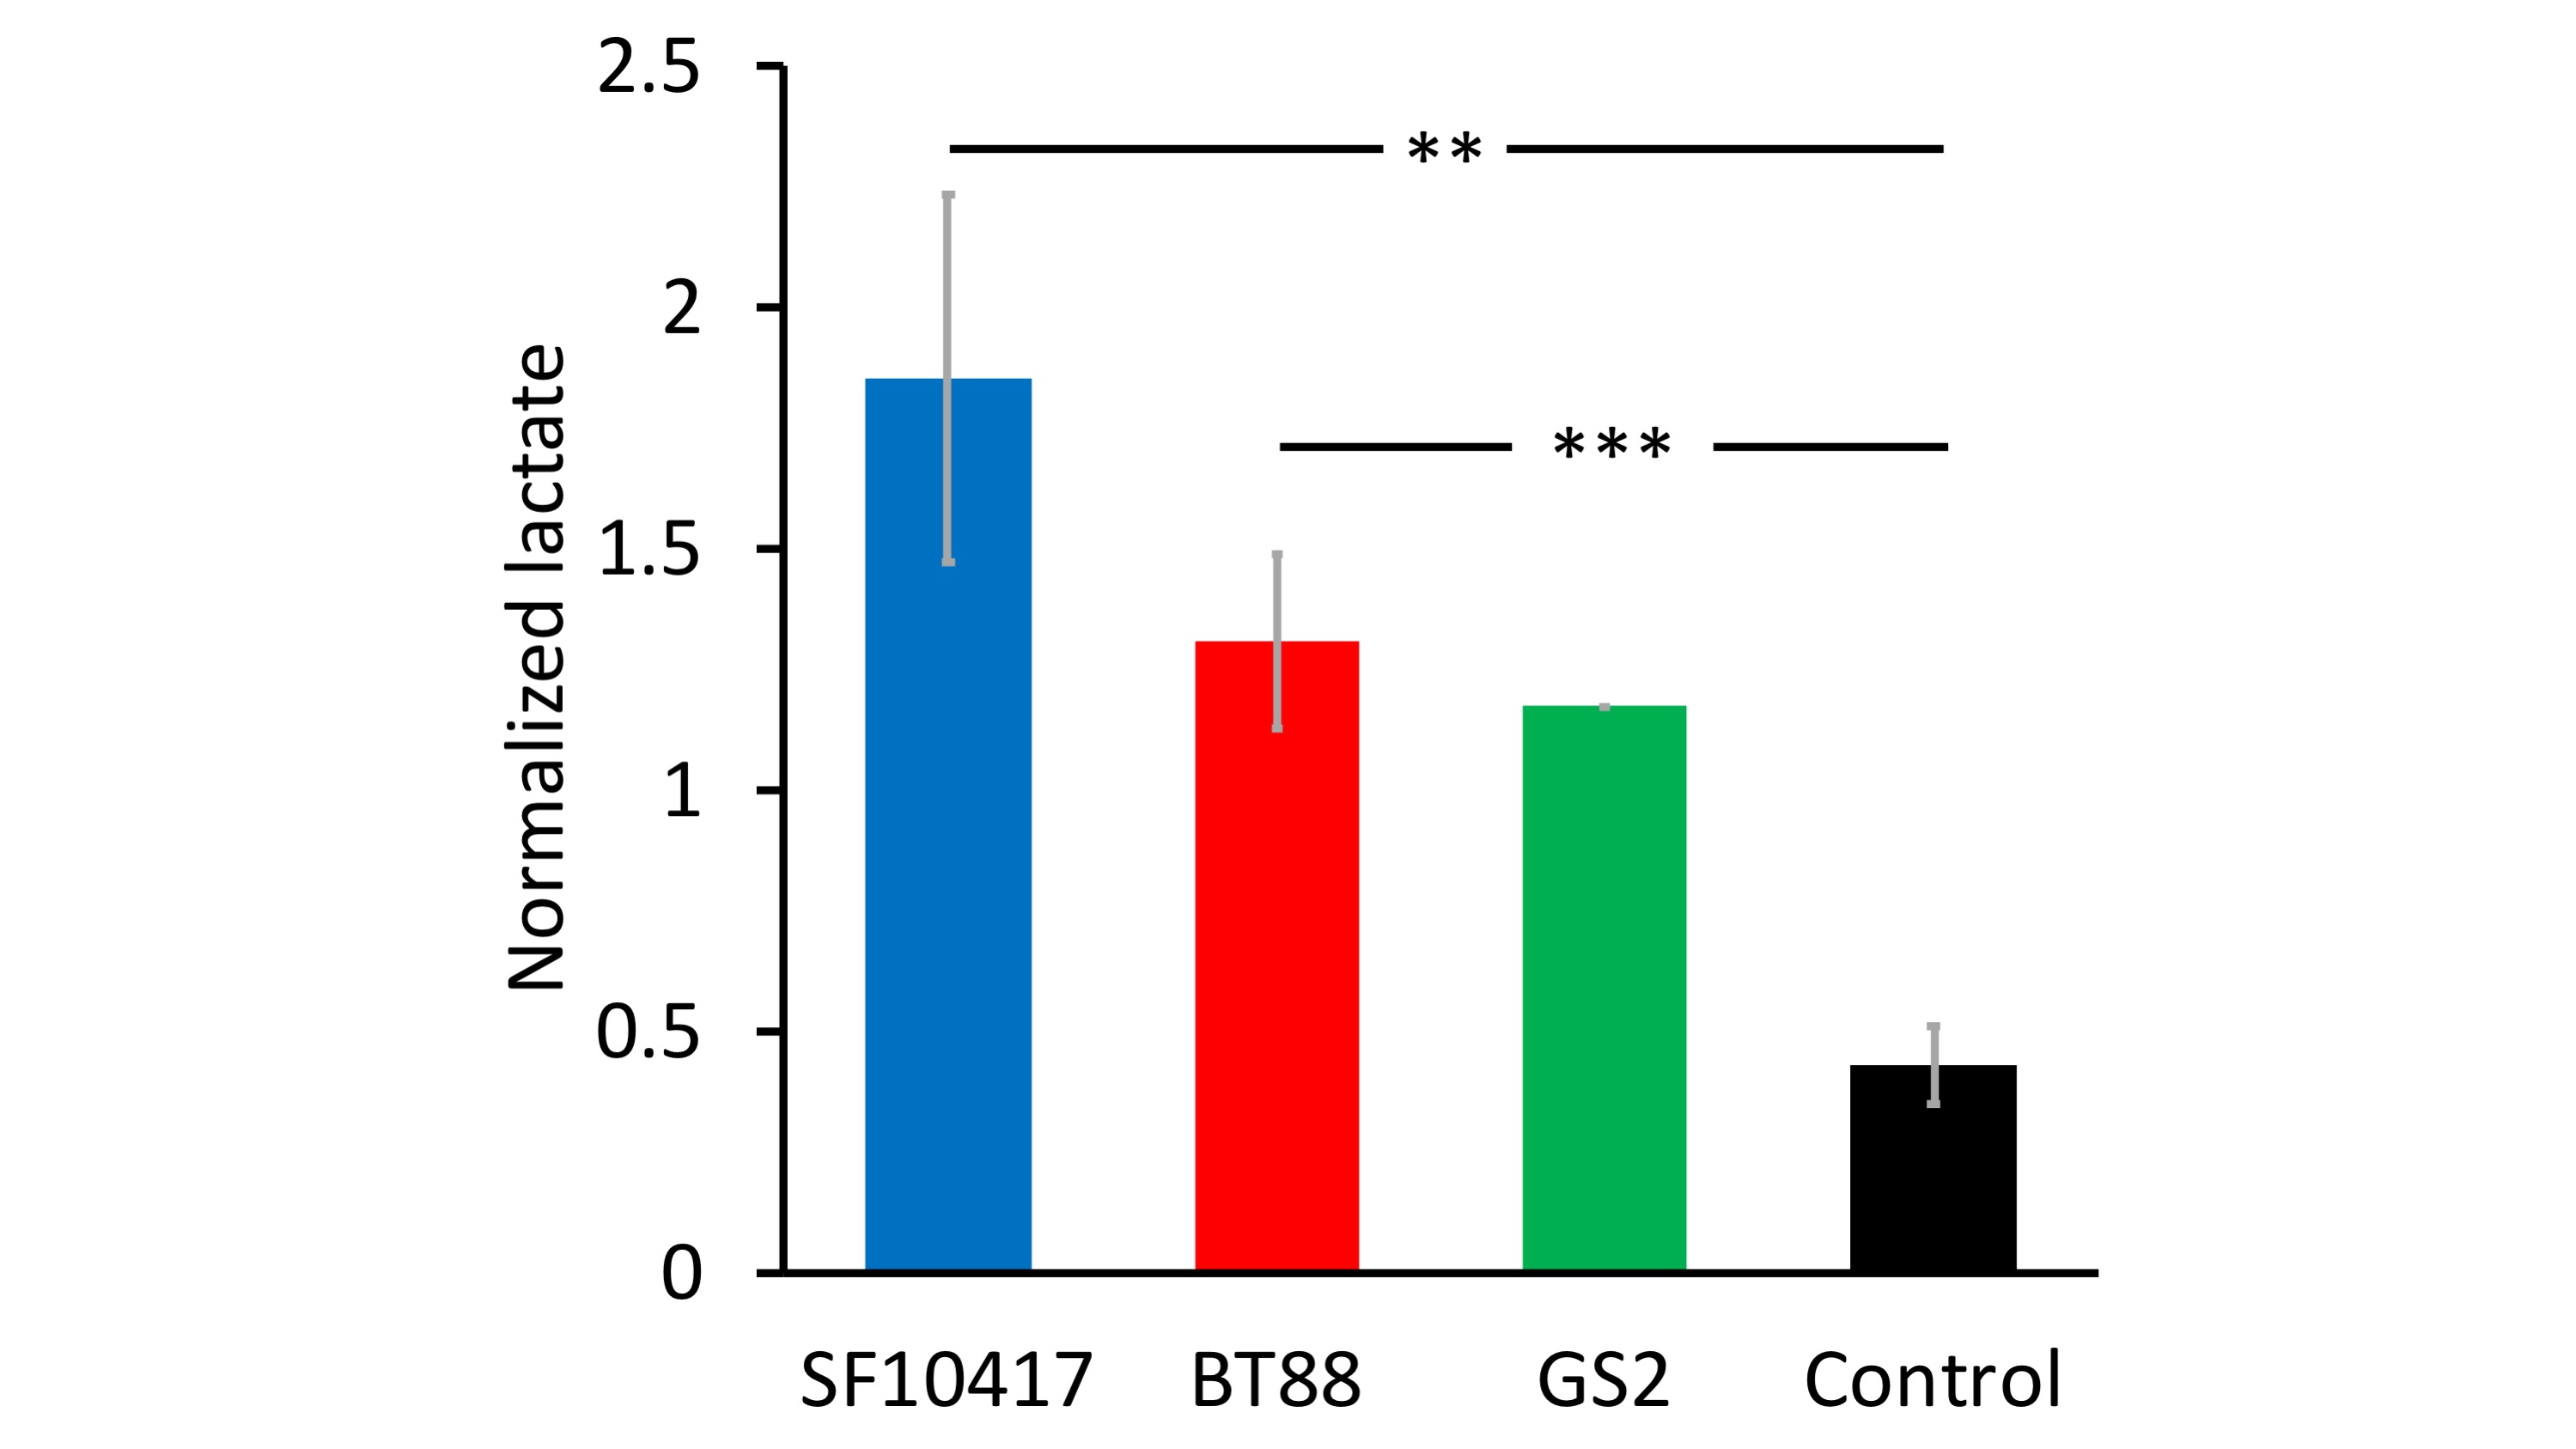
TERT expression is linked to NADH in LGOGs and GBMs: To identify metabolic alterations linked to TERT expression, we silenced TERT expression by RNA interference in the patient-derived LGOG (BT88, SF10417) and GBM (GS2) models (see Fig.1A-1C for confirmation of reduced TERT expression). As shown in Fig.1D-1F, TERT silencing significantly reduced (p<0.005) steady-state levels of NADH in all three models.[U-2H]pyruvate flux to lactate is a potential biomarker of TERT expression in LGOGs and GBMs: Based on the link between TERT expression and NADH (see Fig.1B) and the fact that NADH is essential for the conversion of pyruvate to lactate, we interrogated the ability of [U-2H]pyruvate flux to lactate to serve as a 2H-MRS-based biomarker of TERT status in vivo. Representative 2H-MR spectra acquired pre- and post-injection of a bolus of [U-2H]pyruvate in a mouse bearing an orthotopic SF10417 tumor (Fig.2A-2B) or in a tumor-free control (Fid.2C-2D) show higher levels of lactate production in the SF10417 tumor-bearing mouse. Importantly, as shown in Fig.3, quantification of normalized lactate levels revealed that lactate production was higher in mice bearing orthotopic LGOG (BT88 and SF10417) and GBM (GS2) tumor xenografts relative to tumor-free mice (p=0.001 for BT88 and p=0.006 for SF10417).
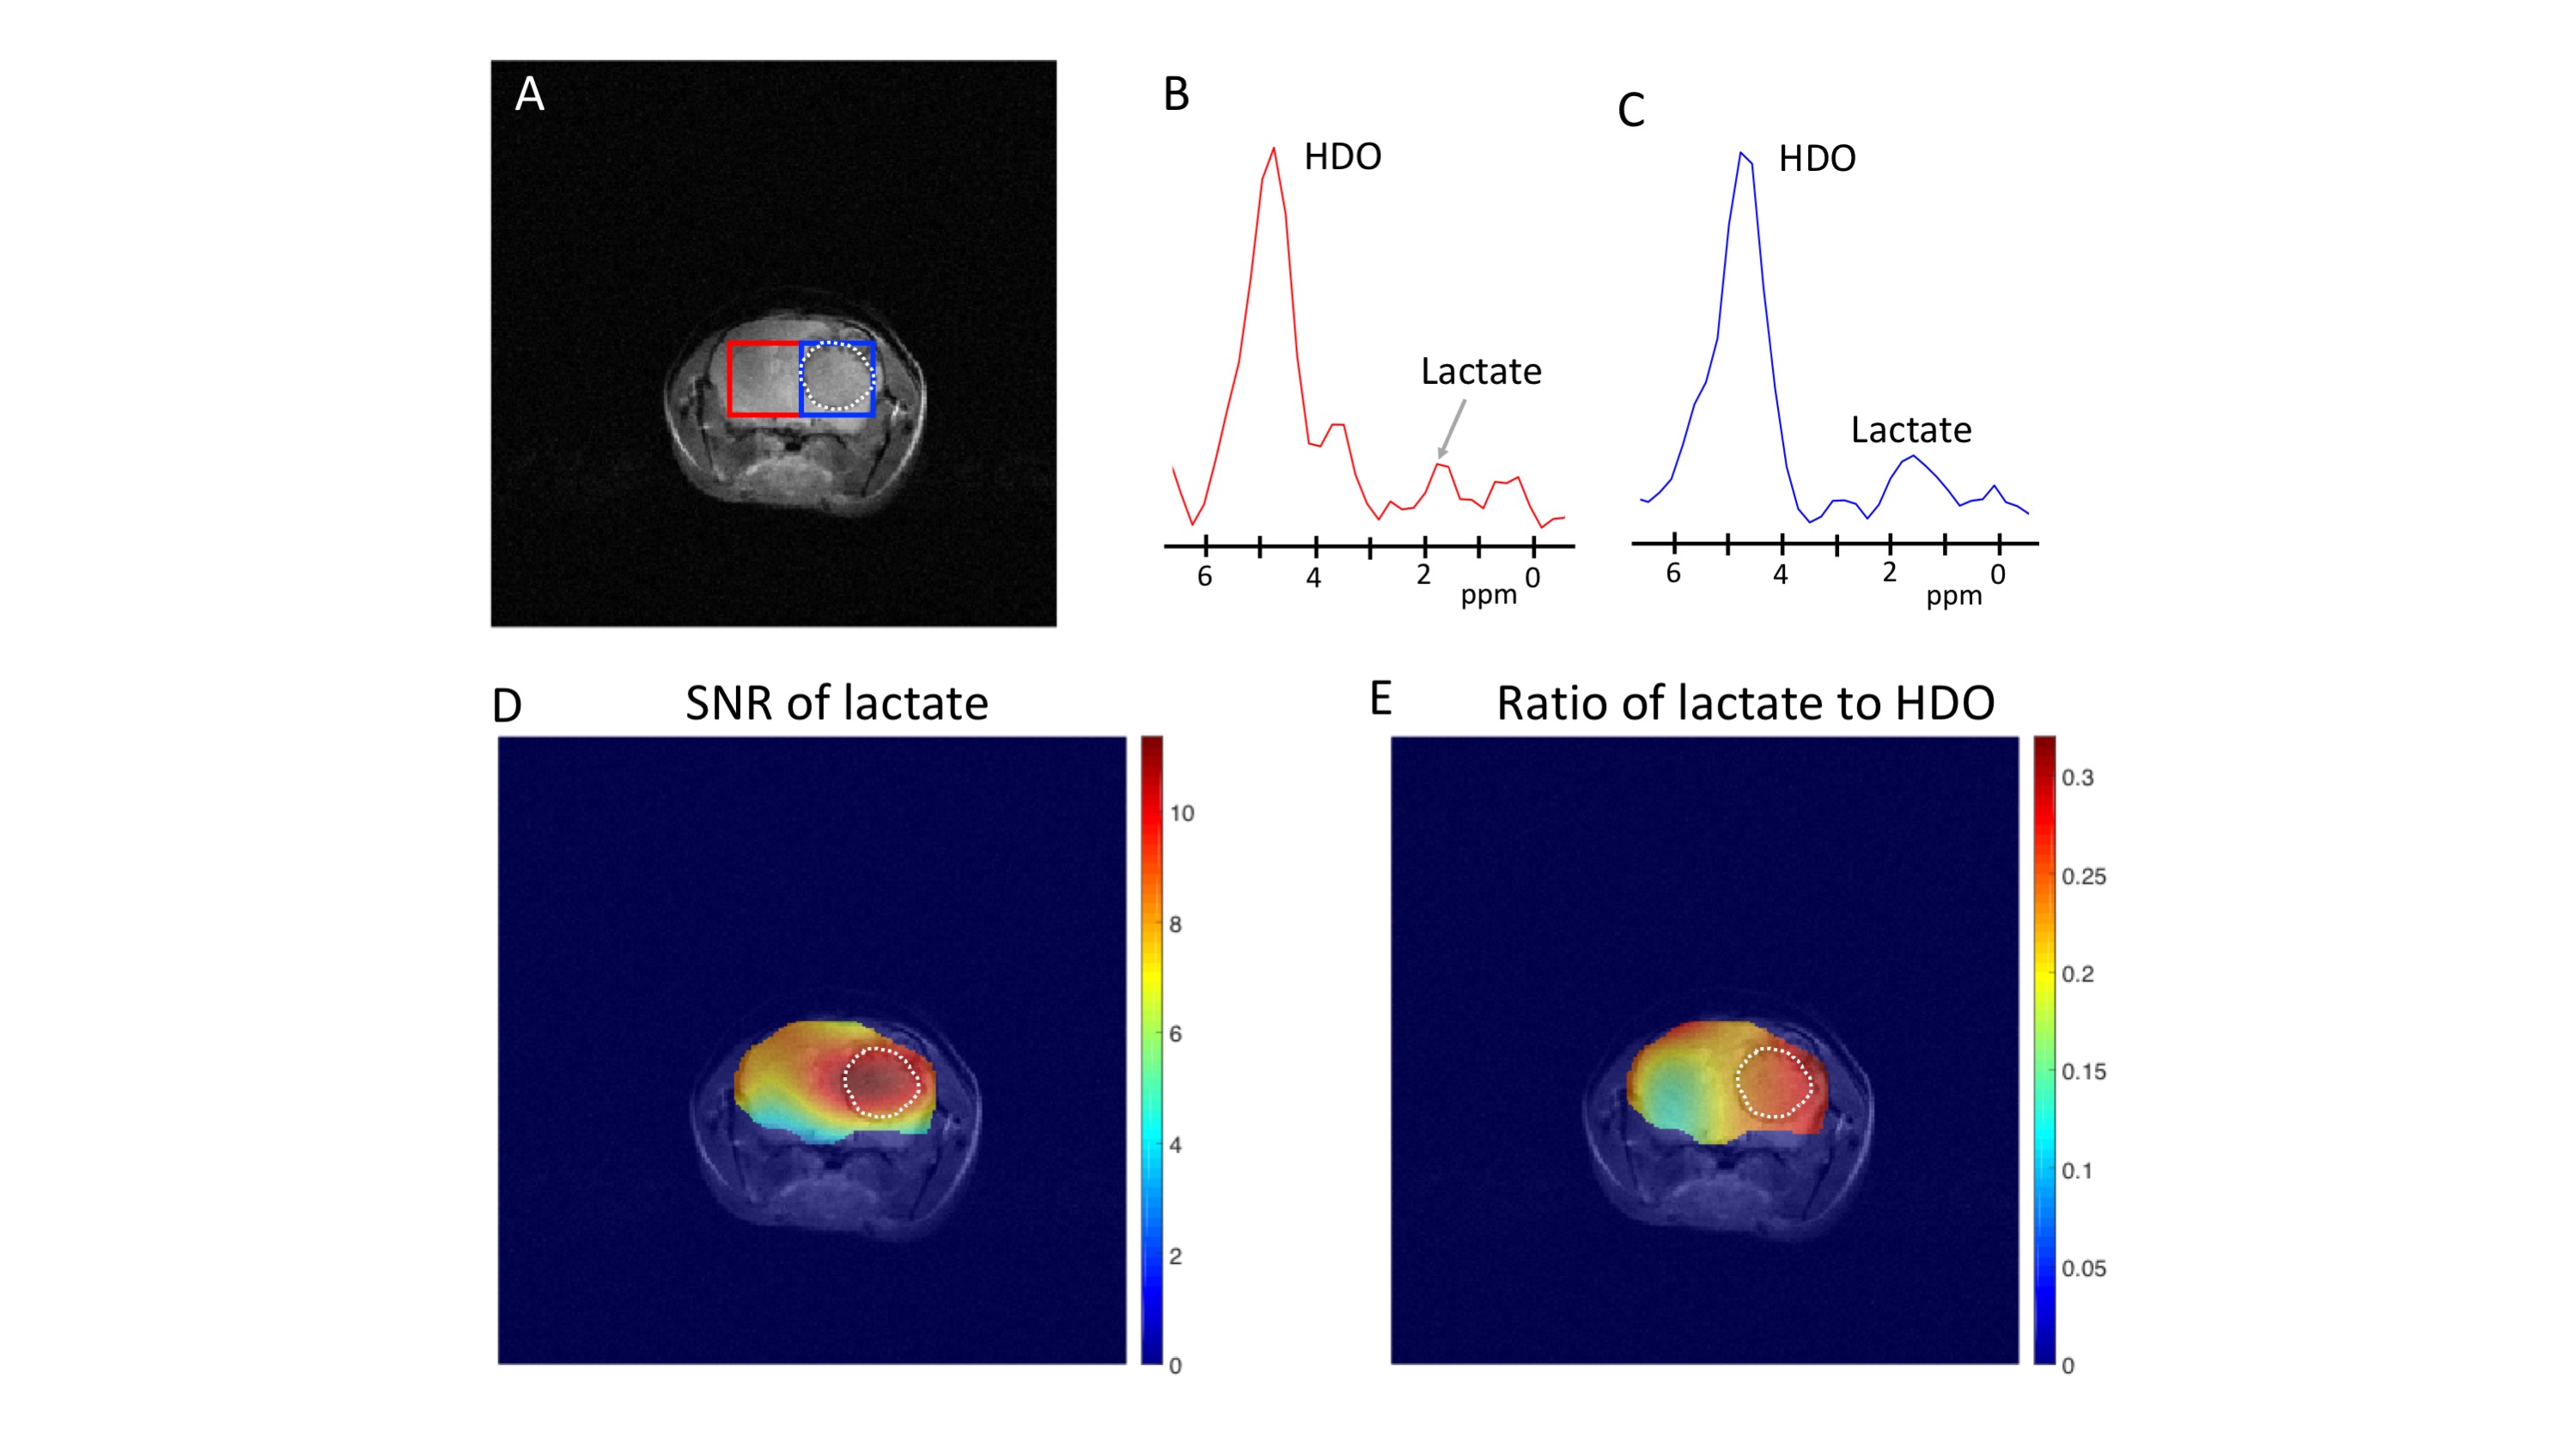
Having established that [U-2H]pyruvate has the potential to monitor TERT expression in vivo, we then performed 2D CSI studies in mice bearing orthotopic BT88 tumor xenografts in order to evaluate the spatial distribution of lactate production. As shown in Fig.4A-4C, consistent with the results from our non-localized 2H-MRS studies, lactate levels were higher in the tumor voxel relative to contralateral normal brain. Metabolic heatmaps of the SNR of lactate (Fig.4D) and lactate normalized to post-injection HDO (Fig.4E) confirmed spatial localization of lactate to the tumor region.
CONCLUSIONS
In summary, our study, for the first time, indicates that [U-2H]pyruvate has the potential to assess TERT expression in vivo in clinically relevant patient-derived LGOG and GBM models. Importantly, since 2H-MRS can be readily implemented on clinical scanners with minimal modifications to hardware, our findings can be rapidly translated to the clinic and provide a novel, non-radioactive and non-invasive method of integrating information regarding a fundamental cancer hallmark, i.e. TERT, into glioma patient management.Acknowledgements
This study was supported by NIH R01CA239288 and Department of Defense W81XWH201055315.References
[1] Hanahan and Weinberg, Hallmarks of Cancer: The Next Generation, Cell 144 (2011)
[2] Bell et al, Understanding TERT Promoter Mutations: A Common Path to Immortality, Mol Cancer Res 14:4 (2016)
[3] Cagney D et al, The FDA NIH Biomarkers, EndpointS, and other Tools (BEST) resource in neuro-oncology, Neuro-Oncology 20 (2018)
[4] Mancini A et al, Disruption of the β1L Isoform of GABP Reverses Glioblastoma Replicative Immortality in a TERT Promoter Mutation-Dependent Manner, Cancer Cell 34 (2018)
[5] De Feyter M et al, Deuterium metabolic imaging (DMI) for MRI-based 3D mapping of metabolism in vivo, Science Advances (2018)
[6] Kreis F et al, Measuring Tumor Glycolytic Flux in Vivo by Using Fast Deuterium MRI, Radiology 293:1 (2019)
[7] Jones LE et al, Patient-derived cells from recurrent tumors that model the evolution of IDH-mutant glioma, Neurooncol Adv. 2(1) (2020)
[8] Kelly J et al, Oligodendroglioma cell lines containing t(1;19)(q10;p10), Neuro-Oncology, 12 (7): 745–755 (2010)
[9] Hashizume R et al, A human brainstem glioma xenograft model enabled for bioluminescence imaging, J Neurooncol. 96(2): 151–159 (2010)
[10] Batsios G et al, PI3K/mTOR inhibition of IDH1 mutant glioma leads to reduced 2HG production that is associated with increased survival, Sci Report 9 (2019)
[11] Nelson SJ. Analysis of volume MRI and MR spectroscopic imaging data for the evaluation of patients with brain tumors, Magn Reson Med (2001)
Figures