0016
Delayed mapping of 2H-labeled choline using Deuterium Metabolic Imaging (DMI) reveals active choline metabolism in rat glioblastoma.1Department of Radiology and Biomedical Imaging, Yale University, New Haven, CT, United States, 2Department of Psychiatry, Yale University, New Haven, CT, United States, 3Department of Radiology and Biomedical Imaging, Yale University, NEW HAVEN, CT, United States, 4Department of Biomedical Engineering, Yale University, New Haven, CT, United States
Synopsis
Previously we reported high tumor uptake of exogenous choline in rodent brain tumor models when using Deuterium Metabolic Imaging (DMI) during intravenous infusion of [2H9]-choline. The small differences in chemical shifts of [2H9]-labeled choline, phosphocholine, glycerophosphocholine and betaine exclude accurate peak assignment, and therefore it is unclear whether blood-borne choline is metabolized intracellularly. Using different 2H-labeling strategies of choline and high resolution 2H NMR in tumor tissue extracts we identified the choline-containing metabolites observed during intravenous infusion, as well as after 24 hrs.
Introduction
For decades 1H MRS has been used to detect increased levels of total choline (tCho) in high grade brain tumors in vivo. This composite peak at ~3.2 ppm consists of overlapping signals from choline (Cho), phosphocholine (PC) and glycerophosphocholine (GPC). The increased level of tCho has often been attributed to a higher membrane turnover in growing tumors. Since Cho is an essential nutrient, growing tumors can also have increased capacity for Cho uptake from the blood. Accordingly, PET imaging of radiolabeled Cho has been used to study Cho uptake in various cancer types (1). Recently we described how deuterium metabolic imaging (DMI) showed strong image contrast between tumor and normal-appearing brain due to high uptake of blood-borne [2H9]-Cho, in rodent models of glioblastoma (2). However, similar to 1H MRS, the 2H MR spectral resolution is insufficient to differentiate [2H9]-labeled Cho metabolites. To what extent the plasma-borne Cho is metabolized by the tumor is therefore unknown. Here we further investigated the use of DMI and [2H9]-Cho in a rat glioblastoma model, relying on high resolution 2H NMR and alternatively 2H-labeled Cho to identify Cho metabolites in brain tumor tissue extracts.Methods
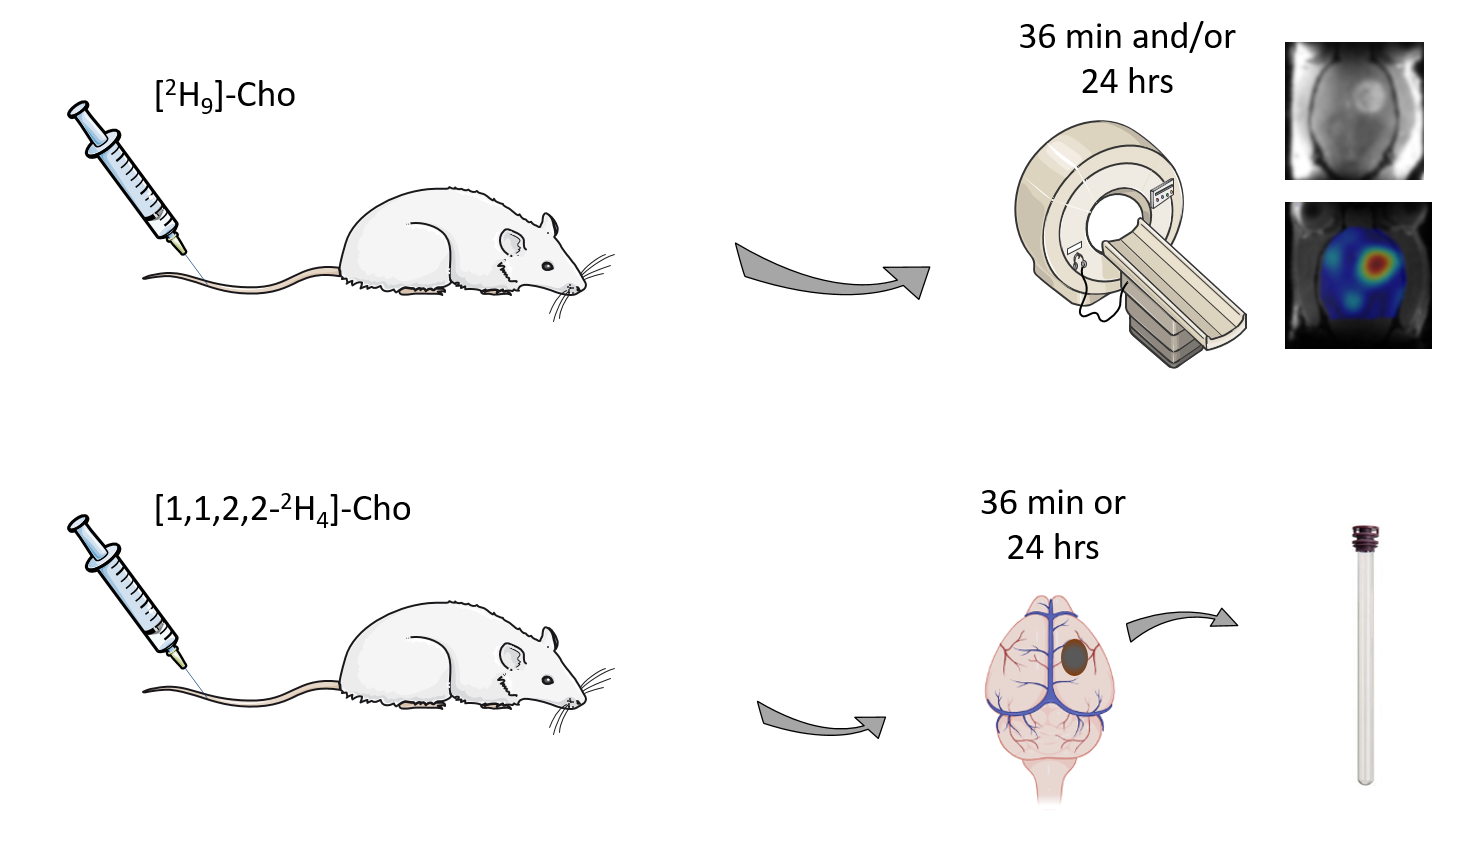
Rat glioma cells, RG2 (ATCC), were grown in T75 flasks using Dulbecco’s modified Eagle’s medium (DMEM) and standard cell culture conditions. Glioma-bearing rats were generated by intracerebral injection of RG2 cells (10,000 cells) in Fischer344 rats (n=8), as described previously (3). Animal studies were performed on an 11.74 T Magnex magnet (Magnex Scientific Ltd.) interfaced to a Bruker Avance III HD spectrometer running on ParaVision 6 (Bruker Instruments, Billerica, MA), as previously described (4). Glioma-bearing rats were infused intravenously via tail vein for ~36 min with [2H9]-choline chloride (Cambridge Isotopes Laboratories, Cambridge, MA), or [1,1,2,2-2H4]-choline chloride (CDN Isotopes, Quebec, Canada) dissolved in water (400 mM), using a bolus-continuous infusion protocol. DMI data were acquired during the [2H9]-Cho infusion, or 20-24 hrs later (Fig. 1). DMI acquisition was similar as described previously, except for the use of a 20x15mm2 2H surface coil, and 2.5x2.5x2.5mm3 spatial resolution (4). Infusion of [1,1,2,2-2H4]-Cho was performed as bench experiments only. All animals were euthanized using focused beam microwave fixation, brain and tumor tissue harvested, and metabolite extracts made using a perchloric acid extraction protocol, for analysis with high resolution 2H NMR. High-resolution 2H NMR scans were performed on a 500MHz Bruker Avance MR spectrometer equipped with a 5-mm probe optimized for 1H and broadband acquisitions, operating at 500.13 MHz (1H) and 76.77 MHz (2H). All 1H MRI and 2H DMI data, and high-resolution 2H NMR data were processed with home-written graphical user interfaces in Matlab (MathWorks, Natick, MA).Results
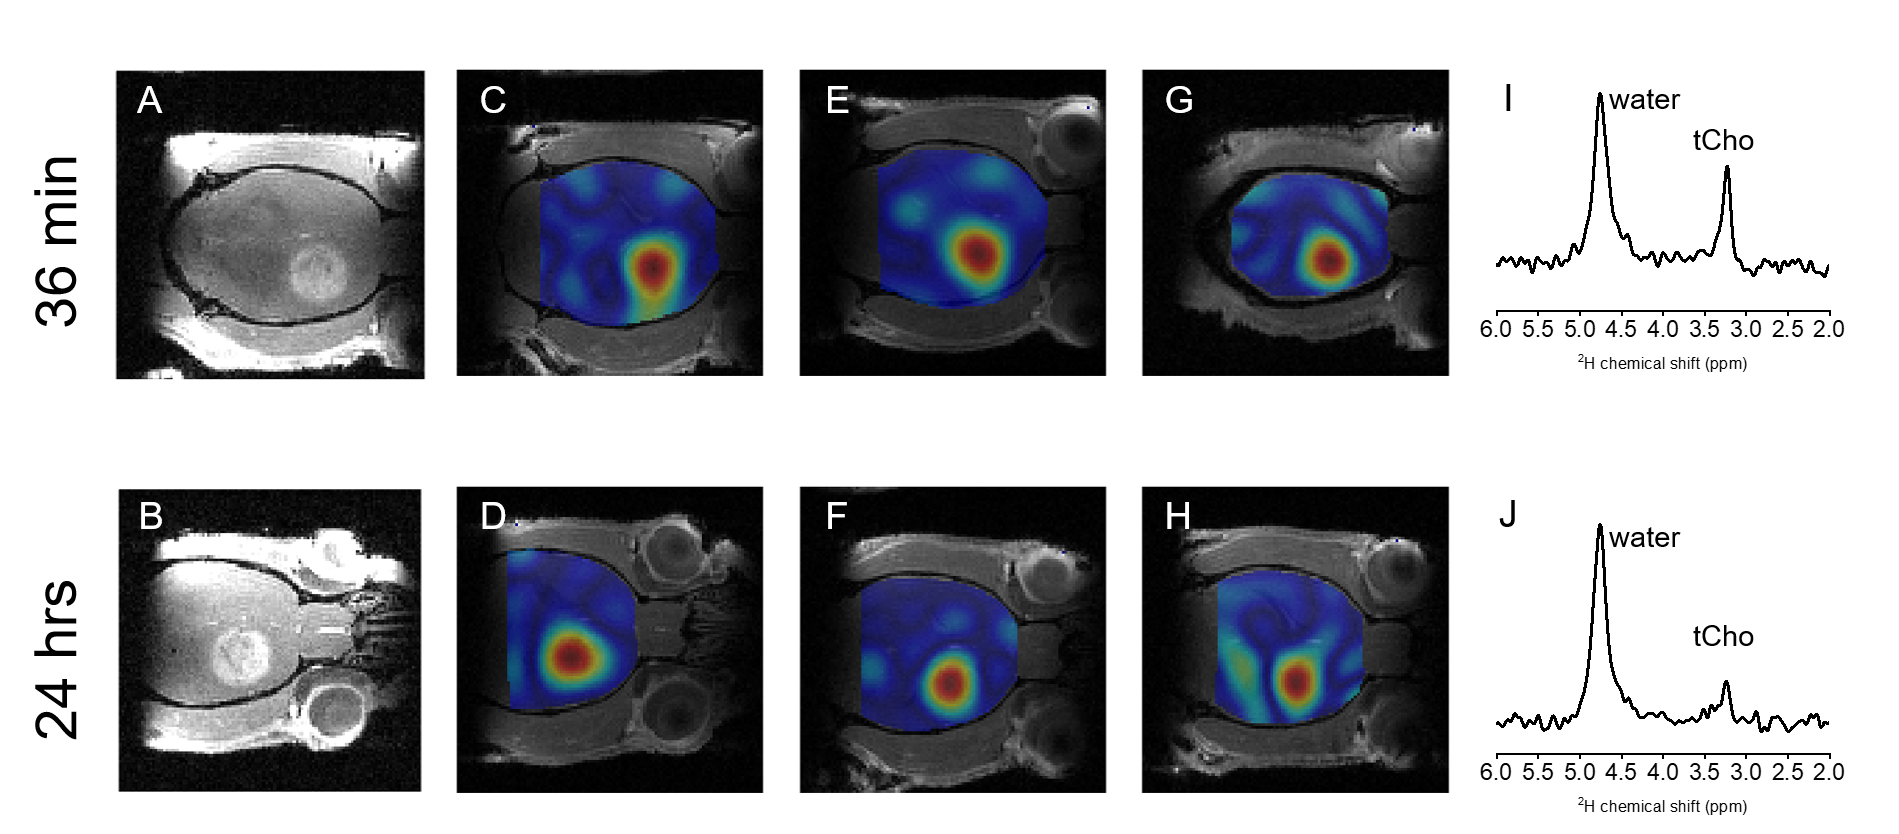
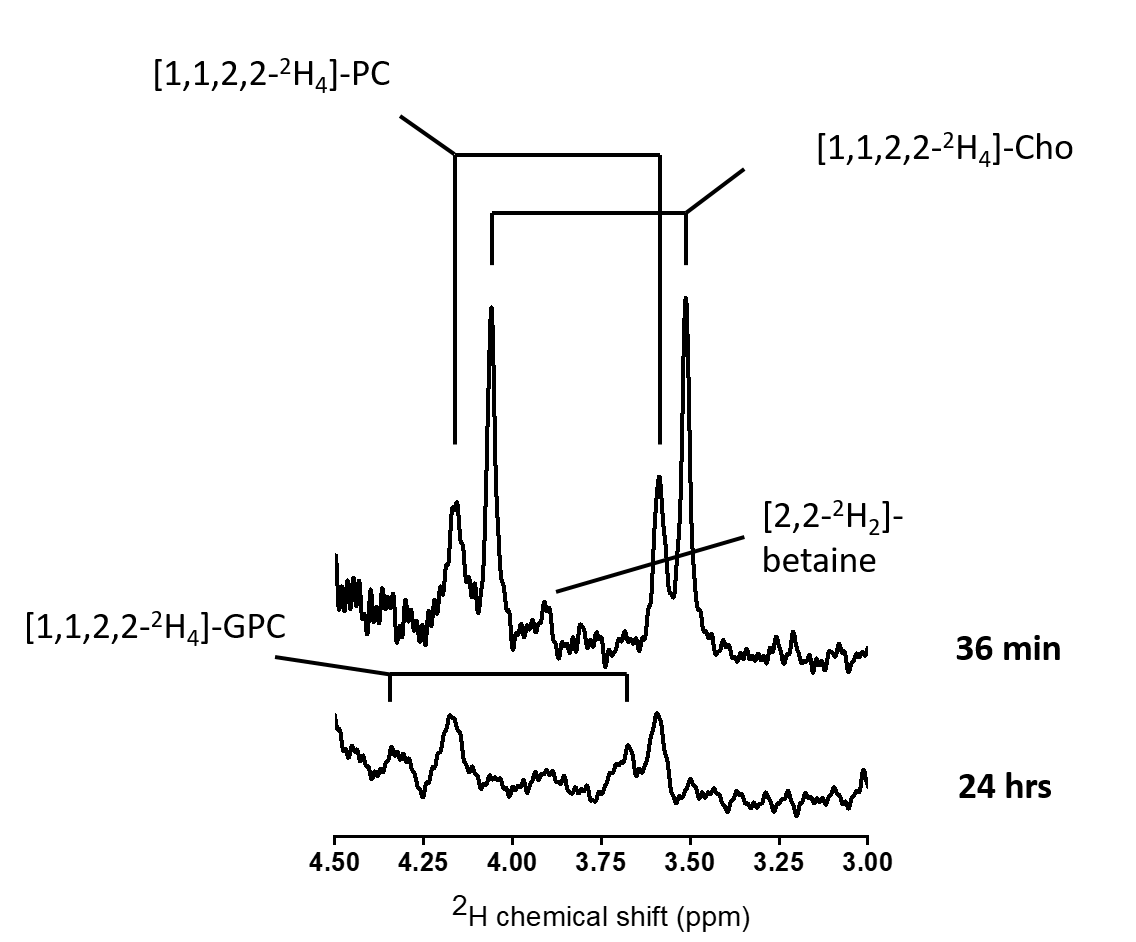
DMI data acquired both during, and 24 hrs after intravenous infusion of [2H9]-Cho demonstrate high uptake and retention of labeled Cho in brain tumor lesions of RG2-bearing rats (Fig. 2). The in vivo 2H MR spectra show a peak around 3.2 ppm, consistent with tCho, but does not allow for distinguishing individual resonances of Cho metabolites. Even in high resolution 2H NMR spectra of tumor metabolite extracts all the different Cho species cannot be identified unambiguously because of overlap of particularly PC and betaine. Using [1,1,2,2-2H4]-Cho provides the advantage to identify Cho species at different, less overlapping chemical shifts than the tri-methyl resonance of [2H9]-Cho. Figure 3 shows the 2H NMR spectra of different tumors harvested immediately after [1,1,2,2-2H4]-Cho infusion, and 24 hrs later. The limited spectral overlap of downfield resonances allows clear identification of Cho (3.50 and 4.06 ppm), PC (3.58 and 4.16 ppm), GPC (3.66 and 4.31 ppm), and a small peak likely from betaine (3.89 ppm). The data from acutely harvested tissue show both Cho and PC, indicating some level of Cho kinase activity within the first 36 min of Cho infusion. In the sample collected 24 hrs later, no free Cho is detected but PC and GPC are clearly present.Discussion and conclusion
Using DMI during infusion of [2H9]-Cho confirmed earlier results of high blood-borne Cho uptake in rodent models of glioblastoma, generating high image contrast with surrounding normal-appearing brain (2). Interestingly, even 24 hrs after a 36 min [2H9]-Cho infusion there is a strong signal of 2H-labeled tCho present in vivo. Detecting 2H-labeled tCho this late after the infusion could indicate that the peak consists predominantly of phosphorylated Cho that is trapped intracellularly, and thus point towards active metabolism of blood-borne Cho. The 2H NMR spectra from tissue extracts support this hypothesis, clearly showing a lack of free Cho but presence of PC and GPC 24 hrs after infusion. These data are in general agreement with the turnover rate of Cho metabolism as observed in glioma cells in vitro (5). While [1,1,2,2-2H4]-Cho facilitated the identification of different Cho metabolites, [2H9]-choline is the preferred 2H-labeled Cho for in vivo DMI studies.Using high-resolution 2H NMR allowed to show active metabolism of blood-borne Cho in rat glioblastoma. The 24 hrs delayed in vivo detection of [2H9]-tCho with DMI in glioblastoma reflects Cho metabolism, while DMI scans during [2H9]-Cho infusion are predominantly detecting Cho uptake. Intravenous choline chloride infusion is used clinically in patients receiving parenteral nutrition, indicating this DMI approach could be translated to the clinic (6).
Acknowledgements
The authors thank Xiaoxian Ma and Bei Wang for their assistance with animal preparation. This research was funded, in part, by NIH grant NIBIB R01-EB025840, and supported by a research grant program from Cambridge Isotope Laboratories.References
1. Dardel NT, Gómez-Río M, Triviño-Ibáñez E, Llamas-Elvira JM. Clinical applications of PET using C-11/F-18-choline in brain tumours: a systematic review. Clin. Transl. Imaging 2017;5:101–119 doi: 10.1007/s40336-016-0200-0.
2. Ip KL, Thomas MA, Khunte A, Behar KL, De Graaf RA, De Feyter HM. Mapping of exogenous choline uptake in brain tumors in vivo using Deuterium Metabolic Imaging (DMI). In: Proceedings of the ISMRM & SMRT Virtual Conference & Exhibition. ; 2020.
3. De Feyter HM, Behar KL, Rao JU, et al. A ketogenic diet increases transport and oxidation of ketone bodies in RG2 and 9L gliomas without affecting tumor growth. Neuro-Oncol. 2016;18:1079–1087 doi: 10.1093/neuonc/now088.
4. De Feyter HM, Behar KL, Corbin ZA, et al. Deuterium metabolic imaging (DMI) for MRI-based 3D mapping of metabolism in vivo. Sci. Adv. 2018;4:eaat7314 doi: 10.1126/sciadv.aat7314.
5. Viswanath P, Radoul M, Izquierdo-Garcia JL, et al. Mutant IDH1 gliomas downregulate phosphocholine and phosphoethanolamine synthesis in a 2-hydroxyglutarate-dependent manner. Cancer Metab. 2018;6:3 doi: 10.1186/s40170-018-0178-3.
6. Buchman AL, Jenden DJ, Moukarzel AA, et al. Choline pharmacokinetics during intermittent intravenous choline infusion in human subjects. Clin. Pharmacol. Ther. 1994;55:277–283 doi: 10.1038/clpt.1994.28.
Figures