0015
Radiomics-based CEST image analysis for improved performance of brain tumor grading1Key Laboratory for Biomedical Engineering of Ministry of Education, Department of Biomedical Engineering, College of Biomedical Engineering & Instrument Science, Zhejiang University, Hangzhou, Zhejiang, China, 2Department of Radiology, Children’s Hospital, Zhejiang University School of Medicine, Hangzhou, Zhejiang, China, 3Department of Neurosurgery, Children’s Hospital, Zhejiang University School of Medicine, Hangzhou, Zhejiang, China, 4Philips Healthcare, Shanghai, China
Synopsis
CEST imaging can detect proteins and metabolites in vivo and has been successfully applied to brain tumor grading. In this work, we implemented a radiomic analysis of the APTw images, which were acquired from 40 patients with 20 confirmed high-grade brain tumors and 20 confirmed low-grade tumors. We established predictive models, assessed their performance, and compared them with conventional average APTw image intensities. The average sensitivity and AUC of the selected radiomic feature models for tumor grading were significantly higher than that of conventional mean APTw signals, demonstrating the advantage of radiomics for diagnosing brain tumors.
Introduction
Chemical exchange saturation transfer (CEST) imaging is an emerging MRI technique that can detect proteins and metabolites in vivo (1,2). Amide proton transfer (APT) imaging is a subtype of the CEST technique, which measures a bulk water signal reduction at 3.5ppm downfield due to its chemical exchange with amide protons (3). Studies have shown that the average APT-weighted (APTw) image intensities acquired from high-grade tumors were significantly higher than those from low-grade tumors, demonstrating the clinical potential of APT MRI (3,4). Radiomics is the process of converting regular medical images into mineable high-dimensional data (5), extracting semantic and/or agnostic features that may not be perceivable by human eyes. In this work, we implemented a radiomic analysis of APTw images and demonstrated its advantage for discriminating high-grade and low-grade brain tumors.Methods
Data Acquisition: Forty pediatric patients (5.7 ± 4.4 years old) were enrolled in the experiments, including 20 cases with confirmed high-grade brain tumors and 20 with low-grade brain tumors. All the experiments were performed on a 3T Philips Achieva scanner with the following scanning parameters: RF saturation power/duration = 2uT/0.8 sec, TR/TE = 3000/6.7 ms, FOV = 186 x 230 mm2, slice thickness = 6mm, 63 frequency offsets from -6 to 80ppm, and total acquisition duration = 3.2 min. The APTw image was calculated by subtracting the reference signal at -3.5ppm from the label signal at +3.5ppm with MTR asymmetry (MTRasym) analysis (6).Semi-automatic Habitat Definition: The region of interest (ROI) encircling the whole tumor was initially drawn by an experienced radiologist. Then, an automatic ROI-shrinking algorithm was used to choose sub-regions with signals greater than a histogram threshold (7). In our experiments, we generated four sets of ROIs (using 0th, 20th, 50th, and 80th percentile of the histogram as the cutoff), and calculated the mean APTw signals within the ROIs.
Radiomics Feature Extraction: For each tumor volume inside the automatically-generated ROI, a total number of 465 features were extracted using Pyradiomics (8). The feature set included 10 two-dimensional shape features, 18 first-order statistical features, 22 GLCM features, 16 GLRLM features, 16 GLSZM features, 14 GLDM features, and 5 NGTDM features. The first-order statistical features and the texture features were extracted from the original images and four wavelet-transformed images. The values of each feature were mapped to 0 – 1 by Min-Max normalization.
Feature Selection and Modelling: A feature selection method with 5-fold stratified cross-validation was implemented. A recursive feature elimination (RFE) method was implemented on the training set by fitting a logistic regression model, removing the most irrelevant feature, and assessing the performance of the remaining feature set recursively. Only the three top-ranked features were selected at the end of each RFE process, and the average APTw signal was added as a mandatory fourth feature in order to improve the generalizability of the model. Based on the selected features, we trained support vector machine (SVM) classifiers for grading tumors. The parameters of the SVM classifiers (including the kernel function, kernel function parameters, and regularization parameter) were optimized by a grid search to achieve the best performance on the training set. The trained model was then evaluated on the test set, with the average sensitivity, specificity, and area under the receiver operating characteristic curve (AUC) calculated. The process of feature selection with 5-fold stratified cross-validation was repeated 100 times with the 5-fold data partition randomly shuffled, and the pooled results were statistically tested with IBM SPSS Statistics v27. The best feature set was identified according to the frequency distribution of top-ranked features generated during feature selection (9).
Results
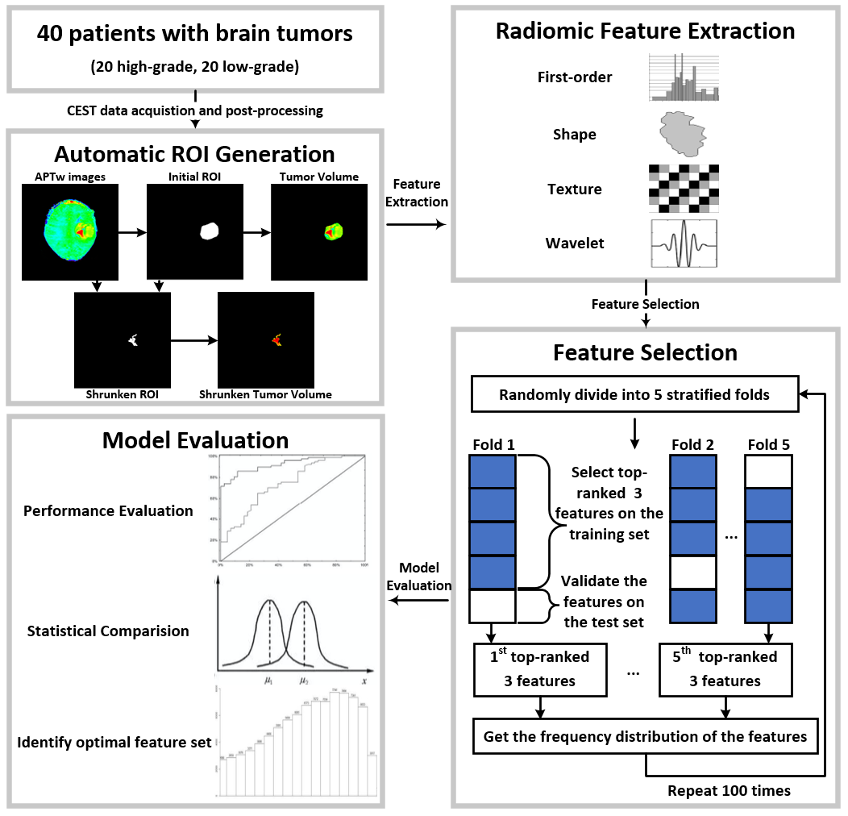
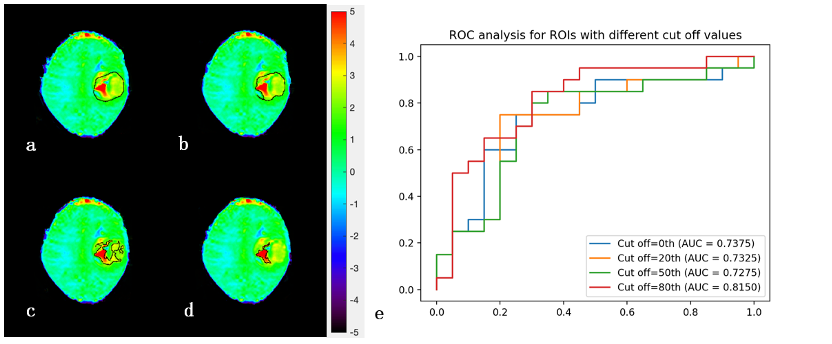
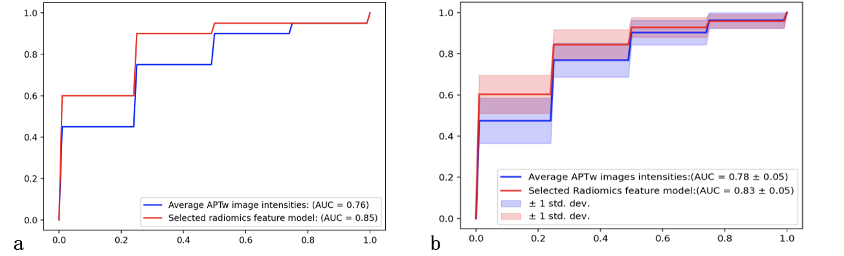
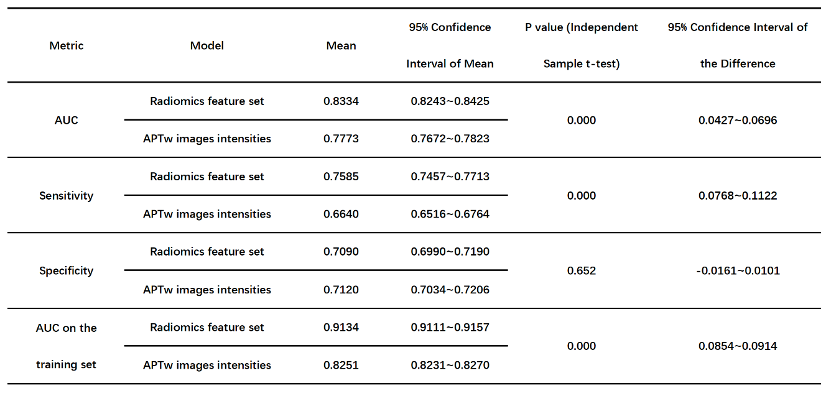
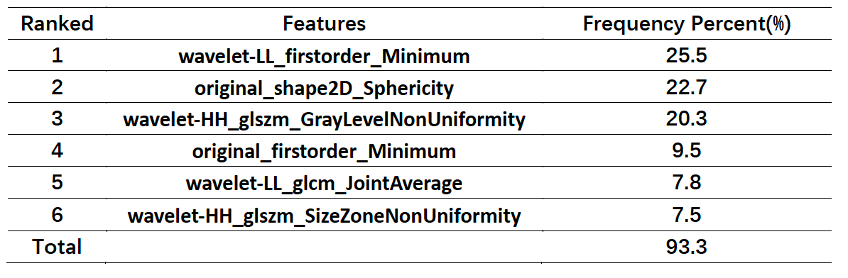
Fig. 1 illustrates the whole process of this work, including data enrollment, automatic ROI definition, feature extraction, feature selection and model evaluation. The performance of tumor grading using mean APTw signals within four different ROIs was assessed (Fig. 2). As the histogram cutoff increased, the final ROI kept shrinking. The ROI with a histogram cutoff of 80% achieved the best performance, and thus was used in the following results. The ROC curves using top-ranked four radiomic features (red line) and only the conventional mean APTw signal (blue line) in a representative 5-fold cross-validation run are shown in Fig. 3a, illustrating the advantage of radiomics. This comparison was confirmed by 100 runs of 5-fold stratified cross-validation (Fig. 3b). In the pooled cross-validation results, the AUC and sensitivity of brain tumor grading achieved by the selected radiomic feature models were significantly higher than that from mean APTw signals (p=0.000), while the specificity did not exhibit significant statistical difference (p=0.652). Notably, the radiomic features also better explained (AUC=0.9134 vs. 0.8251) the training data than the mean APTw signal. Finally, the most frequent top-ranked features are shown in Fig. 5.Discussion and Conclusion
Currently, most studies used mean APTw signals in various ROIs for grading in the APT MRI field. To the best of our knowledge, this is the first study that implemented a radiomic analysis of APTw images for grading brain tumors. The results demonstrated that the performance of the radiomic models was significantly (p=0.000) better than the conventional mean APTw signals. In conclusion, radiomics-based analysis of APTw images may facilitate the diagnosis and management of brain tumors.Acknowledgements
NSFC grant number: 81971605, 61801421.References
1. Van Zijl PC, Yadav NN. Chemical exchange saturation transfer (CEST): what is in a name and what isn't? Magnetic resonance in medicine. 2011;65(4):927-948.
2. Ward K, Aletras A, Balaban RS. A new class of contrast agents for MRI based on proton chemical exchange dependent saturation transfer (CEST). Journal of magnetic resonance. 2000;143(1):79-87.
3. Zhou J, Zhu H, Lim M, Blair L, Quinones‐Hinojosa A, Messina SA, Eberhart CG, Pomper MG, Laterra J, Barker PB. Three‐dimensional amide proton transfer MR imaging of gliomas: initial experience and comparison with gadolinium enhancement. Journal of Magnetic Resonance Imaging. 2013;38(5):1119-1128.
4. Zhou J, Lal B, Wilson DA, Laterra J, van Zijl PC. Amide proton transfer (APT) contrast for imaging of brain tumors. Magnetic Resonance in Medicine: An Official Journal of the International Society for Magnetic Resonance in Medicine. 2003;50(6):1120-1126.
5. Gillies RJ, Kinahan PE, Hricak H. Radiomics: images are more than pictures, they are data. Radiology. 2016;278(2):563-577.
6. Zhou J, Blakeley JO, Hua J, Kim M, Laterra J, Pomper MG, van Zijl PC. Practical data acquisition method for human brain tumor amide proton transfer (APT) imaging. Magnetic Resonance in Medicine: An Official Journal of the International Society for Magnetic Resonance in Medicine. 2008;60(4):842-849.
7. Liu R, Wang X, Wen Z, Liu T, Zhou J, Wu D, and Zhang Y. Comparison of Different CEST Metrics for Brain Tumor Grading with Semi-Automatic ROIs. ISMRM(2019):3992.
8. Van Griethuysen JJ, Fedorov A, Parmar C, Hosny A, Aucoin N, Narayan V, Beets-Tan RG, Fillion-Robin J-C, Pieper S, Aerts HJ. Computational radiomics system to decode the radiographic phenotype. Cancer research. 2017;77(21):e104-e107.
9. Zhang H, Tan S, Chen W, Kligerman S, Kim G, D'Souza WD, Suntharalingam M, Lu W. Modeling pathologic response of esophageal cancer to chemoradiation therapy using spatial-temporal 18F-FDG PET features, clinical parameters, and demographics. International Journal of Radiation Oncology* Biology* Physics. 2014;88(1):195-203.
Figures