0013
Using MR Radiomics to Improve Prediction of Local Tumor Control after Radiosurgery in Brain Metastases1Department of Biomedical Imaging and Radiological Sciences, National Yang-Ming University, Taipei, Taiwan, Taipei, Taiwan, 2Department of Neurosurgery, Neurological Institute, Taipei Veteran General Hospital, Taipei, Taiwan, Taipei, Taiwan, 3School of Medicine, National Yang-Ming University, Taipei, Taiwan, Taipei, Taiwan, 4Brain Research Center, National Yang-Ming University, Taipei, Taiwan, Taipei, Taiwan, 5Department of Radiology, Taipei Veteran General Hospital, Taipei, Taiwan, Taipei, Taiwan, 6Department of Medical Imaging, Cheng-Hsin General Hospital, Taipei, Taiwan, Taipei, Taiwan, 7Molecular and Genetic Imaging Core, Taiwan Animal Consortium, Taipei, Taiwan, Taipei, Taiwan, 8Institute of Biophotonics, National Yang-Ming University, Taipei, Taiwan, Taipei, Taiwan
Synopsis
Patients with non-small cell lung cancer have a high probability to develop brain metastasis during the course of the disease. The prediction of treatment response after Gamma Knife stereotactic radiosurgery (GKRS) can benefit patient management. In addition to the clinically available information (Karnofsky performance status, number of tumors, tumor volume, and primary tumor control), we proposed an MR radiomics approach to provide added values to predict the local tumor control after GKRS. We suggested that imaging characteristics extracted from preradiosurgical MRIs combined with clinical information can effectively predict local tumor control.
Background and Purpose
Non-small cell lung cancer (NSCLC) is the most common form of lung cancer and has a high mortality rate. About a half of patients with metastatic NSCLC would have brain metastasis (BM) during the course of disease [1, 2]. Gamma Knife radiosurgery (GKRS) is one of the first-line treatments for BM [3]. The prediction of treatment outcome, such as the local tumor control of BM after GKRS, may improve patient management. However, the prediction efficacy of local tumor control solely based on the clinically available information is unsatisfactory. In this study, we proposed a machine learning approach based on the preradiosurgical MRI radiomics and clinical information to improve the prediction performance of local tumor control following GKRS.Materials and Methods
We retrospectively collected data of 307 patients with overall 1053 BMs originated from NSCLC. All the patients received GKRS treatment. Inclusion criteria included: 1) pathological diagnosis of NSCLC by lung biopsy or surgery; 2) diagnosis of brain metastases confirmed by MRI; 3) patients treated by GKRS; and 4) available clinical and MRI follow-up after GKRS. The clinical characteristics of recruited patients and BMs are listed in Table 1. Finally, the 976 of all BMs with complete clinical information were included for the subsequent analyses. MRI data were collected from all the patients, including contrast-enhanced T1-weighted (T1c), T1-weighted (T1w), and T2-weighted (T2w) images. Several image processing steps on the MRIs were applied to improve the reliability of radiomics analysis. The adjustment of image resolution was performed to resample voxel size to 1 x 1 x 1 mm3 for each MRI modality. The T2w and T1w images were then registered to T1c images using a six-parameter rigid body transformation and mutual information algorithm. Five clinical features (Karnofsky performance status, KPS; existence of other metastasis besides BM; therapeutic effect of NSCLC; number of BMs; volume of BMs) were also collected in this study. The BM region of interest (ROI) was defined by radiation oncologists and reviewed by a neuro-radiologist for the GKRS treatment planning based on T1c enhancement. Overall 1763 3D-radiomic features, including histogram, geometric, and texture analyses, were extracted from each ROI of BMs. The diagram of image processing is displayed in Fig. 1. A two-step feature selection based on the 70% of lesions (training set) was applied to identify key radiomic features for model training. We first conducted a two-sample t-test to identify the radiomic features with significant differences between groups (tumor progression vs. stable) followed by the sequential forward selection algorithm to sieve out the final radiomic features. Support vector machine (SVM) classifiers were separately trained for three feature set, including 1) clinical features, 2) selected radiomic features, and 3) combination of clinical and selected radiomic features. An under-sampling method (NearMiss-2) was used to match the sample number of majority class (821 stable BMs) with the minority class (155 progression BMs) [4]. The model performance was evaluated based on the remaining 30% of lesions (test set).Results
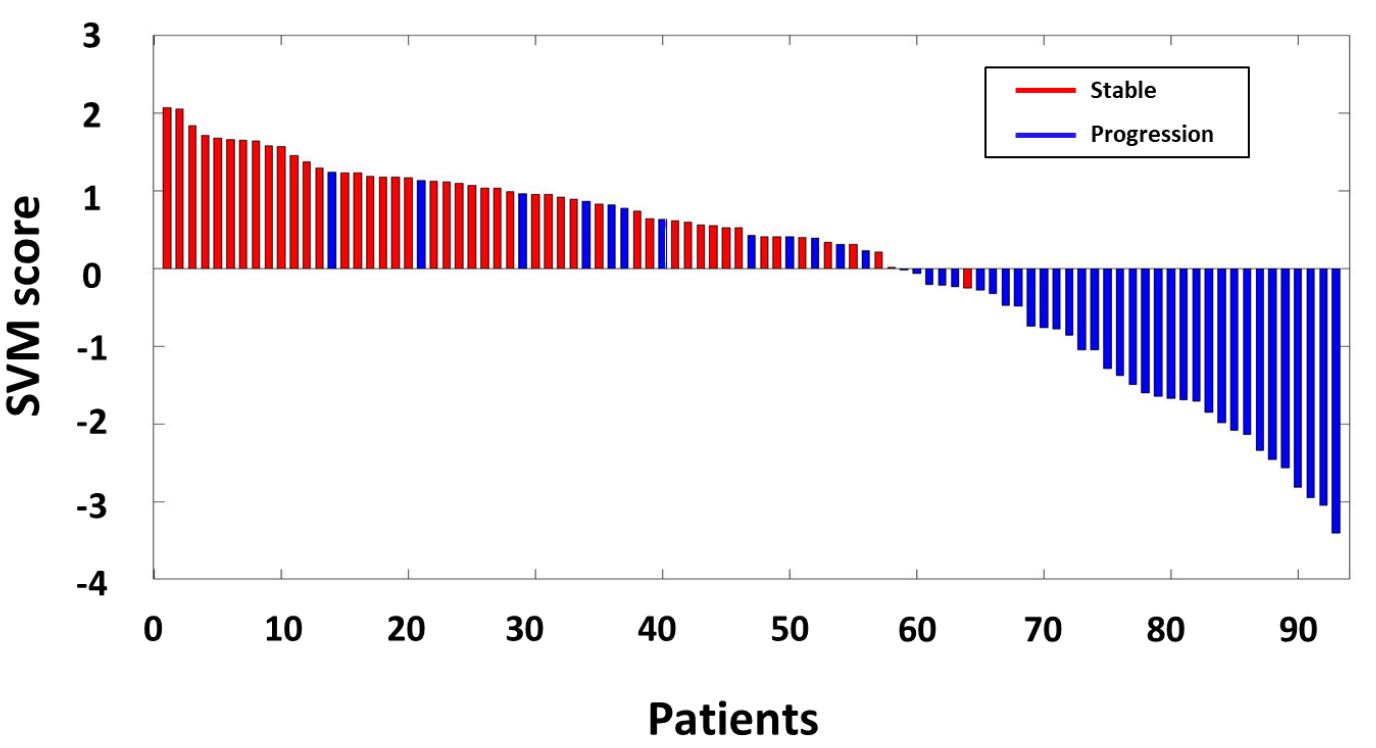
Twenty-five radiomic features exhibited significant differences (p<0.05) between tumor progression and stable groups, including 7 gray-level co-occurrence matrix (GLCM) and 18 gray-level co-occurrence matrix (GLRLM) texture features while 8 features extracted from T1w, 8 from T1c, and 9 from T2w images. Seven final radiomic features were further selected from 25 features using SFS algorism, including 4 GLCM and 3 GLRLM texture features for the prediction of local tumor control after GKRS. Table 2 shows the final radiomic features and the feature values for the tumor stable and progression groups. Figure 2a and 2b demonstrate two representative BM cases (one is stable and another is progressive) with similar tumor size and the corresponding SVM scores. The SVM model based on the combination of clinical and radiomic features achieved the largest area under the curve (AUC) of 0.92, with a sensitivity of 89%, a specificity of 80% and an accuracy of 85% (Figure 2c). The combination of clinical and radiomic features showed superior performance compared to the models based on either radiomic features or clinical features alone. Figure 3 shows the SVM scores of local tumor control classifier derived based on clinical and radiomic features for each patient in the test set. A positive SVM score will be classified as the stable tumor after GKRS, and a negative score will be classified as the tumor progression after GKRS. As shown in Figure 3, most patients with stable tumors have the positive scores, and most patients with tumor progression have the negative scores.Conclusions
Based on the results in this study, we suggested that the machine learning model based on radiomics and clinical information could improve the performance in predicting the local tumor control of BMs after GKRS. For the patients with a prediction of tumor progression after GKRS, salvage radiotherapy or alternative treatments can be considered and applied to improve patient outcome.Acknowledgements
This work was supported by the Ministry of Science and Technology, Taiwan (MOST 109-2314-B-010-022-MY3) and the National Yang-Ming University (VGHUST110-G7-2-2).References
1. Merchut, M.P., Brain metastases from undiagnosed systemic neoplasms. Archives of internal medicine, 1989. 149(5): p. 1076-1080.
2. Sørensen, J., et al., Brain metastases in adenocarcinoma of the lung: frequency, risk groups, and prognosis. Journal of Clinical Oncology, 1988. 6(9): p. 1474-1480.
3. Serizawa, T., et al., Gamma knife radiosurgery for metastatic brain tumors from lung cancer: a comparison between small cell and non—small cell carcinoma. Journal of neurosurgery, 2002. 97(Supplement 5): p. 484-488.
4. Mani, I. and I. Zhang. kNN approach to unbalanced data distributions: a case study involving information extraction. in Proceedings of workshop on learning from imbalanced datasets. 2003.
Figures
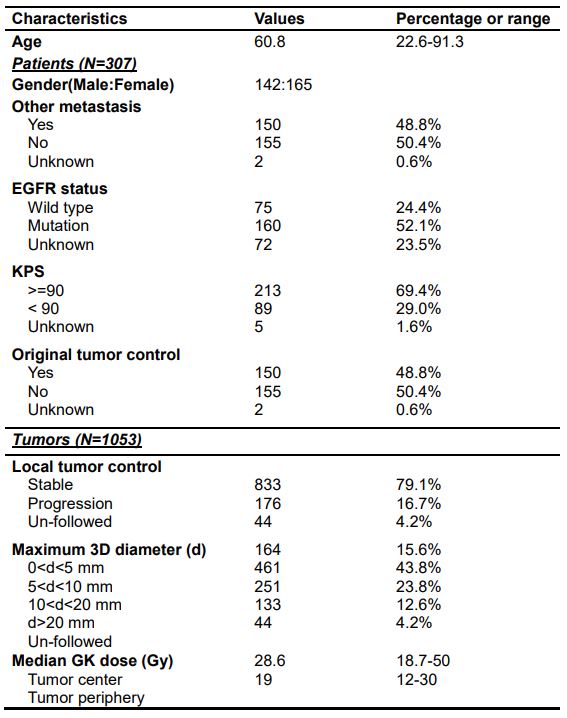
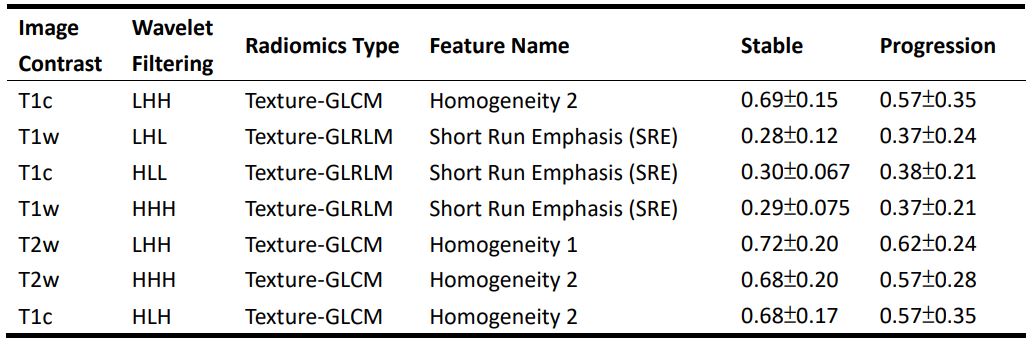
Table 2. Final selected radiomic features for the prediction of local tumor control
GLCM: gray-level co-occurrence matrix, GLRLM: gray-level run-length matrix. In the column of wavelet filtering, L represents a low-pass filter, and H represents a high-pass filter. The combination of L and H letters stands for the filter type applied to the three image axes in order
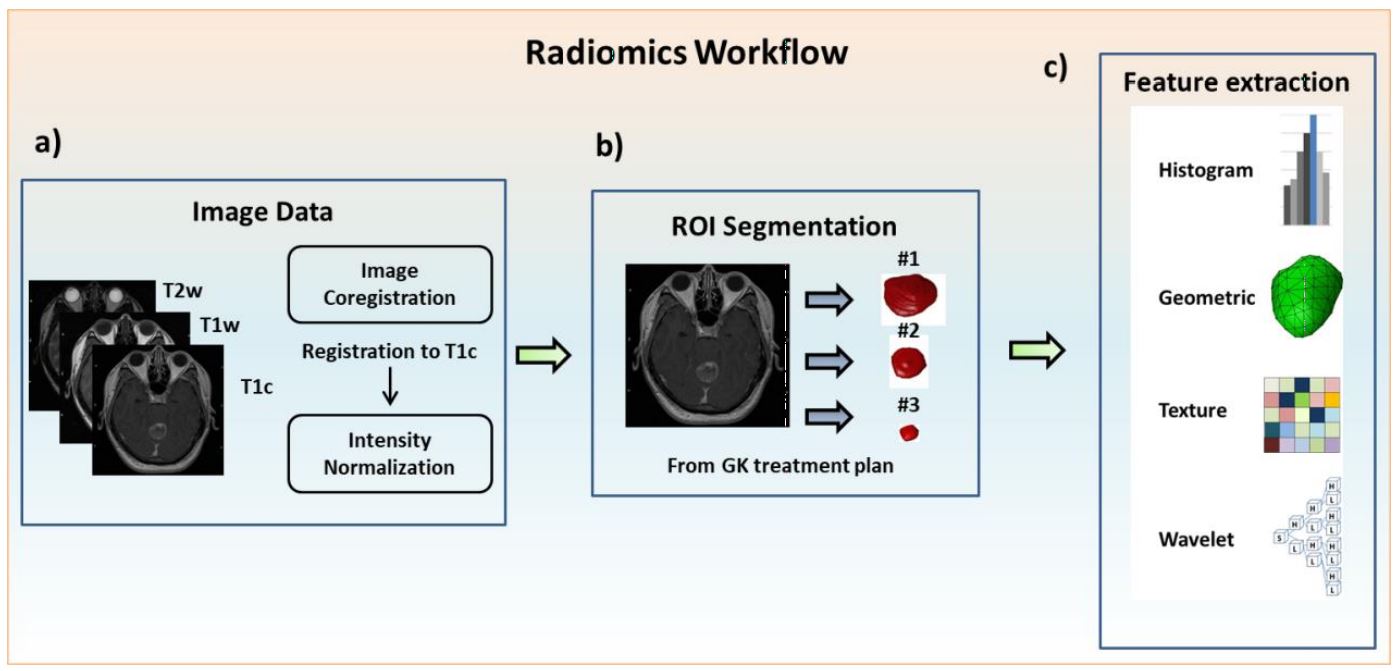
Figure 1. Image processing steps and radiomics flowchart
(a) Image acquisition of T1cwc, T1w and T2w images, registration of T1w and T2w to T1c images and intensity normalization. (b) ROI delineation for the treatment planning of GKRS by experienced neurosurgeons and radiologists on all MRI slices covering tumor regions. (c) Extraction of radiomic features from the tumor ROIs on the MRIs.
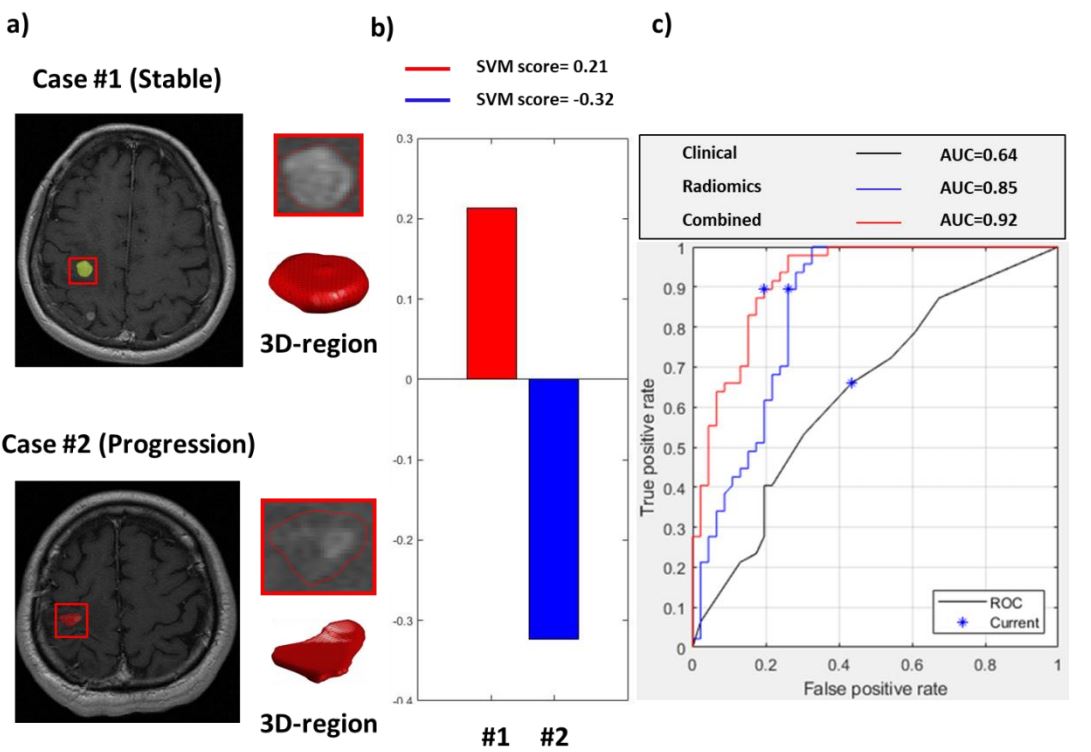
Figure 2. Representative cases and the model performance in predicting local tumor control
(a) T1c images and reconstructed 3D tumor models. (b) The SVM scores in two representative cases based on the combination of radiomic and clinical features. (c) Receiver operating characteristic curves and the area under the curves (AUCs) of three SVM classification models.