0011
High-resolution T1 Mapping of High-grade Glioma1Ming Hsieh Department of Electrical and Computer Engineering, University of Southern California, Los Angeles, CA, United States, 2Department of Radiology, University of Southern California, Los Angeles, CA, United States, 3Radiology and Clinical Neuroscience, Hotchkiss Brain Institute, University of Calgary, Calgray, AB, Canada, 4Global MR Applications & Workflow, GE Healthcare, Calgary, AB, Canada, 5Seaman Family MR Research Centre, Foothills Medical Centre, Calgary, AB, Canada
Synopsis
Native T1 mapping is necessary for quantitative DCE-MRI of brain tumor and may have independent predictive value. Previous investigations using coarse spatial resolution have found tumor to have longer T1 compared to normal white matter. In this work, we evaluate a recent millimeter-resolution whole-brain T1 mapping approach in patients with high-grade glioma. T1 values in tumor and peritumoral regions were higher than that of normal white matter, consistent with literature. We also observed T1 spatial heterogeneity in these regions, further supporting the need for high resolution pre-contrast T1 mapping for quantitative DCE-MRI.
Purpose
To apply millimeter-resolution whole-brain pre-contrast T1 mapping to patients with high-grade glioma at 3T. To report T1 values and spatial heterogeneity in tumor regions of interest.Introduction
Native T1 mapping before contrast agent injection is necessary for quantitative DCE-MRI of brain tumor (BT) and may have independent predictive value1,2. Previous investigations have utilized coarse spatial resolution to avoid long scan time and accepted the possible errors that would propagate to the DCE-MRI analysis3. We recently demonstrated millimeter-resolution whole-brain T1 mapping using sparse sampling and model-based reconstruction that required 2.5 minutes at 3T4. Here, we apply this approach to patients with high-grade glioma and investigate T1 values and spatial heterogeneity in tumor regions.Method
Data were acquired from 13 patients (4M/9F, age 42-80) each with three scan sessions (time points, TP) on a clinical 3T MRI scanner (MR750, GE Healthcare) with a 12-channel Head-Neck-Spine receiver coil. T1 mapping was performed using a sparsely sampled variable flip angle (VFA) approach paired with a model-based reconstruction4. Relevant imaging parameters: TR=4.9ms; TE=1.9ms; FOV=24x24x24cm3; matrix size=256x240x120; resolution=1x1x2mm3; scan time=147s. B1+ maps were acquired using Bloch-Siegert approach5.Tumor regions of interest (ROIs) were manually drawn by a board-certified neuroradiologist with 10-years of experience. For all TPs, we report mean (M) and standard deviation (SD) of T1 values within each ROIs. We report coefficient of variance (COV) as a coarse measure of tumor T1 heterogeneity. These values were compared against the measured values and literature values6 of healthy white matter.
Results
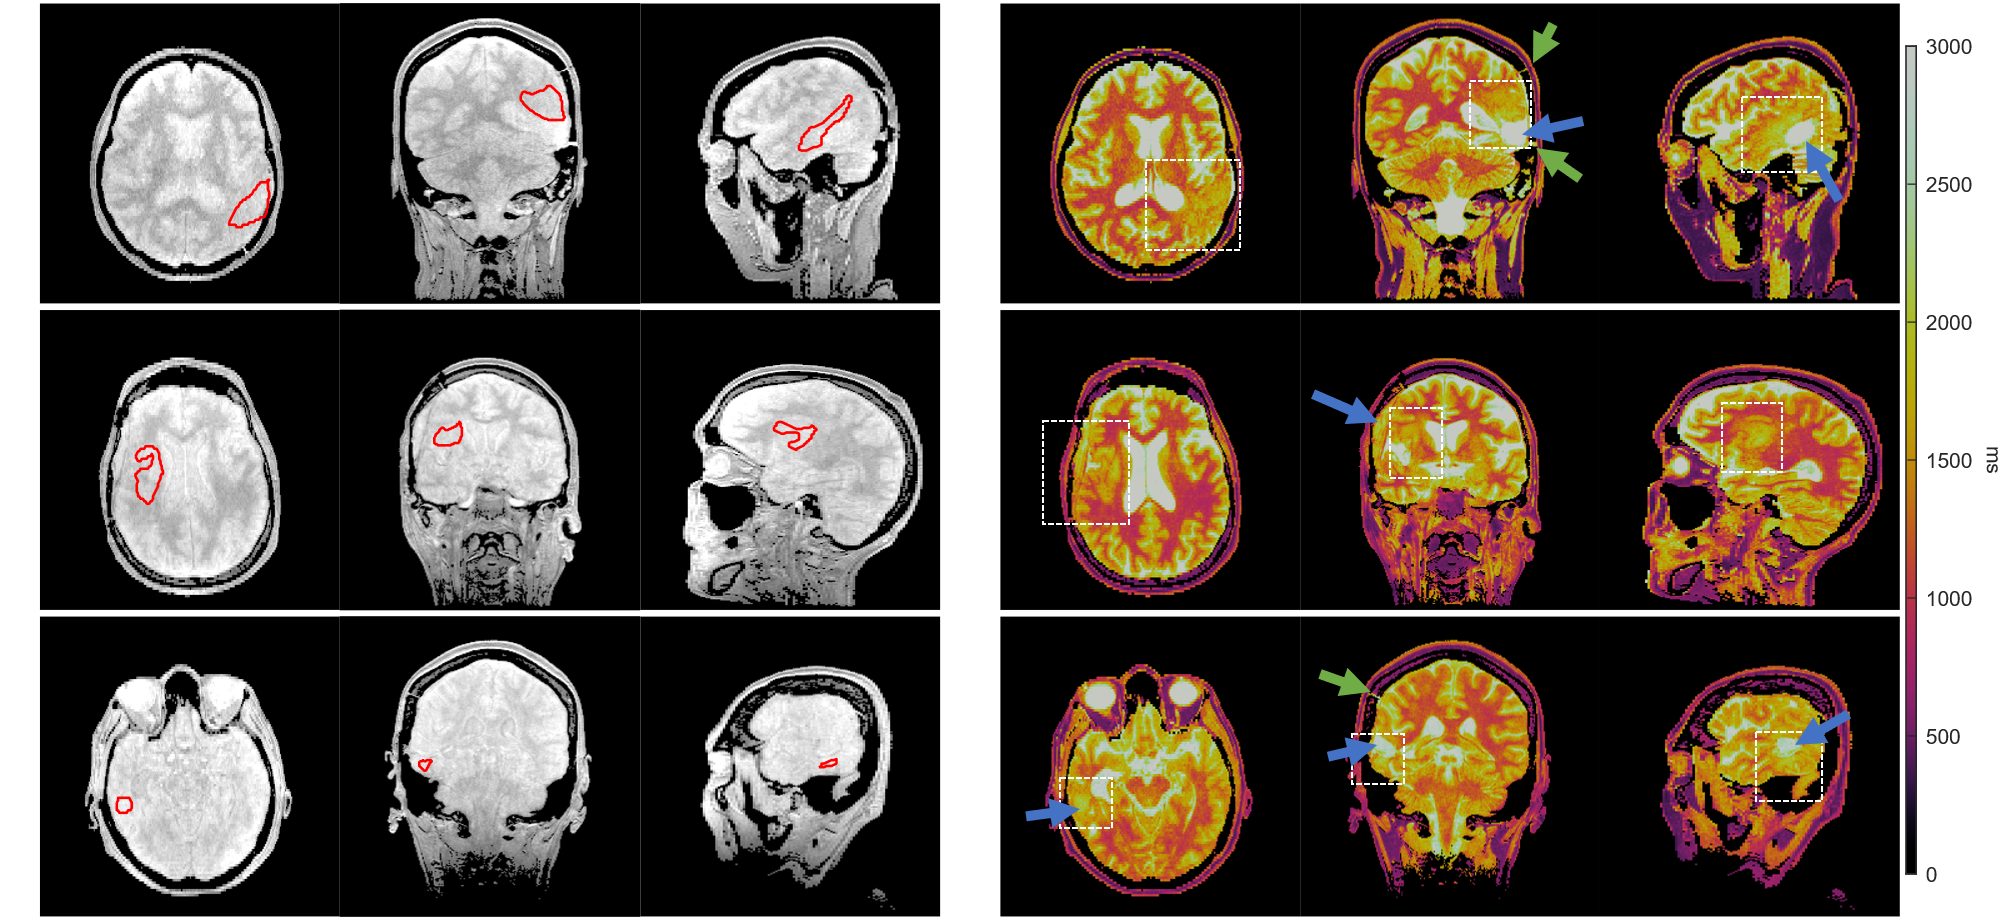
All 39 T1 maps were of high diagnostic quality despite one case (M49, TP1) showing unexpected inhomogeneity in cerebral spinal fluid. Individual tissues are clearly differentiable on T1 maps.Figure 1 shows M0 (left) and T1 (right) maps from three orthogonal orientations centred on the tumor in three representative patients at the TP1. Tumor ROIs are delineated as red contours on the M0 maps. T1 values in tumor regions for each patient were 1749±140ms, 1765±156ms and 1792±128ms, and in contralateral white matter were 1011±71ms, 1102±87ms and 1163±83ms. Cavities filled with fluid are identified by either observing long T1 values (>3000ms) or fluid collection between skull and brain parenchyma.
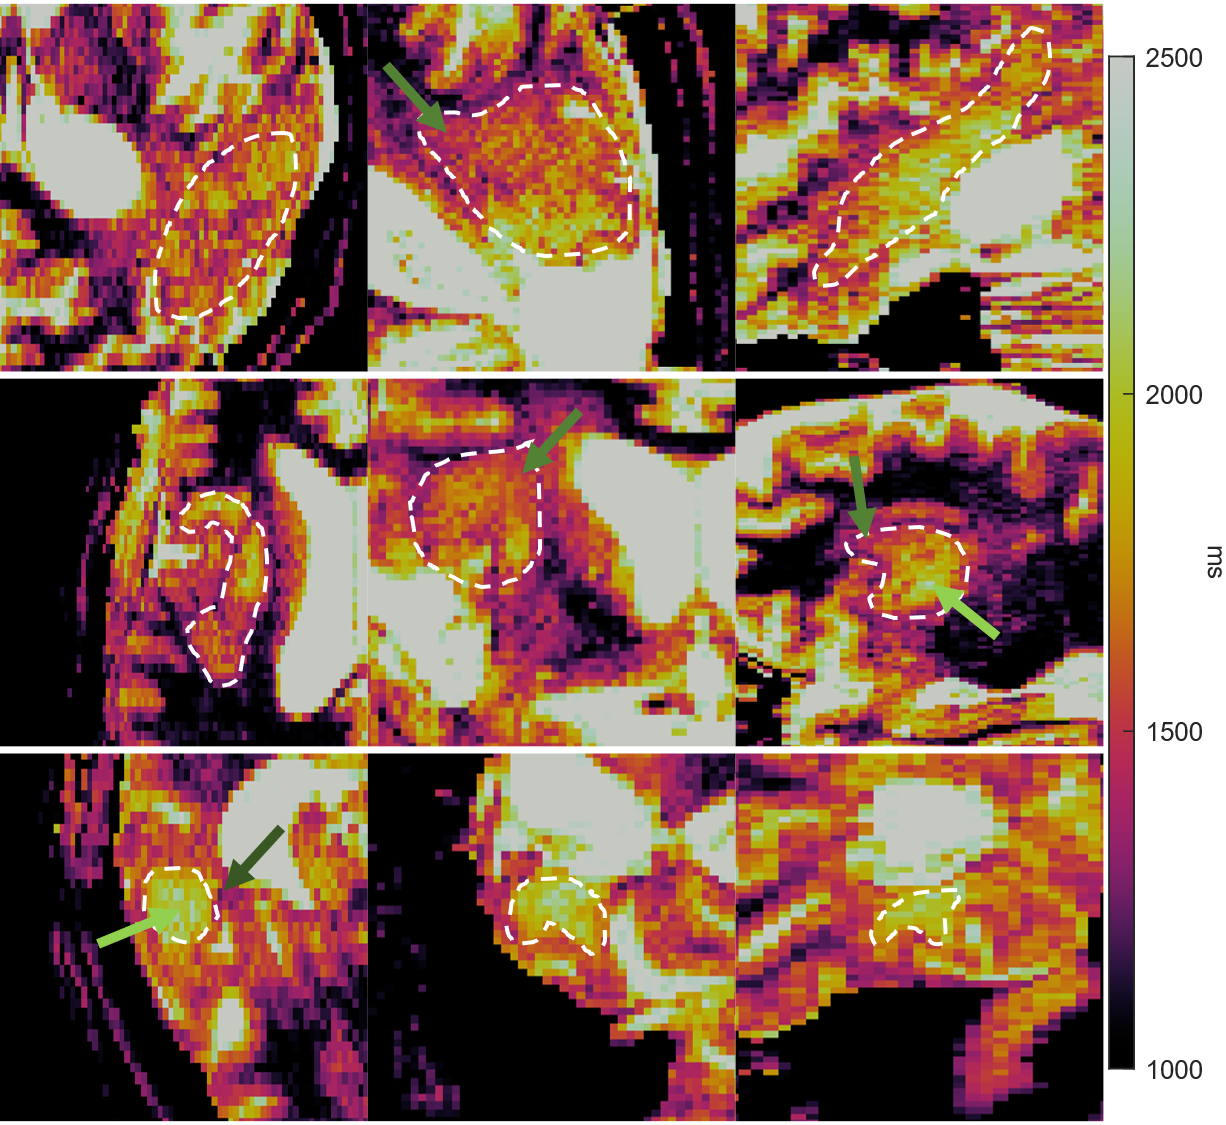
Figure 2 shows zoomed-in versions of Figure 1, focusing on the tumor ROIs. The T1 colorscale is tightened to highlight heterogeneity. The results show T1 heterogeneity inside and around tumor. Light green arrow: T1≈2000ms. Green arrow: T1≈1500ms. Dark green arrow: T1≈1300ms.
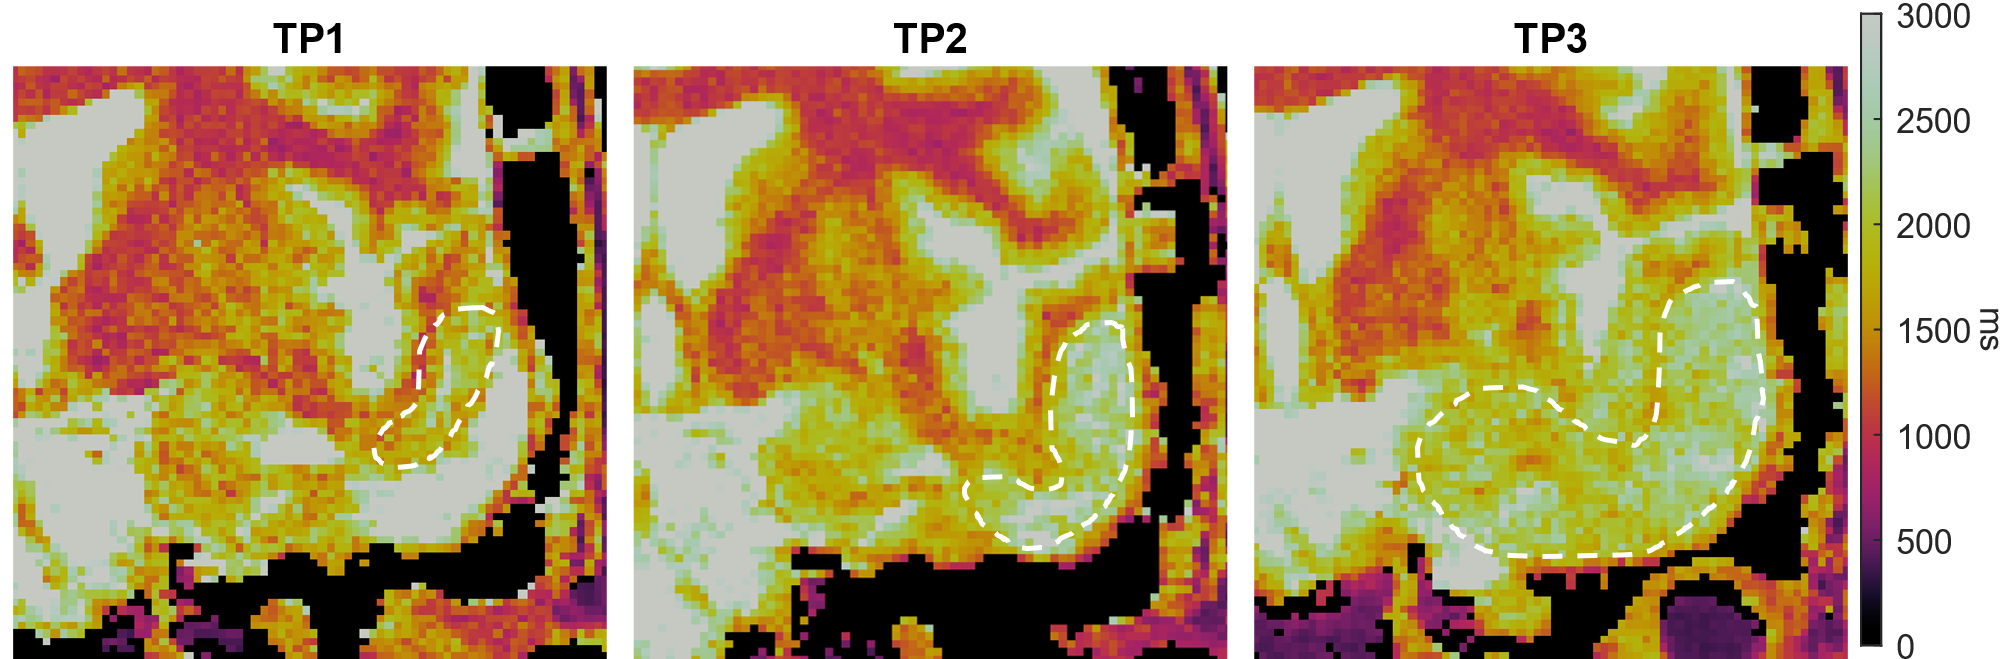
Figure 3 shows the zoomed-in tumor T1 maps of one representative patient with tumor progression. Averaged T1 values increased from 1983ms to above 2300ms within the ROIs. There was no substantial change in COV between TP2 (11.1%) and TP3 (11.0%). The cavity appears squeezed and the area with longer T1 increased in size since TP1.
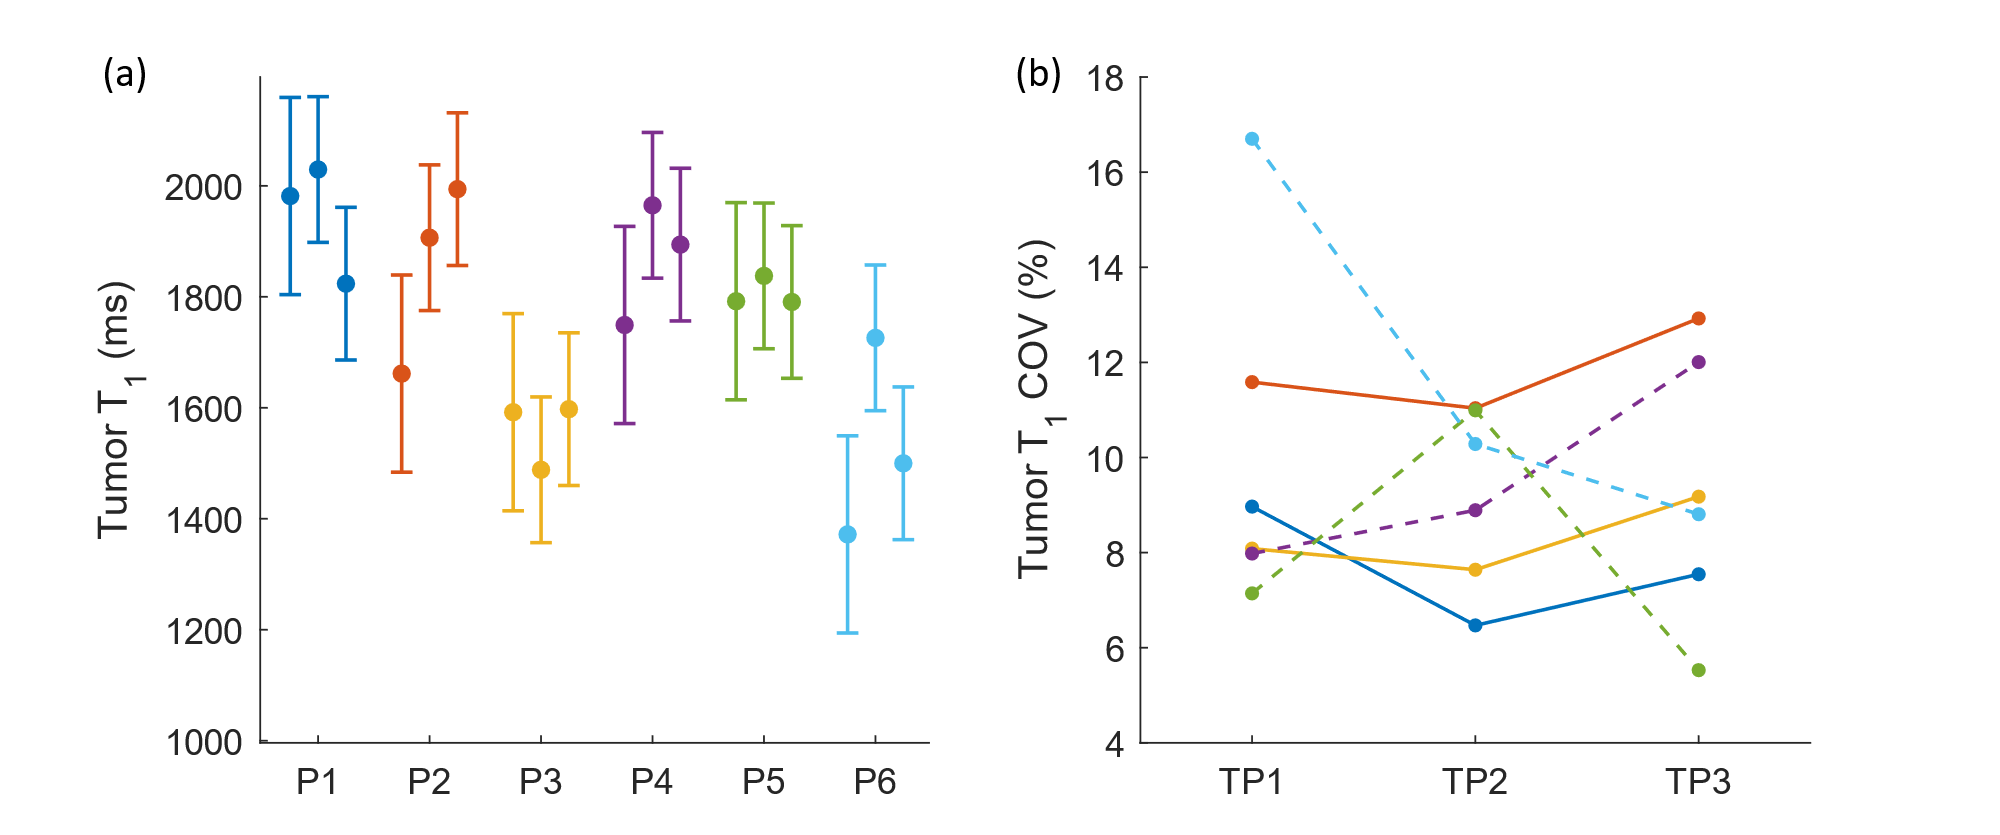
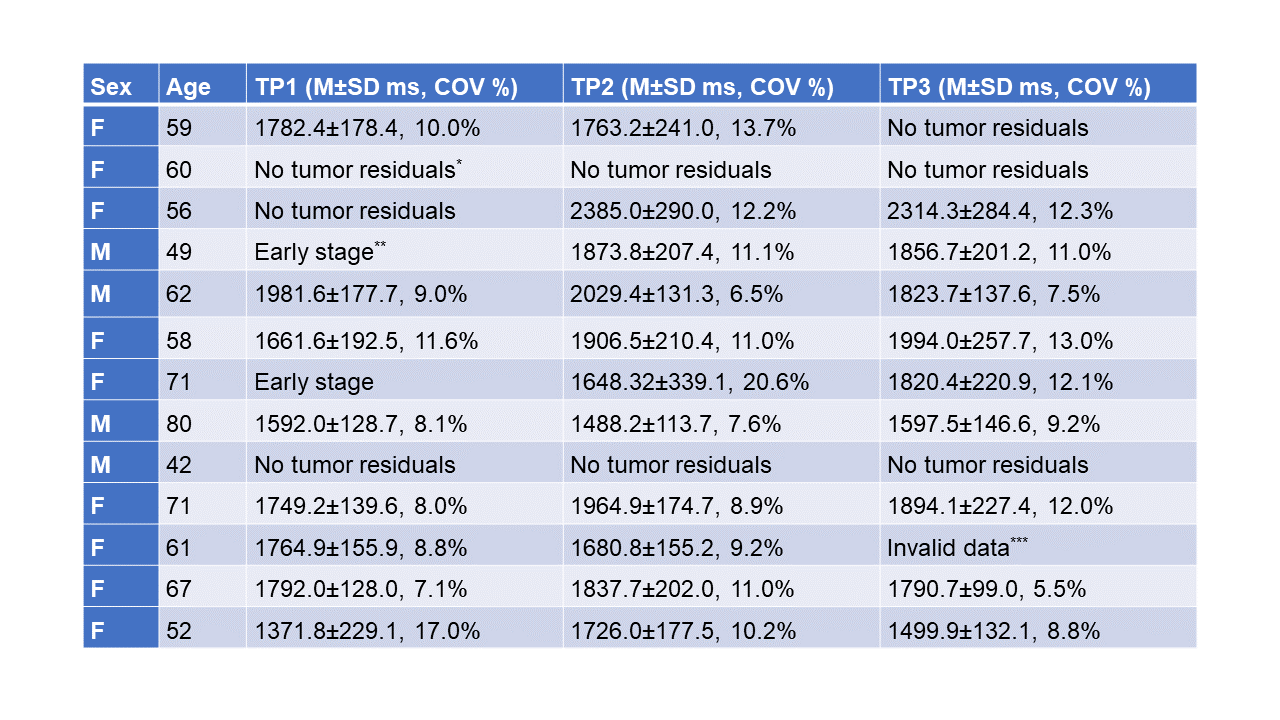
Figure 4 and Table 1 report T1 values (M±SD ms, COV %) within ROIs for different patients at different TPs. Tumors in six representative patients were analyzed. The reported values show a good agreement with literature values (1392-3601ms7–9), except that one case had smaller mean (1372ms) thus larger COV (17.0%) than others. There is more variation in T1 mean and COV among patients than that between TPs. Mean COV within tumor ROI’s (10.4%) was found to be larger than that measured within WM ROI’s (8.4%) in this dataset and literature value (4.2%)6.
Discussion
This work used a model-based sparse VFA T1 mapping approach that was designed to achieve T1 mapping with spatial resolution that matched those of recent millimeter-resolution whole-brain DCE-MRI methods10,11. We report T1 values that are consistent with literature values and distinct from healthy tissues. We observed longitudinal changes in native T1 of suspicious voxels and longitudinal changes in area.The results suggest that glioma has slightly stronger T1 heterogeneity compared to healthy tissues. The finding highlights the necessity of pre-contrast T1 mapping with matched spatial resolution as high-resolution voxel-wise DCE-MRI analysis. The heterogeneity could be related to tumor cellular environment, for example, different T1 values can be observed from cystic tumor, solid tumor and peritumoral regions. Its potential diagnostic values in a more accurate quantitative DCE-MRI will be of interest.
The results did not show clear correlation between tumor T1 and progression. In the case of obvious progression (Figure 3), glioma T1 heterogeneity seemed to behave independently from the progression. Further details about the patient, e.g., treatment, should help exploring and understanding progression and/or treatment response of T1 values and strengthens the potential diagnostic value of high-resolution T1 mapping.
The results show more T1 variation among patients than between different TPs. The variation might result from various factors, e.g., age, cellular heterogeneity and treatment. This study would benefit from taking a closer look at the correlation between the variation and potential causes such as inter-patient variability.
There are also several limitations of this work. Due to scan time limit, it was impractical to acquire fully sampled reference T1 values from patients. This work also ignored any bias in VFA T1 mapping (relative to Inversion Recovery approaches)12 due to magnetization transfer effects13,14.
Conclusion
We evaluated a novel millimeter-resolution whole-brain T1 mapping method in patient with high-grade glioma. Glioma T1 value is found to be longer and more heterogeneous compared to normal appearing white matter.Acknowledgements
We acknowledge National Institute of Health grant support (#R33-CA225400).References
1. Sourbron SP, Buckley DL. Classic models for dynamic contrast-enhanced MRI. NMR Biomed. 2013;26(8):1004-1027. doi:10.1002/nbm.2940
2. Bane O, Hectors S, Wagner M, et al. Accuracy, repeatability and interplatform reproducibility of T1 quantification methods used for DCE-MRI: results from a multicenter phantom study HHS Public Access. Magn Reson Med. 2018;79(5):2564-2575. doi:10.1002/mrm.26903
3. Schabel MC, Parker DL. Uncertainty and bias in contrast concentration measurements using spoiled gradient echo pulse sequences. Phys Med Biol. 2008;53(9):2345-2373. doi:10.1088/0031-9155/53/9/010
4. Zhu Z, Bliesener Y, Lebel RM, Nayak KS. Direct Estimation of pre-contrast T1 for DCE-MRI. ISMRM 28th Scientific Session. https://cds.ismrm.org/protected/20MPresentations/abstracts/3468.html. Published 2020. Accessed December 7, 2020.
5. Sacolick LI, Wiesinger F, Hancu I, Vogel MW. B 1 mapping by Bloch-Siegert shift. Magn Reson Med. 2010;63(5):1315-1322. doi:10.1002/mrm.22357
6. Stanisz GJ, Odrobina EE, Pun J, et al. T1, T2 relaxation and magnetization transfer in tissue at 3T. Magn Reson Med. 2005;54(3):507-512. doi:10.1002/mrm.20605
7. Müller A, Jurcoane A, Kebir S, et al. Quantitative T1-mapping detects cloudy-enhancing tumor compartments predicting outcome of patients with glioblastoma. Cancer Med. 2017;6(1):89-99. doi:10.1002/cam4.966
8. Hattingen E, Müller A, Jurcoane A, et al. Value of quantitative magnetic resonance imaging T1-relaxometry in predicting contrast-enhancement in glioblastoma patients. Oncotarget. 2017;8(32):53542-53551. doi:10.18632/oncotarget.18612
9. Badve C, Yu A, Dastmalchian S, et al. MR fingerprinting of adult brain tumors: Initial experience. In: American Journal of Neuroradiology. Vol 38. American Society of Neuroradiology; 2017:492-499. doi:10.3174/ajnr.A5035
10. Guo Y, Lebel RM, Zhu Y, et al. High-resolution whole-brain DCE-MRI using constrained reconstruction: Prospective clinical evaluation in brain tumor patients. Med Phys. 2016;43(5):2013. doi:10.1118/1.4944736
11. Guo Y, Lingala SG, Bliesener Y, Lebel RM, Zhu Y, Nayak KS. Joint arterial input function and tracer kinetic parameter estimation from undersampled dynamic contrast-enhanced MRI using a model consistency constraint. Magn Reson Med. 2018;79(5):2804-2815. doi:10.1002/mrm.26904
12. Stikov N, Boudreau M, Levesque IR, Tardif CL, Barral JK, Pike GB. On the accuracy of T1 mapping: Searching for common ground. Magn Reson Med. 2015;73(2):514-522. doi:10.1002/mrm.25135
13. Malik SJ, Teixeira RPAG, Hajnal J V. Extended phase graph formalism for systems with magnetization transfer and exchange. Magn Reson Med. 2018;80(2):767-779. doi:10.1002/mrm.27040
14. Lee N, Zhu Z, Nayak KS. Variable flip angle T1 mapping with MT-balanced RF pulses. In: ISMRM 28th Scientific Session. Virtual conference; 2020:3793. https://cds.ismrm.org/protected/20MPresentations/abstracts/3793.html. Accessed September 20, 2020.
Figures