0008
Dual Spin-Echo Proton Density-Weighted and T2-Weighted Knee Imaging with Asymmetric Spiral In-out Trajectories1Radiology, Mayo Clinic, Rochester, MN, United States, 2Royal Philips, MR R&D, Rochester, MN, United States
Synopsis
This work proposes a spiral dual echo spin-echo sequence with asymmetric in-out trajectories to increase the scan efficiency of the second echo. The sequence has been applied for simultaneous sagittal proton density-weighted and T2-weighted Dixon knee imaging. Volunteer scans have demonstrated the feasibility of using the proposed method to achieve up to 36% SNR improvement for T2-weighted images. High quality water and fat images can be obtained with comparable total scan time as the conventional non-Dixon Cartesian fast (turbo) spin-echo sequences with SENSE factors from 1.5 to 2. T2 maps can also be estimated from proton density-weighted and T2-weighted images.
I. Introduction
High-resolution proton density-weighted (PDW), T2-weighted (T2W) images are often acquired with two-dimensional (2D) fast (turbo) spin-echo (FSE or TSE) sequences in sagittal orientation in routine knee exams. Fat suppression is commonly used in one of the sequences to enhance the diagnostic yield1. Previous work2 has demonstrated the feasibility of simultaneous PDW and T2W water-fat knee imaging using a dual SE Dixon method3, in which the first echo was acquired with spiral-out trajectories for PDW images, while the second echo was acquired using symmetric spiral in-out trajectories with double length of the readout of the first echo for the T2W images. The maximum length of the spiral-in part of the second echo is restricted by the echo time (TE) to achieve the desired T2W contrast. In the symmetric spiral in-out trajectories, the spiral-out part of the second echo is also limited by the same constraint even there is room for longer readout. The goal of this study is to implement asymmetric spiral in-out trajectories for the second echo to further increase the scan efficiency and thus improve the signal-to-noise ratio (SNR) of the T2W images.II. Methods
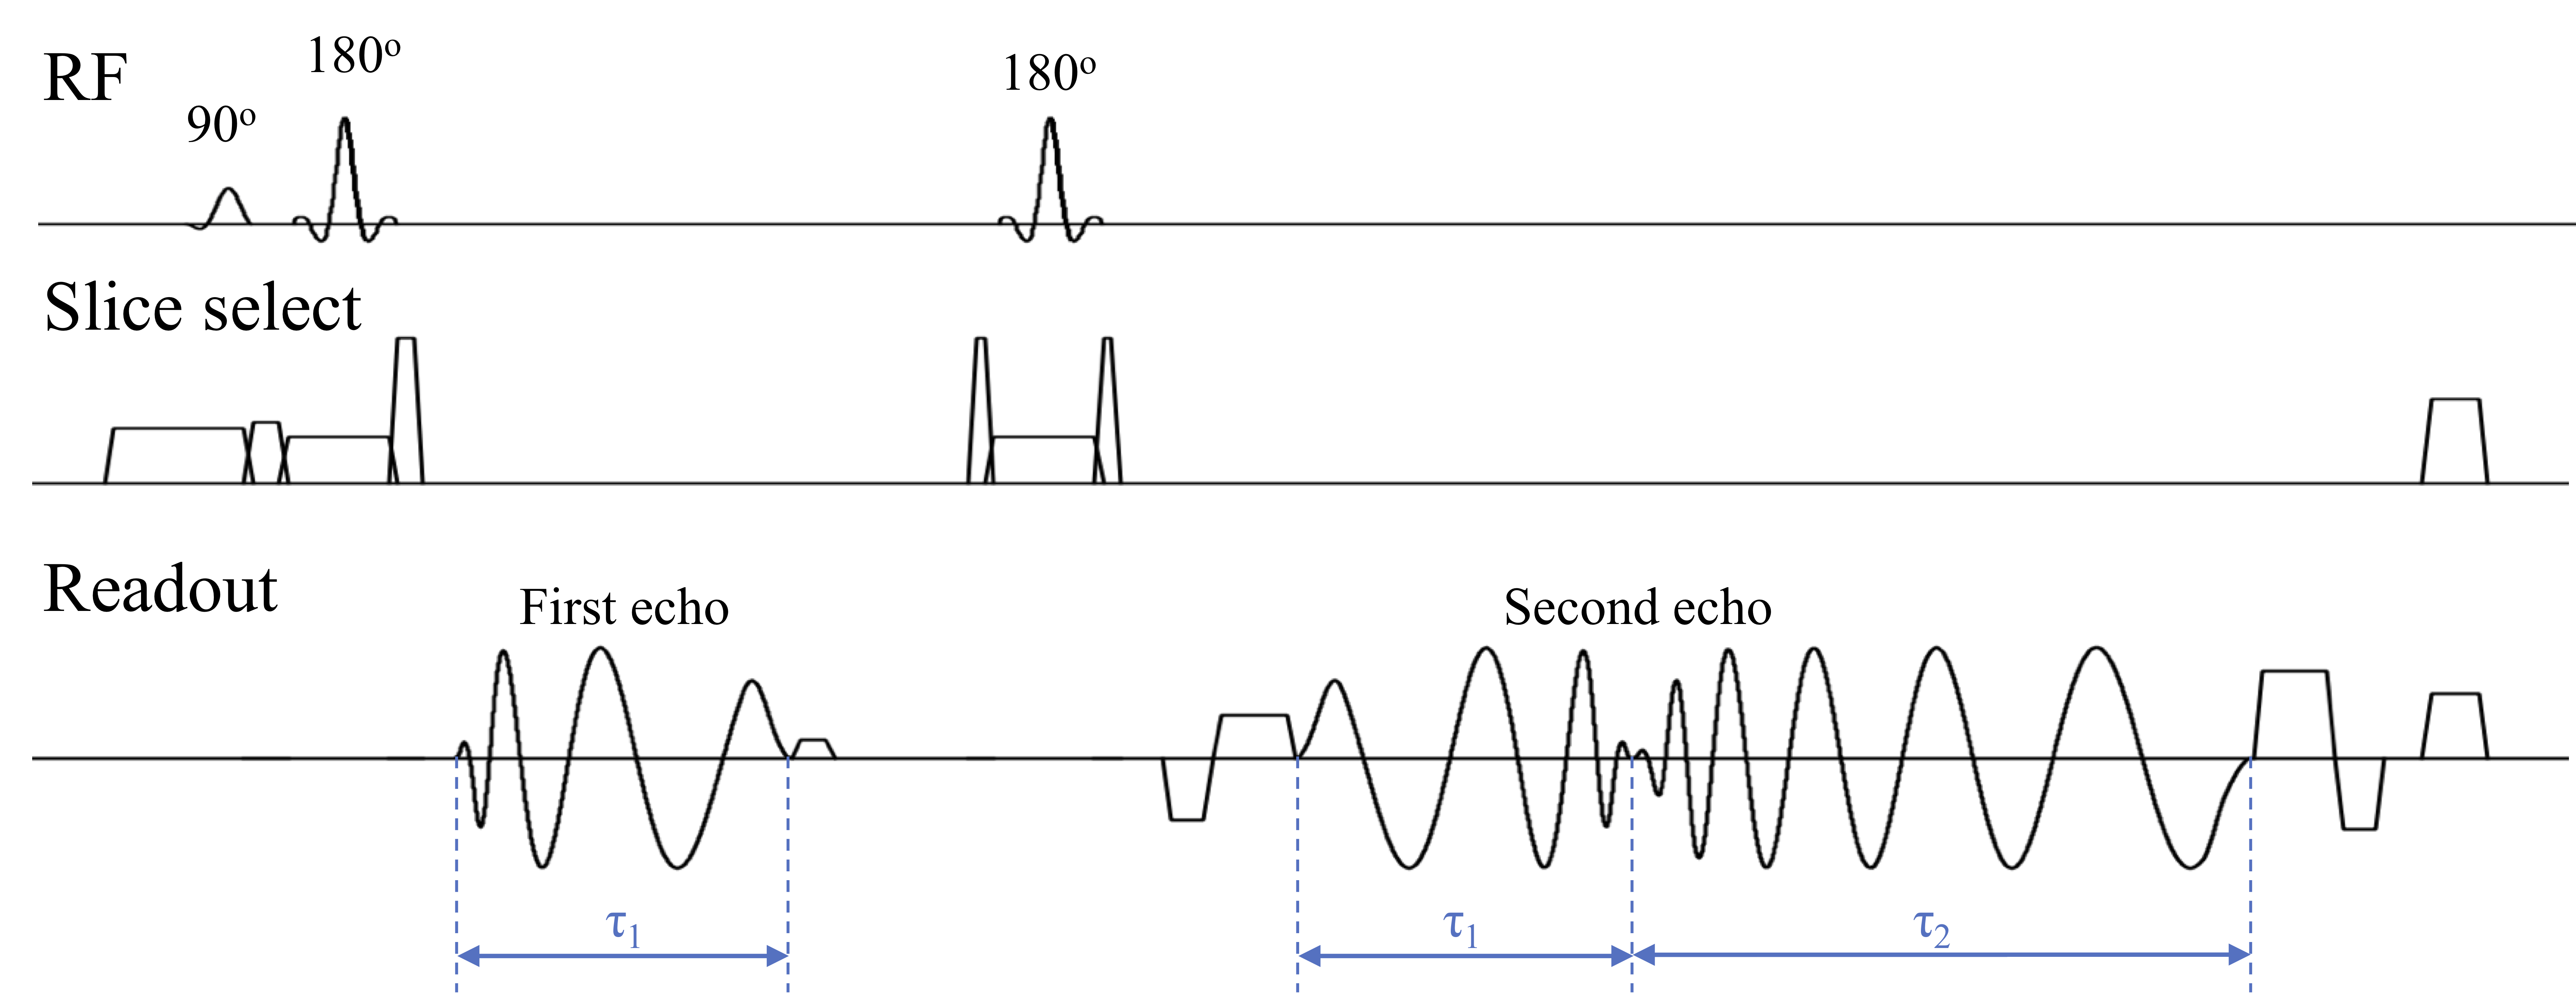
Data AcquisitionThe spiral sequence was implemented on a 3T scanner (Ingenia Elition, Philips Healthcare, Best, The Netherlands). The pulse sequence diagram is illustrated in Fig.1. The spiral-in part of the second echo has the same length τ1 as the spiral-out trajectories of the first echo. The spiral-out part of the second echo has an independent length τ2. Images were acquired with volunteers using a 16-channel knee transmit/receive coil. Informed consent was obtained in accordance with the guidelines of the institutional review board. Standard Cartesian TSE PDW and T2W sequences were also performed for reference. Spectral attenuated inversion recovery (SPAIR)1 was applied to suppress the fat signal in the Cartesian T2W sequence. The readout for both sequences was in the anterior-posterior (AP) direction so that the flow artifacts from the popliteal artery would be in the head-foot (HF) direction to minimize the effects on the center knee area. Different strategies were used to minimize the flow artifacts in the spiral sequence. First, in-plane flow compensation was applied for the second echo. Second, a saturation band was also added superior to the imaging field of view (FOV). Spiral data were acquired at each nominal TE with two TE shifts, 0 and 1.15 ms, for Dixon water-fat imaging. Field maps of the static field inhomogeneity were obtained from separate low-resolution Cartesian scans. Some parameters are: FOV = 160 x 160 mm2, in plane resolution = 0.4 x 0.4 mm2, Slice thickness/gap =3 /0.5 mm. Total 32 slices were acquired for each scan. TE1/TE2/TR = 7/42/3000 ms for spiral scans with fixed at 8.5 ms and τ2 varies from 8.5 ms to 24 ms. TE/TR = 15/2000 ms and readout is 5.1 ms with echo train length (ETL) of 6 for the Cartesian PDW scan. TE/TR = 42/3174 ms, readouts/ETL = 5.76 ms/7 for the Cartesian T2W scan. Parallel imaging was used for both sequences with SENSE factor of 2 for PDW imaging and 1.5 for T2W imaging respectively.
Reconstruction and Analysis
The low-resolution field maps were refined4 and used in the procedure of water-fat separation and deblurring5. The acquired T2W spiral in-out k-space data were divided into the spiral-in part and the spiral-out part, which were reconstructed separately. The water-fat separated spiral-in and spiral-out images were then combined using weighted summation to form the final water and fat T2W images. The weights are $$$\frac{\sqrt{τ1}}{\sqrt{τ1}+\sqrt{τ2}}$$$and $$$\frac{\sqrt{τ2}}{\sqrt{τ1}+\sqrt{τ2}}$$$ for spiral-in and spiral-out images, respectively. Spiral data were collected at a sampling rate twice of the Nyquist rate, so that images from odd and even samples were subsequently subtracted to evaluate noise6. T2 maps were estimated by solving the equation$$$ \frac{s1}{s2}=e^{\frac{TE1-TE2}{T2}}$$$, where s1 and s2 are the magnitudes of the spiral PDW and T2W images, respectively.
III. Results and Discussion
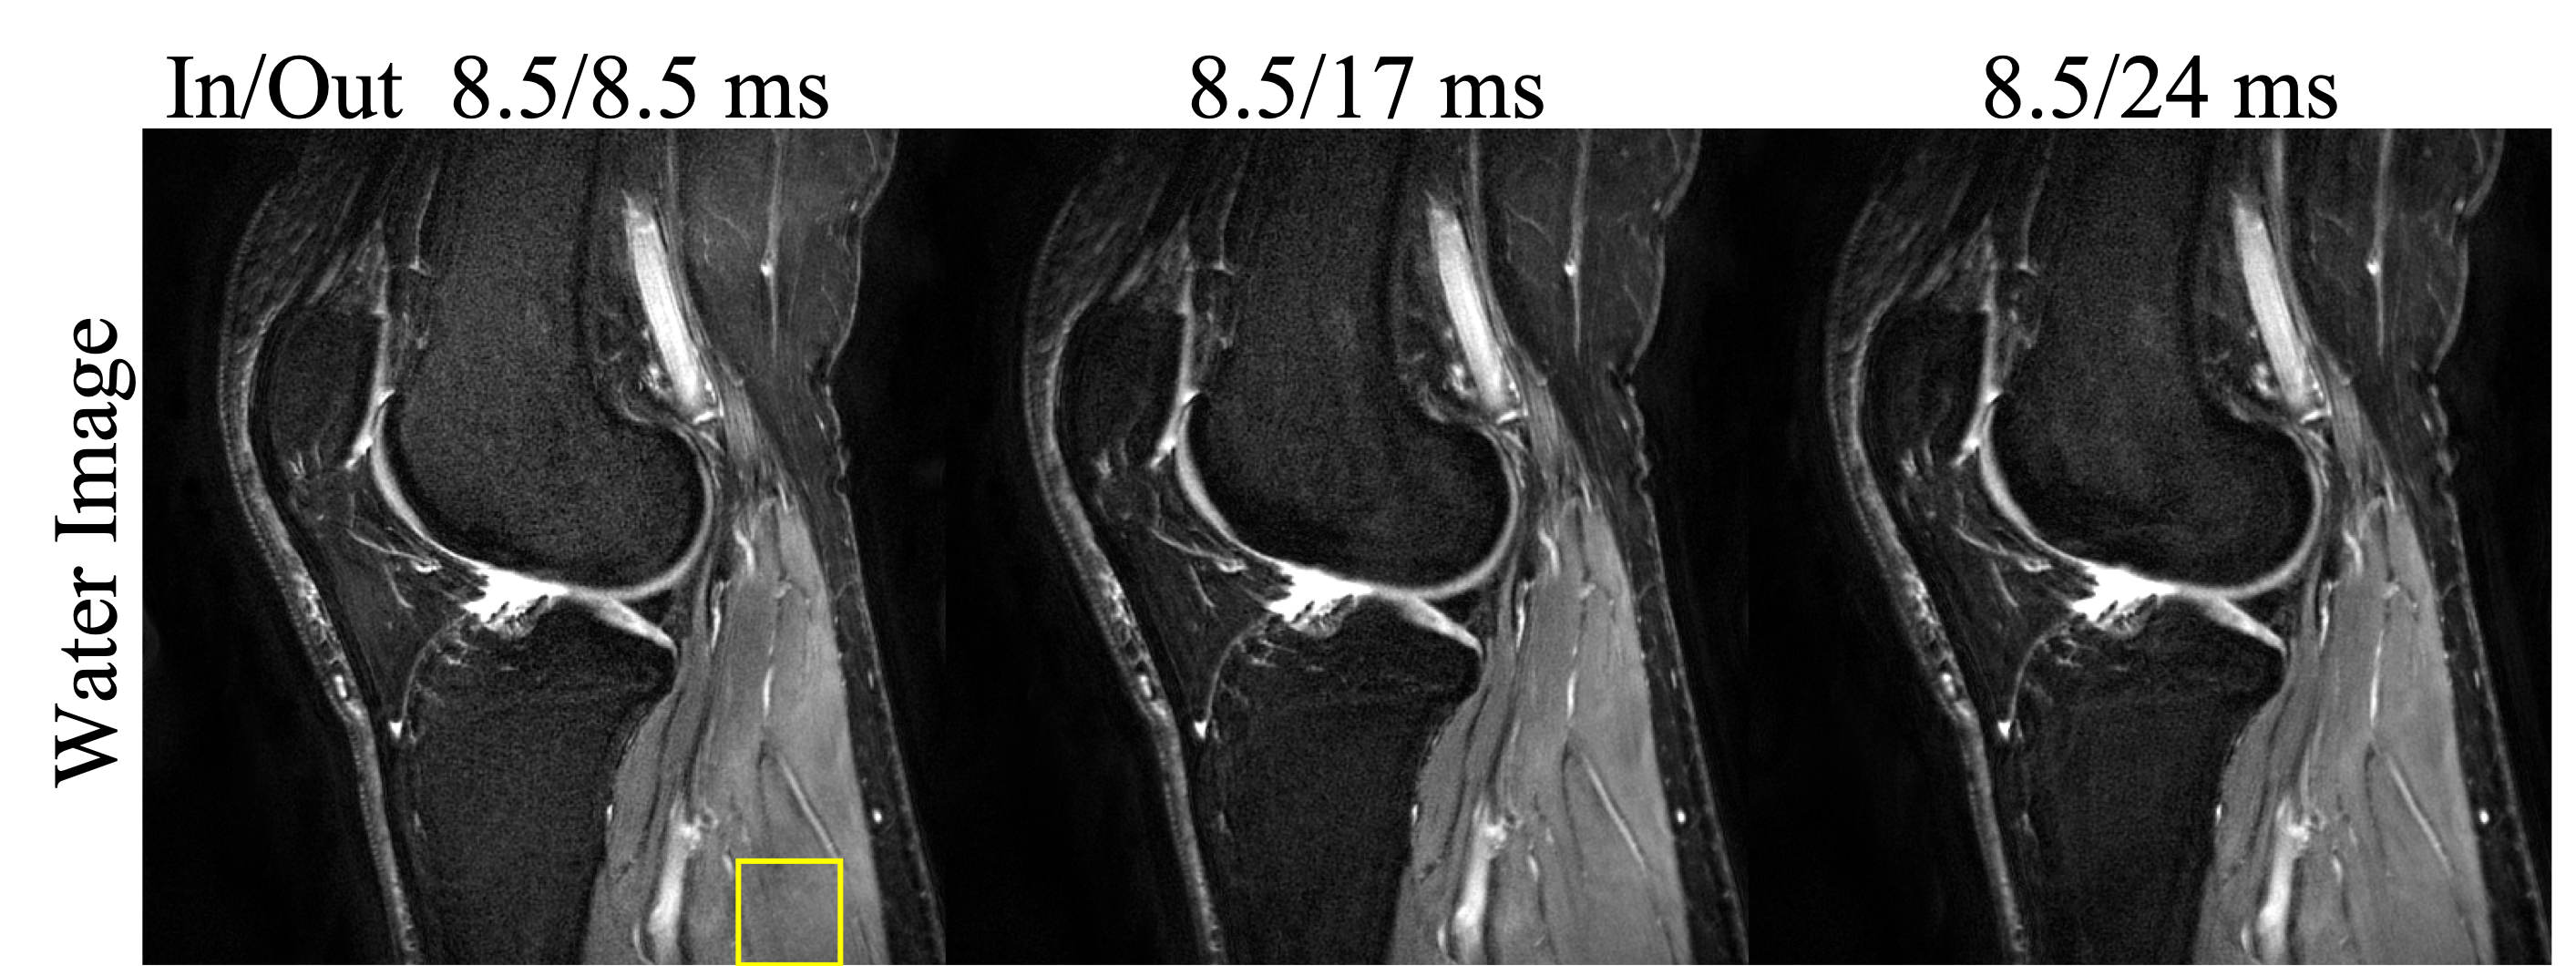
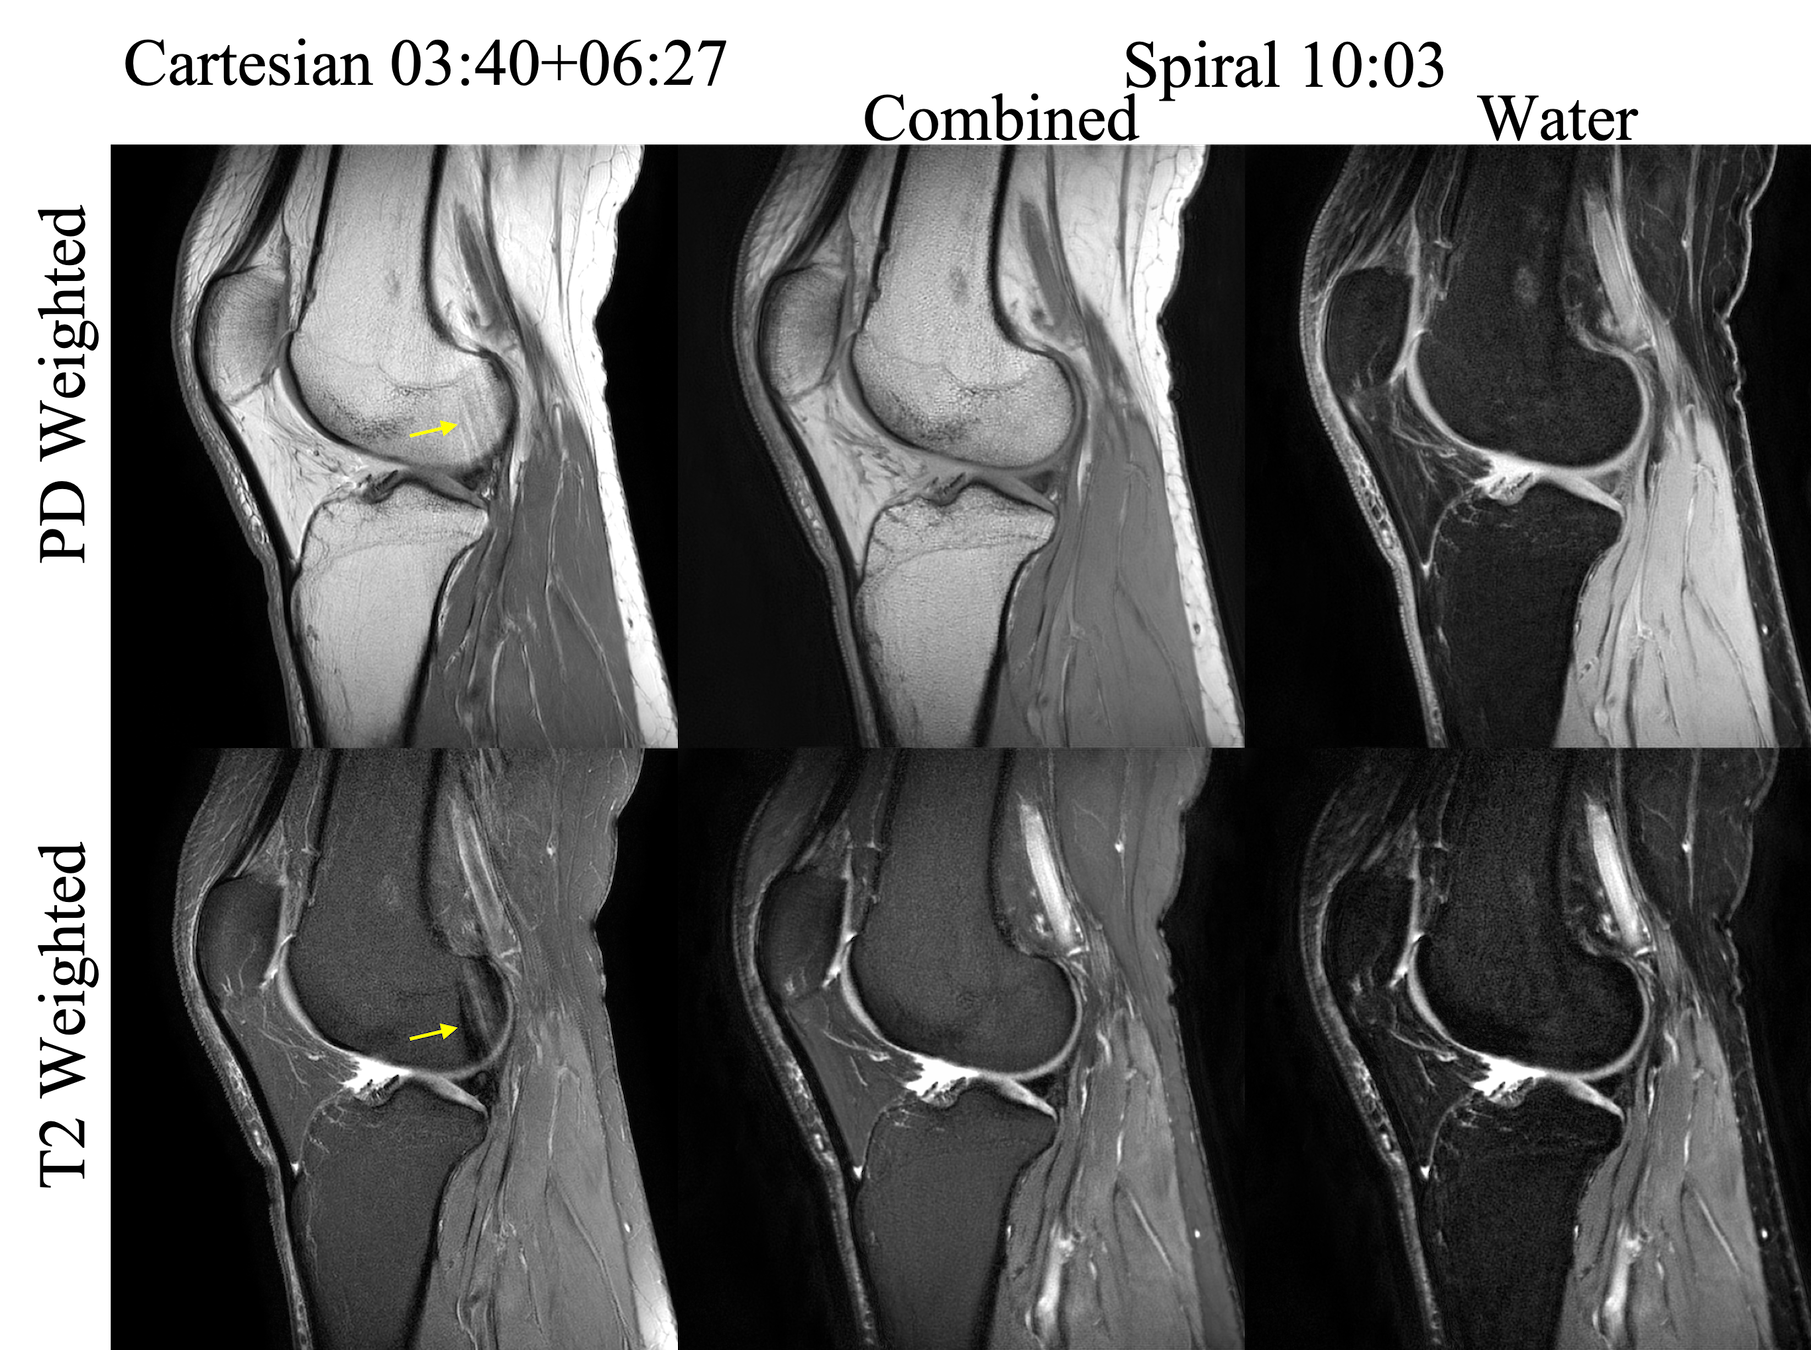
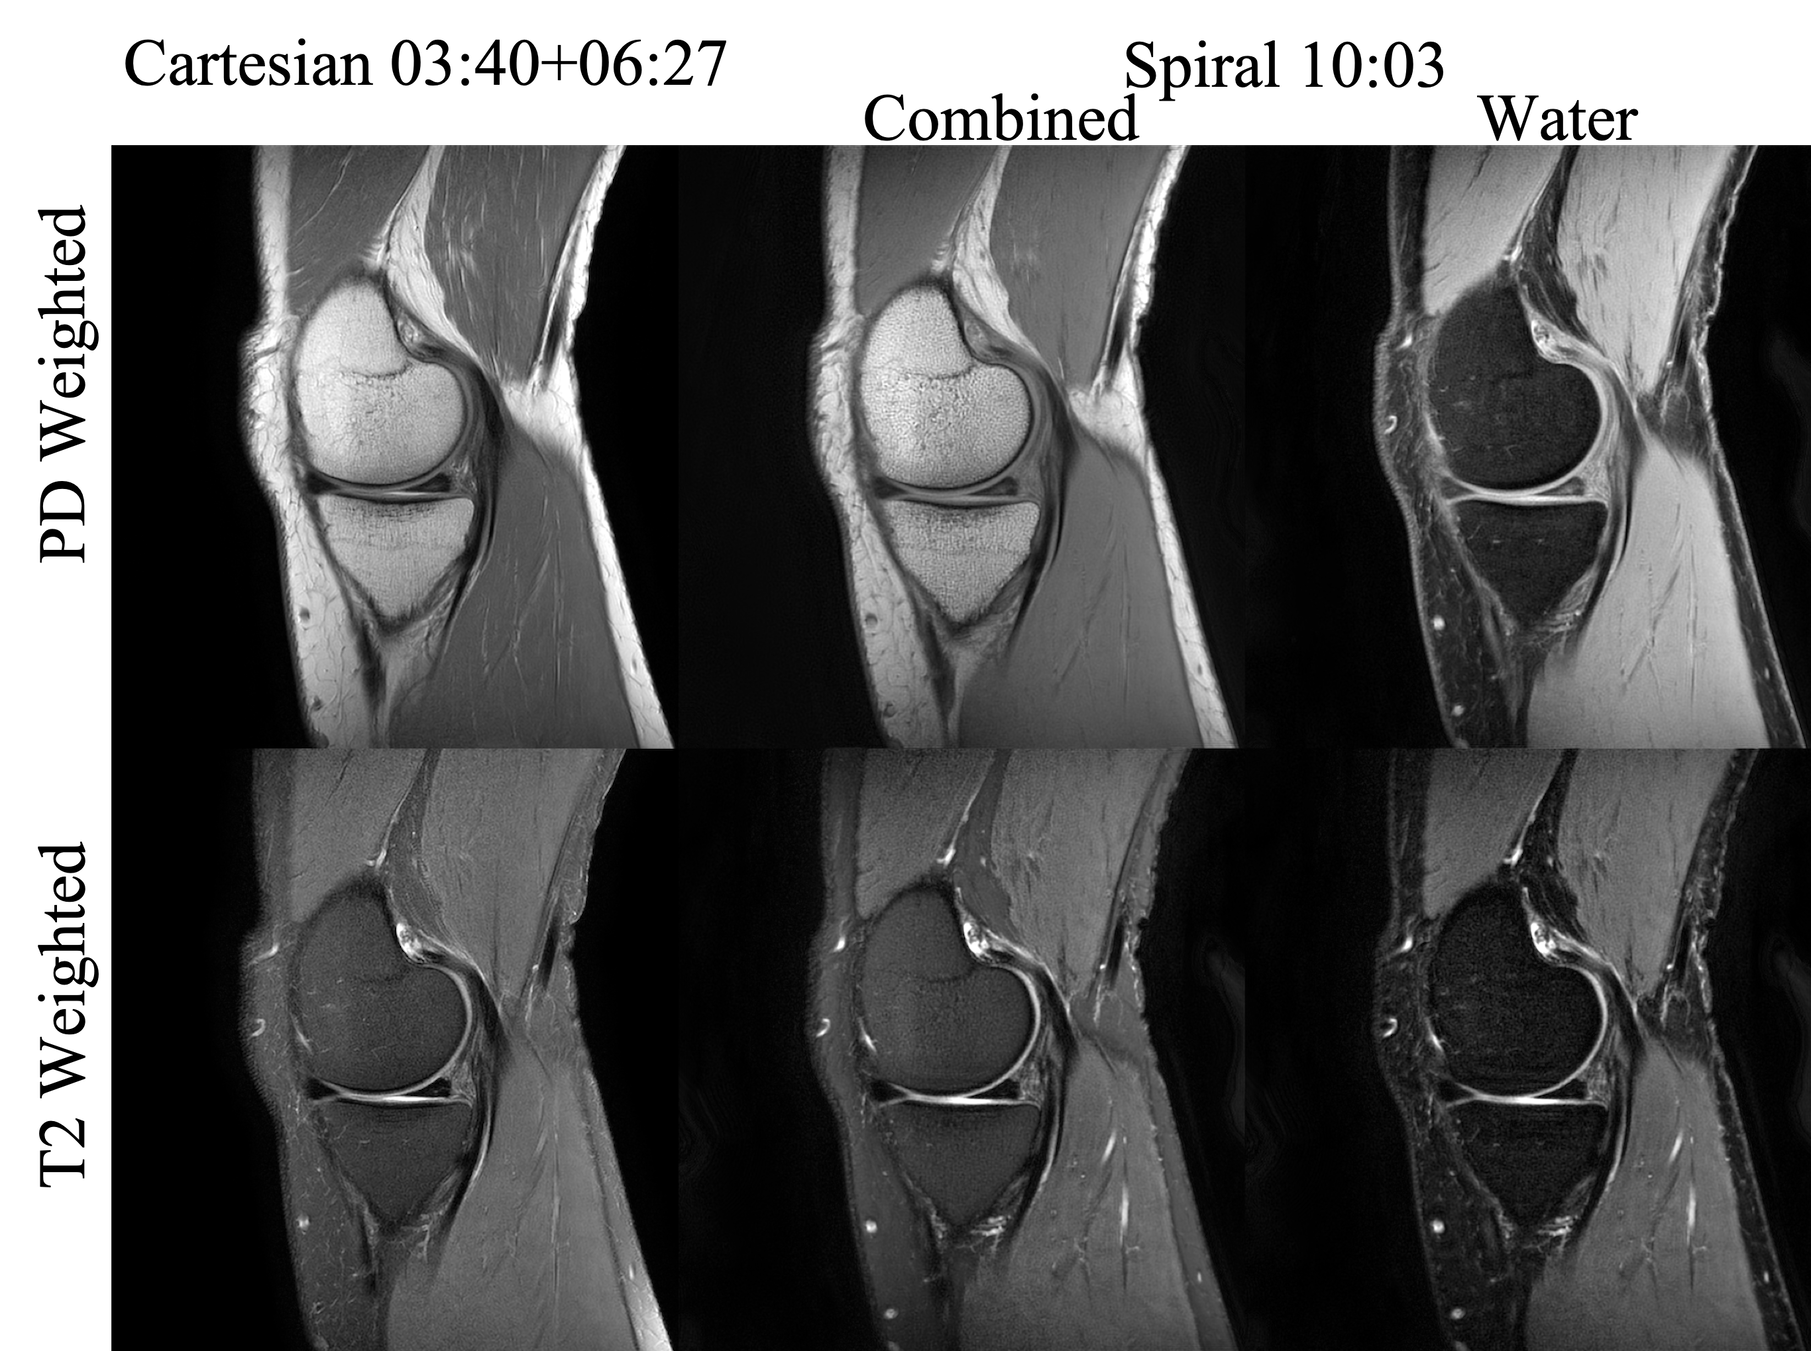
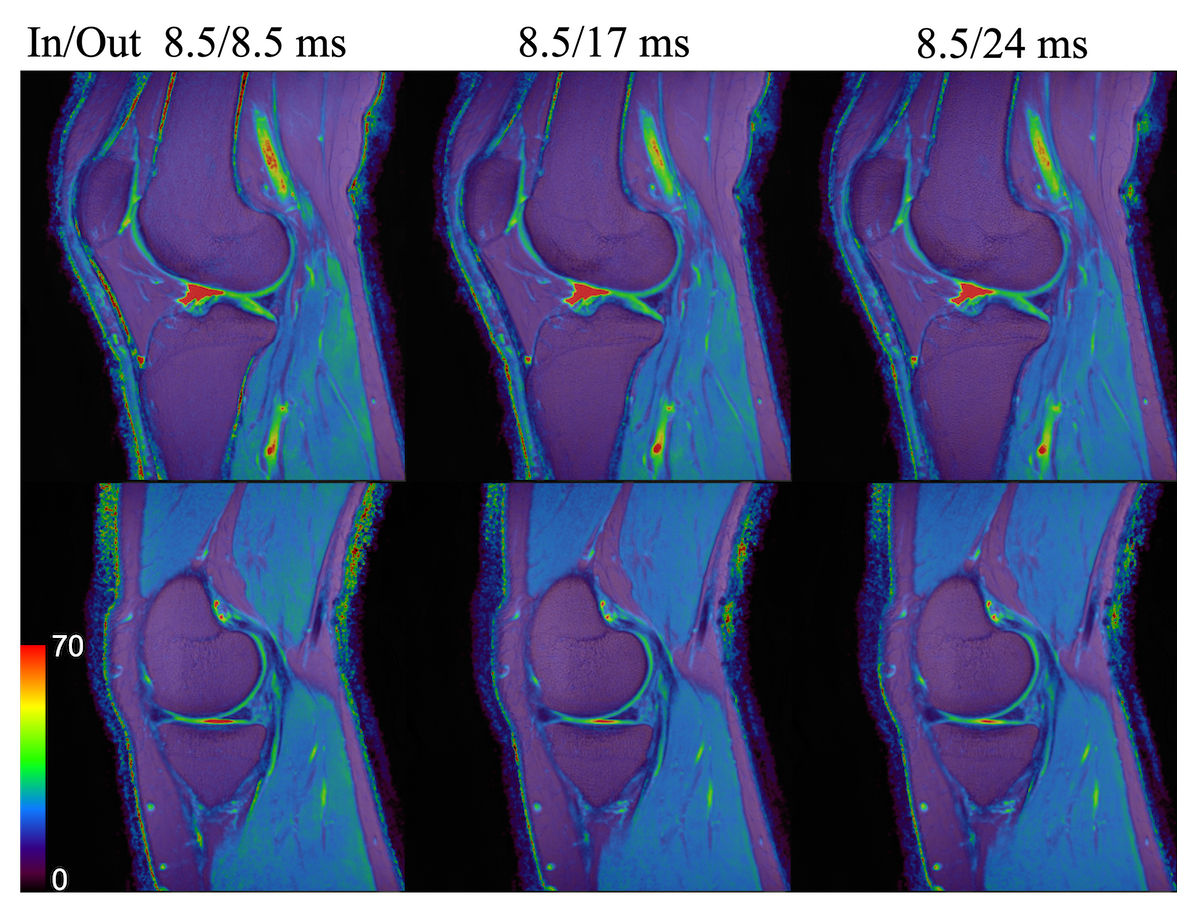
Noise analysis in the region of interest shown in Fig.2 indicates that a roughly 20% gain in SNR can be achieved for the T2W images when τ2 increases from 8.5 ms to 17 ms. An additional 16% improvement of SNR is observed when τ2 further increases to 24 ms. Although there is still room for even longer τ2, there are also challenges for longer readouts such as low-pass filtering effects resulted from T2* decay as well as possible residual blurring after deblurring process. Identification of the optimal τ2 requires further evaluation. The spiral images are compared to the Cartesian reference images in Figs 3-4. Spiral PDW Water and fat images were combined using a pixel-wise root mean square of their values. Spiral T2 water only images also demonstrate better fat suppression compared to the Cartesian T2W fat-suppressed images. Nominal TE1 and TE2 values of 7ms and 42 ms were used in the T2 map evaluation shown in Fig.5. Overall, there is a slight decrease of the estimated T2 values with longer τ2, possibly due to minor contrast change of the second echo. Estimation of the equivalent TE1 and TE2 values would improve the consistency and the accuracy of the T2 maps.Acknowledgements
This work was partially funded by Philips Healthcare.References
1.Del Grande F, Santini F, Herzka DA, et al. Fat-suppression techniques for 3-T MR imaging of the musculoskeletal system. RadioGraphics 2014; 34:217-233.
2. Li Z, Wang D, Karis JP, Pipe JG. A dual spin-echo technique with hybrid spiral readouts for fast simultaneous proton density- and T2-weighted fat-water imaging, in proceedings of the 24th Science Meeting of ISMRM, Singapore, 2016. Abstract 1833.
3. Wang D, Baffour BI, Li Z, Chao T, Krishnamoorthy G, Pipe JG. Feasibility of high-resolution knee imaging with a spiral Dixon technique, in proceedings of the 28th Science Meeting of ISMRM, 2020. Abstract 3172.
4. Chao T, Wang D, Krishnamoorthy G, Pipe JG. A semi-autofocus method to improve tow-point Dixon spiral imaging, in proceeding of the 28th Science Meeting of ISMRM, 2020. Abstract 3399.
5. Wang D, Zwart NR, Pipe JG. Joint water-fat separation and deblurring for spiral imaging. Magn Reson Med. 2018;79:3218-3228.6. Ragunathan S, Wang D, Li Z, Pipe JG. Noise Estimation in spiral imaging, in proceeding of the 22rd Science Meeting of ISMRM, Milan, Italy, 2014. Abstract 1716.
6. Ragunathan S, Wang D, Li Z, Pipe JG. Noise Estimation in spiral imaging, in proceeding of the 22rd Science Meeting of ISMRM, Milan, Italy, 2014. Abstract 1716
Figures