S91
Lower risk of hearing loss without sacrificing image quality in fetal MR imaging: a feasibility study using acoustic reduction technique
Le Cao1, Xiang Liu1,2, and Jianxin Guo1
1The First Affiliated Hospital of Xi’an Jiaotong University, Xi’an, Shaanxi,, China, 2The First Affiliated Hospital of Xi’an Jiaotong University, Xi’an, Shaanxi, China
1The First Affiliated Hospital of Xi’an Jiaotong University, Xi’an, Shaanxi,, China, 2The First Affiliated Hospital of Xi’an Jiaotong University, Xi’an, Shaanxi, China
Synopsis
3.0T MR scanner can achieve superior image quality depicting fetal anatomic details over 1.5T, but may poses higher risk of adverse impact on fetal auditory development due to its intrinsically higher acoustic noise level. This comparative study investigated the value of acoustic noise reduction technique in fetal exam. The result shows the technique can acquire equivalent quality images in 3.0T scanner, meanwhile decrease hearing loss risk in fetal head examinations compared with the conventional method.
Background
Since the first fetal MR imaging was performed in 1983, the technique has developed vastly in the past 3 decades with the improvement of fetus image quality. Previous studies suggested that there was no adverse effect of exposure to 1.5T MR imaging in utero on neonatal hearing function, while Joel’s advised that it seems prudent to avoid more than 1.5T MRI for pregnant women. On the other hand, existing evidences indicate that compared to 1.5T MRI, 3.0T system achieves better anatomical delineation in fetal imaging. However, concern remains on the risk of hearing damage as well as aggravated fetal movement artifacts induced by the elevated acoustic noise level. How can we reduce the impact of noise while acquiring high resolution images in 3.0T? Our study compared the acoustic level and image quality with and without acoustic reduction technique (ART). The purpose of this study was to evaluate whether ART is reliable and applicable in fetus brain imaging.Method
The Institutional Review Board approved this study and all the written informed consents were obtained from pregnant woman. Images were continuously collected from September 2017 to October 2018 using 3.0T MR scanner (Discovery 750W; GE Medical system, Milwaukee, WI) for fetal head exams. 10 subjects underwent ART sequences (group A), the matched 10 subjects underwent traditional sequences (group B). The protocol of tradition sequences includes T2 single short fast spin echo (SSFSE) (axial, sagittal, coronal); while the ART sequences contains ART T2 SSFSE (axial, sagittal, coronal) (Table1). The ART used in our study intentionally decrease the slew rate of gradient waveform from 12 Guass/cm/ms to 5 Guass/cm/ms to achieve lower acoustic noise level. Noise of each sequence at different sites was measured using a special noise meter (BSWA 801; Beijing Shengwang Acoustic and Electromagnetic Technology), each of which was tested for 20 seconds and measured continuously for 3 times for average value. A quantitative assessment by the ROI of 1 mm was manually placed on the different layers of the brain (Fig 1A): germinal matrix, periventricular layer, subplate layer, and cortical layer. The mean signal intensity for each layer was collected, and comparative ratio to air was calculated4. A qualitative evaluation including eight criteria (1. Delineation of germinal zone and gray matter, 2. Delineation of white matter, 3. Delineation of internal and external CSF spaces, 4. Delineation of amniotic fluid adjacent to the skull, 5.Delineation of brain stem, 6. Delineation of cerebellum, 7. Severity of motion artifacts, 8. Overall image quality) were evaluated on an ordinal scale regarding signal characteristics, potential dysmorphism and developmental anomalies (5= optimal diagnostic quality; 4= very good image quality;3= diagnostic image quality, 2= image quality below diagnostic standards; 1= image quality too poor to correctly identify anatomy)5. The noise and image quality differences between the two groups were compared. Statistical analysis was performed in SPSS 20.0 and P value less than 0.05 was considered to indicate statistical significance.Results
There was no statistical difference between the demographic data of the two groups. The maximum differences of peak and equivalent sound pressure between the two groups are 18.1dBA and 16.1dBA respectively (Table2), indicating the ART sequences have lower noise than traditional sequences. Comparative ratios calculated between germinal matrix/air, periventricular layer/air, subplate layer/air, and cortical layer/air for group A (33.97±17.52, 42.45±16.65, 46.37±22.46, 43.03±20.89) were lower than that of group B (52.54±25.61, 33.39±12.91, 69.17±35.21, 64.76±32.53), but with no significant difference (P=0.09,0.20, 0.12, 0.11) (Fig1C-F). The qualitative results showed that the image quality of group B and group A scored 4.42 + 0.37 and 4.36 + 0.49 respectively(Fig1B). There was no significant difference in image quality score between the two groups. The detailed information is summarized in Table3.Conclusion
Acoustic reduction sequence can acquire high quality images in 3.0T scanner, meanwhile decrease hearing loss risk in fetal head examinations compared with the conventional method.Acknowledgements
No acknowledgement found.References
1. Smith FW, Adam AH and Phillips WD. NMR imaging in pregnancy. Lancet. 1983; 321: 61-2. 2. Strizek B, Jani JC, Mucyo E, et al. Safety of MR Imaging at 1.5 T in Fetuses: A Retrospective Case-Control Study of Birth Weights and the Effects of Acoustic Noise. Radiology. 2015; 275: 530. 3. Ray JG, Vermeulen MJ, Bharatha A, Montanera WJ and Park AL. Association Between MRI Exposure During Pregnancy and Fetal and Childhood Outcomes. Jama. 2016; 316: 952-61. 4. Priego G, Barrowman NJ, Hurteaumiller J and Miller E. Does 3T Fetal MRI Improve Image Resolution of Normal Brain Structures between 20 and 24 Weeks' Gestational Age? American Journal of Neuroradiology. 2017; 38. 5. Bonel H, Frei KA, Raio L, Meyer-Wittkopf M, Remonda L and Wiest R. Prospective navigator-echo-based real-time triggering of fetal head movement for the reduction of artifacts. European Radiology. 2008; 18: 822-9. 6. Noise: a hazard for the fetus and newborn. American Academy of Pediatrics. Committee on Environmental Health. Pediatrics. 1997; 100: 724-7.Figures
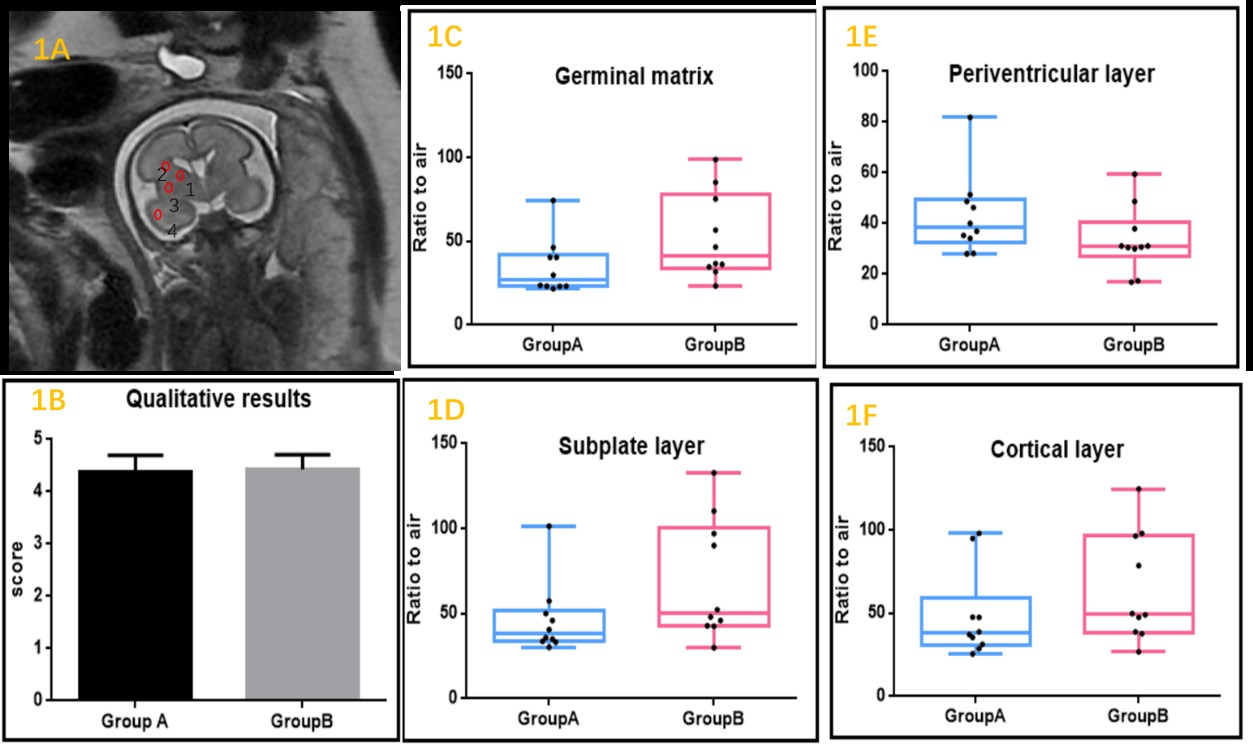
Fig1: A coronal image was selected from each scan at the level of the third ventricle.

Table1 Magnetic resonance imaging
protocols and scanning parameters

Table2 Sequence noise comparison between two
groups

Table 3 Levels of image quality
obtained in 20 patients in two groups