S9
Accuracy of measurements of flow velocity using compressed sensing in 3D cine phase-contrast MRI- Experiments using a steady-flow pump and blood-mimicking flow phantoms -
Atsushi Fukuyama1, Katsuhiro Inoue2, Shinichi Takase2, Tsunehiro Yamahata2, Yutaka Kato3, and Shuji Koyama4
1Radiological and Medical Laboratory Sciences, Nagoya University Graduate School of Medicine, Nagoya, Japan, 2Mie University Hospital, Tsu, Japan, 3Nagoya University Hospital, Nagoya, Japan, 4Brain & Mind Sciences, Nagoya University Graduate School of Medicine, Nagoya, Japan
1Radiological and Medical Laboratory Sciences, Nagoya University Graduate School of Medicine, Nagoya, Japan, 2Mie University Hospital, Tsu, Japan, 3Nagoya University Hospital, Nagoya, Japan, 4Brain & Mind Sciences, Nagoya University Graduate School of Medicine, Nagoya, Japan
Synopsis
Compressed sensing (CS) is a technique that applies image compression theory to reconstruct an image from unusually sparse data that is used to infer the remaining data. CS is similar to parallel imaging technique, another technology that reduces imaging time. However, in case of the former, there is no reduction in the signal-to-noise ratio. In recent years, several studies have been conducted with the goal of reducing burden on patients by using the CS technique that can measure flow velocity in four dimensions (the three dimensions + time).
Purpose
The purpose of this study is to verify the accuracy of the measurements of CS-based flow velocity in 3D cine phase-contrast MRI, using a transparent flow phantom and a steady-flow pump.Methods
Two types of phantoms were used to verify the accuracy of the measurements of the flow velocity. The phantom (A) was an acrylic tube with an inner diameter of 7 mm, installed along the diagonal of an acrylic container measuring 10 cm on each side (fig. 1). The container was fixed with 2% agarose containing a 0.1 mmol/L Gd-based contrast agent. Each of the phase images obtained in the anterior-posterior (A-P), the foot-head (F-H), and the right-left (R-L) directions captured 1/√3 of the actual flow velocity. In theory, the combined flow velocity of the phase images in the three directions should be equal to the actual flow velocity. A glycerin solution diluted with distilled water was used as the simulated blood in the acrylic tube. The fluid was circulated using a steady-flow pump, and the average flow velocity was adjusted to 30 cm/s (fig. 2). The phantom (B) was an acrylic tube with an inner diameter of 8 mm, installed in an acrylic container measuring 10 cm on each side (fig. 3). To meet the conditions for a laminar flow, the Reynolds number was kept below 2,100, and a duct of sufficient length was secured in the passage of the flow. The pump was adjusted to achieve average flow velocities of 20, 40, and 60 cm/s. The flow rates were measured using a flowmeter, and the resulting values were divided by the cross-sectional area of the acrylic tubes to obtain the baseline (actual) average flow velocities.MR images were obtained using a 3T MR scanner (Ingenia Elimino X, Philips healthcare, Best, the Netherlands). The images were captured by the 3D cine phase-contrast MR imaging (also referred to as the “4D-flow” method) using simulated electrocardiography. Measurements were taken using three different techniques of image time reduction: CS, sensitivity encoding parallel imaging (SENSE), and non-acceleration. The average and maximum velocities obtained using each technique were compared to the actual velocities.
Results
Fig. 4 shows the average velocities of the simulated blood in the three directions, and the corresponding maximum velocities are shown in Fig. 5. The application of each of the three techniques of image time reduction resulted in slightly higher flow velocities in the A-P direction. Furthermore, slightly higher flow velocities were observed when the SENSE technique was applied compared with the other two techniques, though there were no significant differences. Fig. 6 illustrates the average velocities when the flow rate was varied, and the corresponding maximum velocities are depicted in Fig. 7. The horizontal axis represents the actual measurements, while the vertical axis represents the flow velocities measured in the MRI. In case all three techniques, the average flow velocity was highly correlated with the measured value, though the maximum velocity was overestimated in proportion to the increase in the flow rate.Consideration
It has been found in previous studies that high spatial resolution is required to accurately measure the average and maximum flow velocities in blood vessels. This finding was taken into account in our study, and the necessary spatial resolution was set. Although, the maximum velocity declines due to partial volume effects, yet it tends to be higher than the baseline value. This might be partially due to the Reynolds number of the 40% glycerin solution used as the simulated blood.Conclusions
In this study, we were able to verify the accuracy of the measurements of CS-based flow velocities in 3D cine phase-contrast MRI, using two phantoms and a steady-flow pump. The simulated blood flowing across the diagonal yielded nearly equal flow velocities in all three directions, and this suggested that it should be possible to calculate the flow velocity vectors, with accuracy, at any point. Furthermore, no significant difference was observed between the CS, the SENSE, and the non-acceleration techniques, leading to conclude that all three enable the flow velocity to be measured with equal accuracy.Acknowledgements
We would like to express our gratitude to Department of Radiology, Mie University Hospital for giving us permission to use their MR imaging scanner. This work was supported by JSPS KAKENHI Grant Number 19K12863.References
- Ma LE, Markl M, Chow K, et al. Aortic 4D flow MRI in 2 minutes using compressed sensing, respiratory controlled adaptive k-space reordering, and inline reconstruction. Magn Reson Med. 2019; 81(6), 3675-3690.
- Neuhaus E, Weiss K, Bastkowski R, et al. Accelerated aortic 4D flow cardiovascular magnetic resonance using compressed sensing: applicability, validation and clinical integration. J Cardiovasc Magn Reson. 2019; 21(1).
- Stankovic Z, Fink J, Collins JD, et al. K-t GRAPPA-accelerated 4D flow MRI of liver hemodynamics: influence of different acceleration factors on qualitative and quantitative assessment of blood flow. MAGMA. 2015; 28(2), 149-59.
- Watanabe T, Isoda H, Fukuyama A, et al. Accuracy of the Flow Velocity and Three-directional Velocity Profile Measured with Three-dimensional Cine Phase-contrast MR Imaging: Verification on Scanners from Different Manufacturers. Magn Reson Med Sci. 2019; 18(4), 265-271.
- Fukuyama A, Isoda H, Morita K, et al. Influence of Spatial Resolution in Three-dimensional Cine Phase Contrast Magnetic Resonance Imaging on the Accuracy of Hemodynamic Analysis. Magn Reson Med Sci. 2017; 16(4), 311-316.
Figures
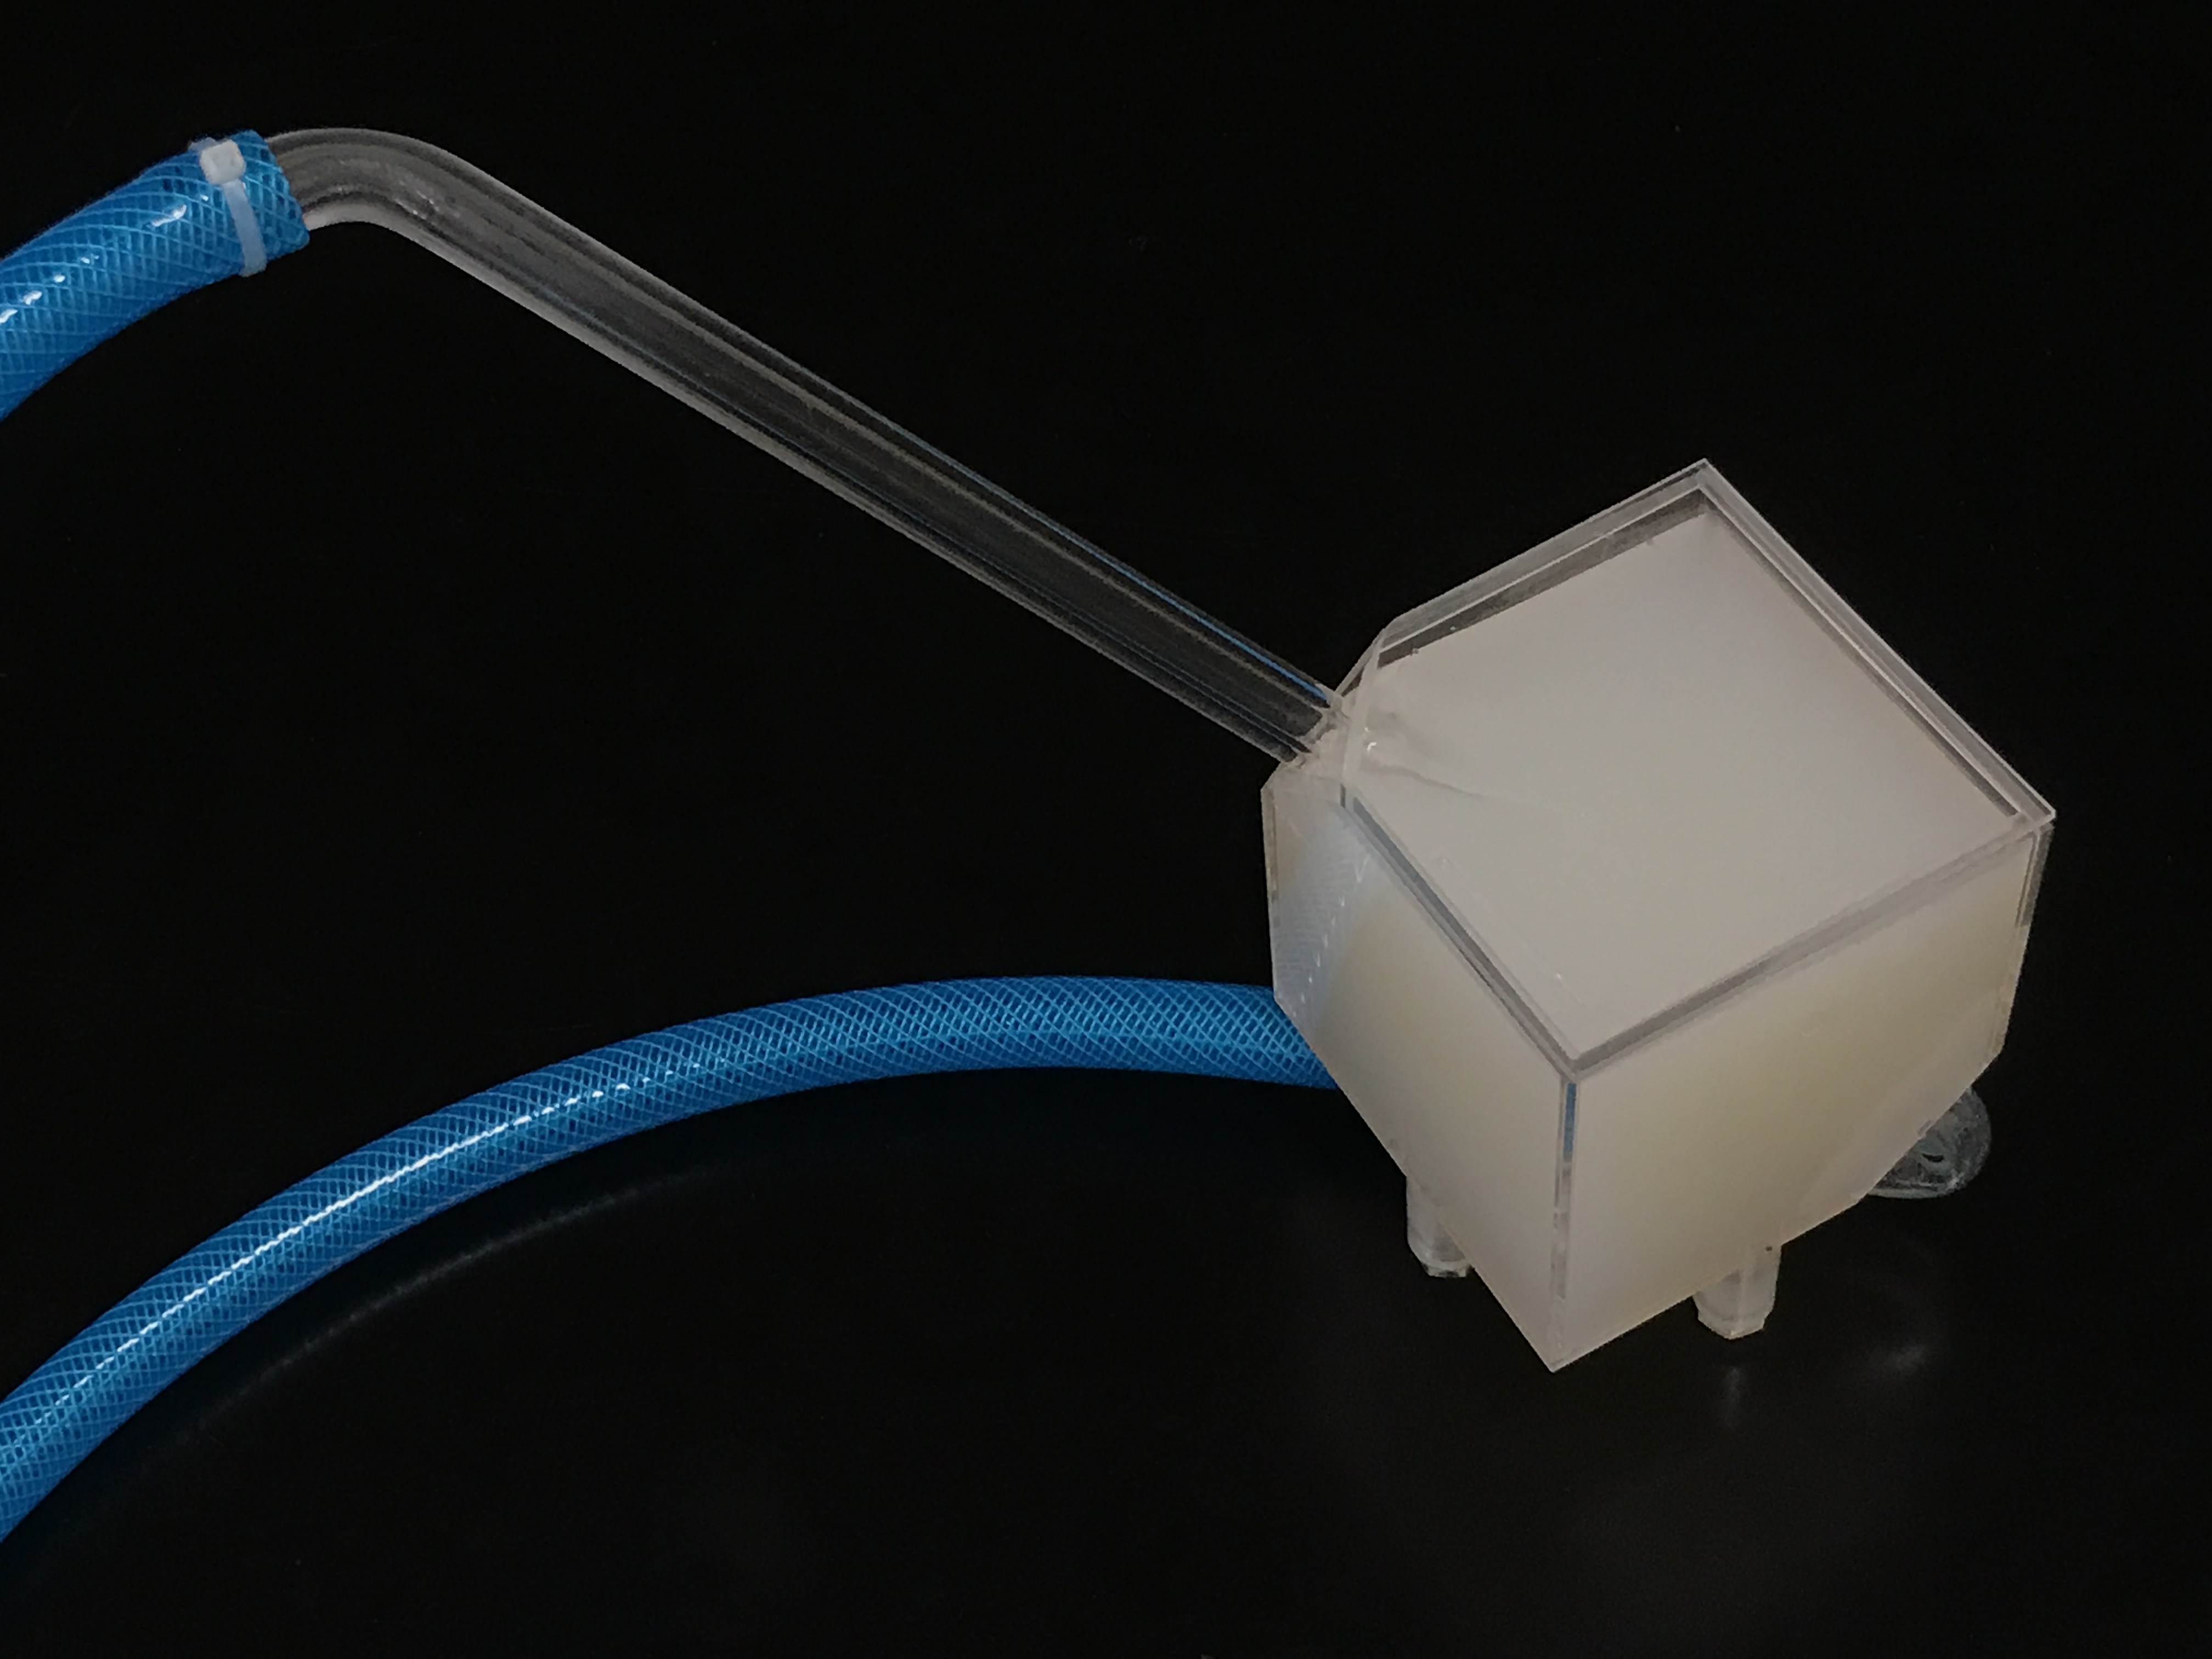
Flow phantom (A)
was an acrylic tube with an inner diameter of 7 mm, installed along the diagonal of an acrylic container measuring 10 cm on each side.
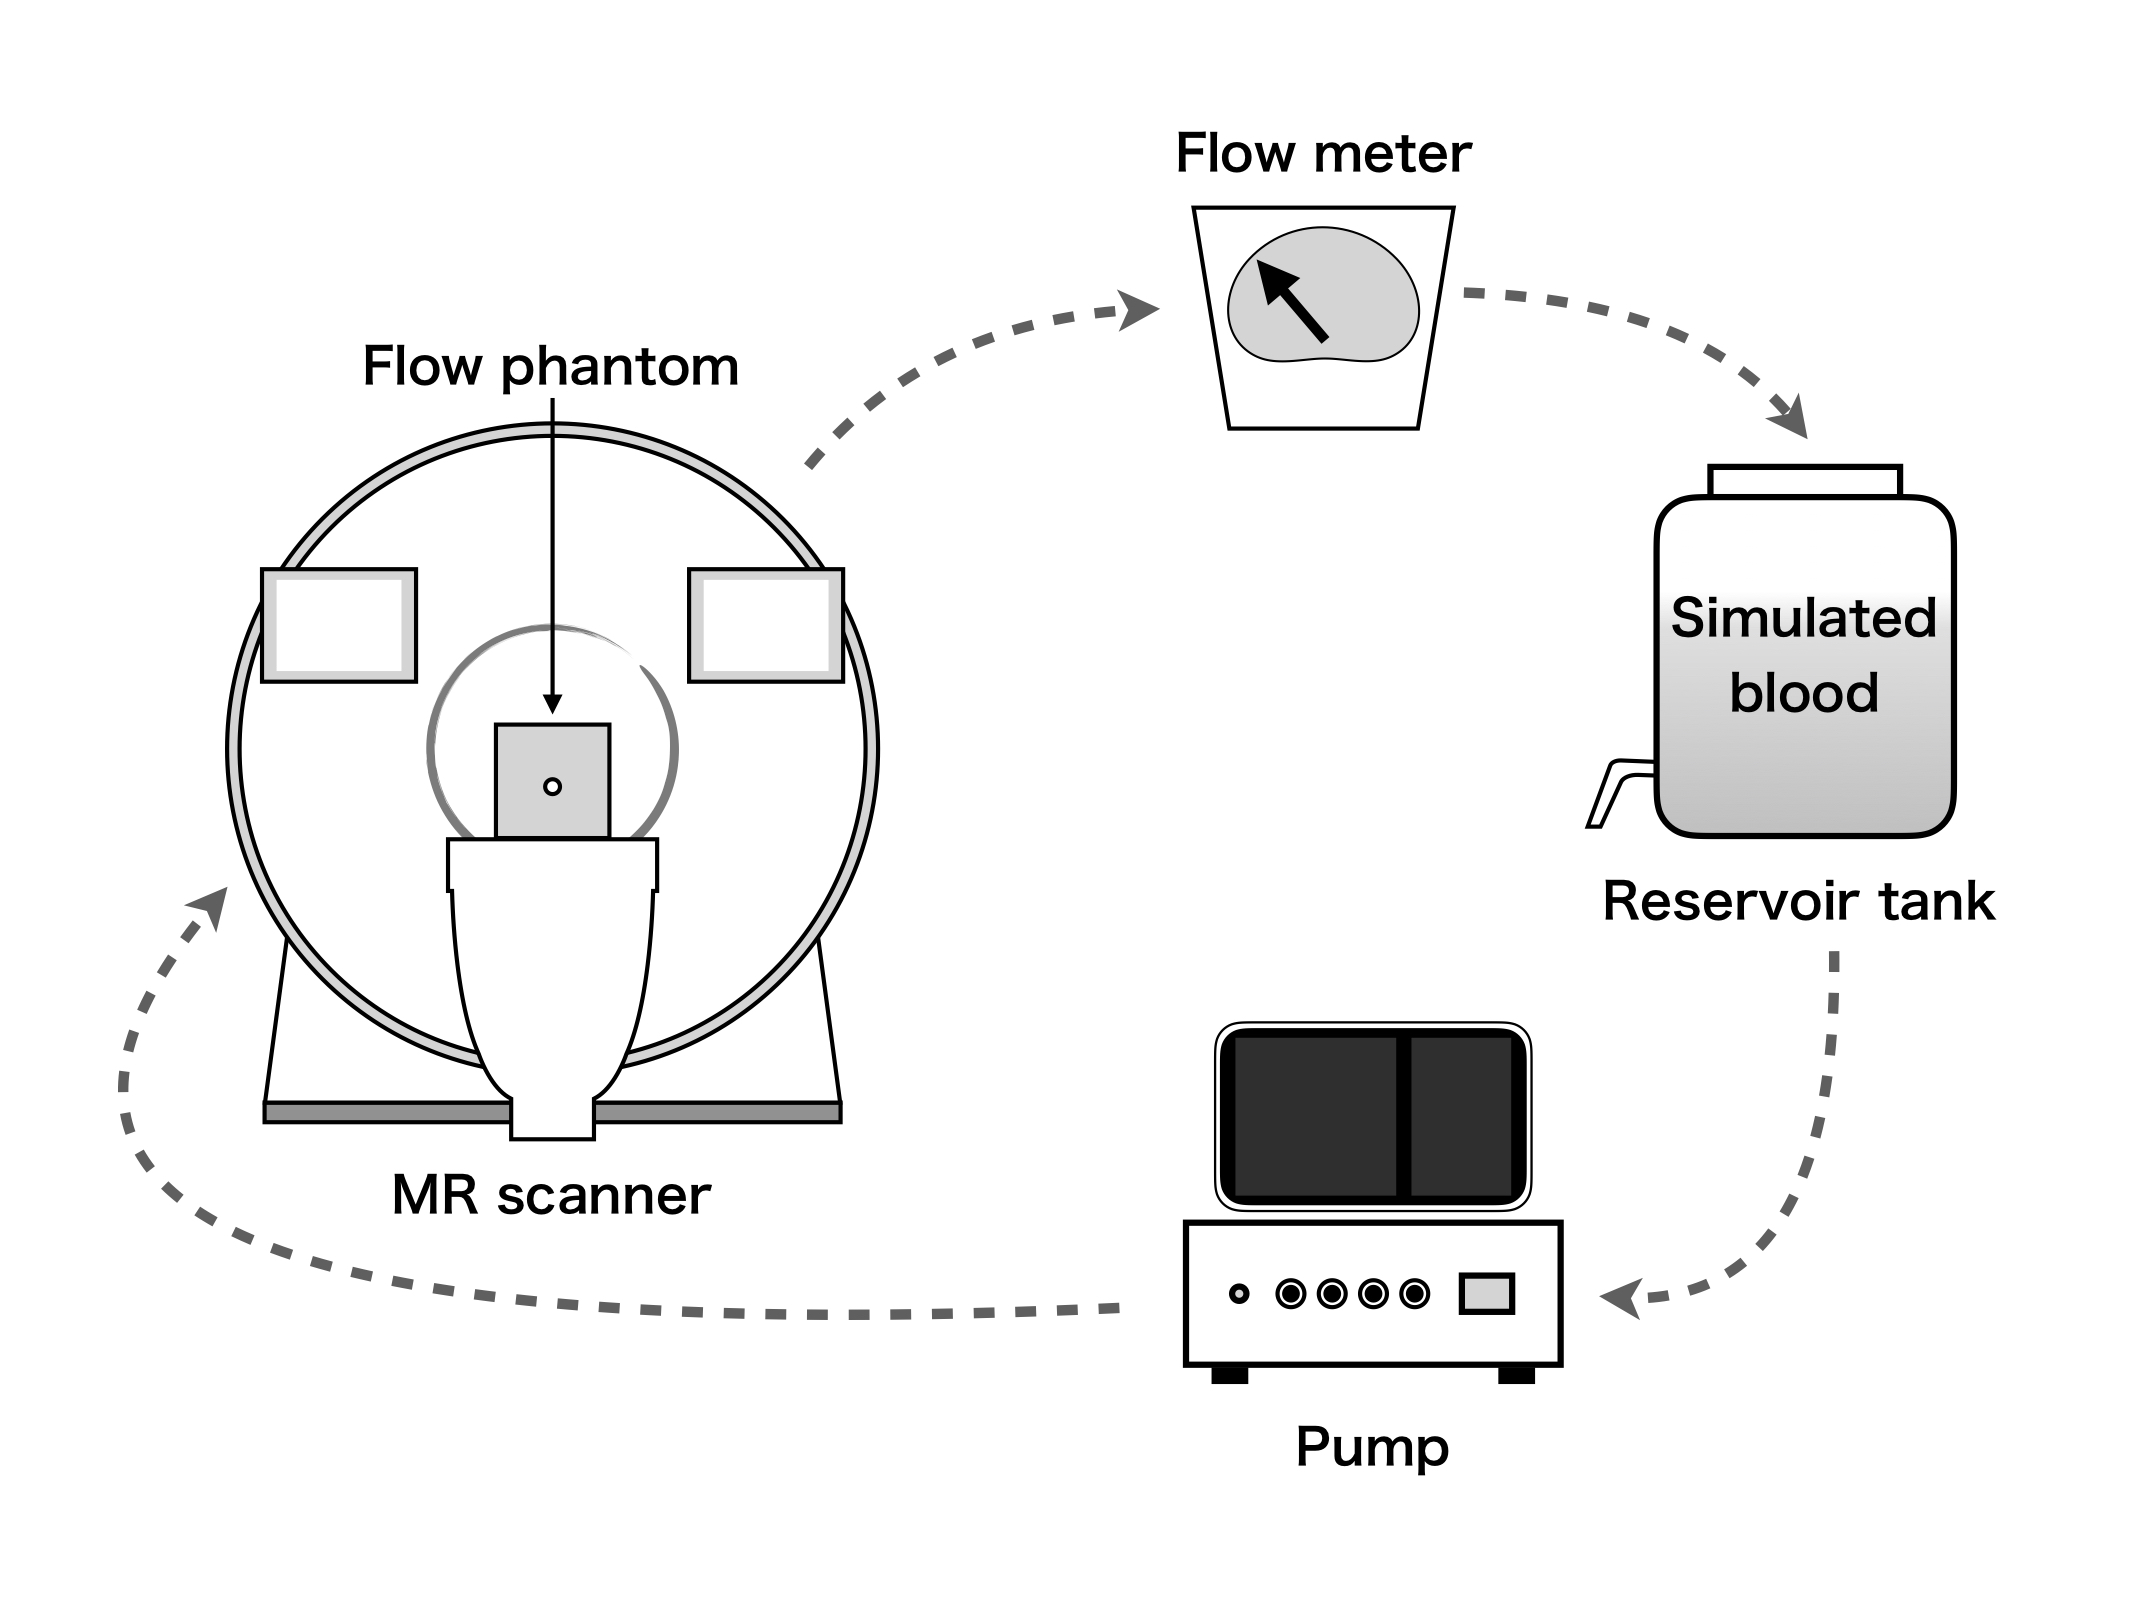
Schema of flow experiment
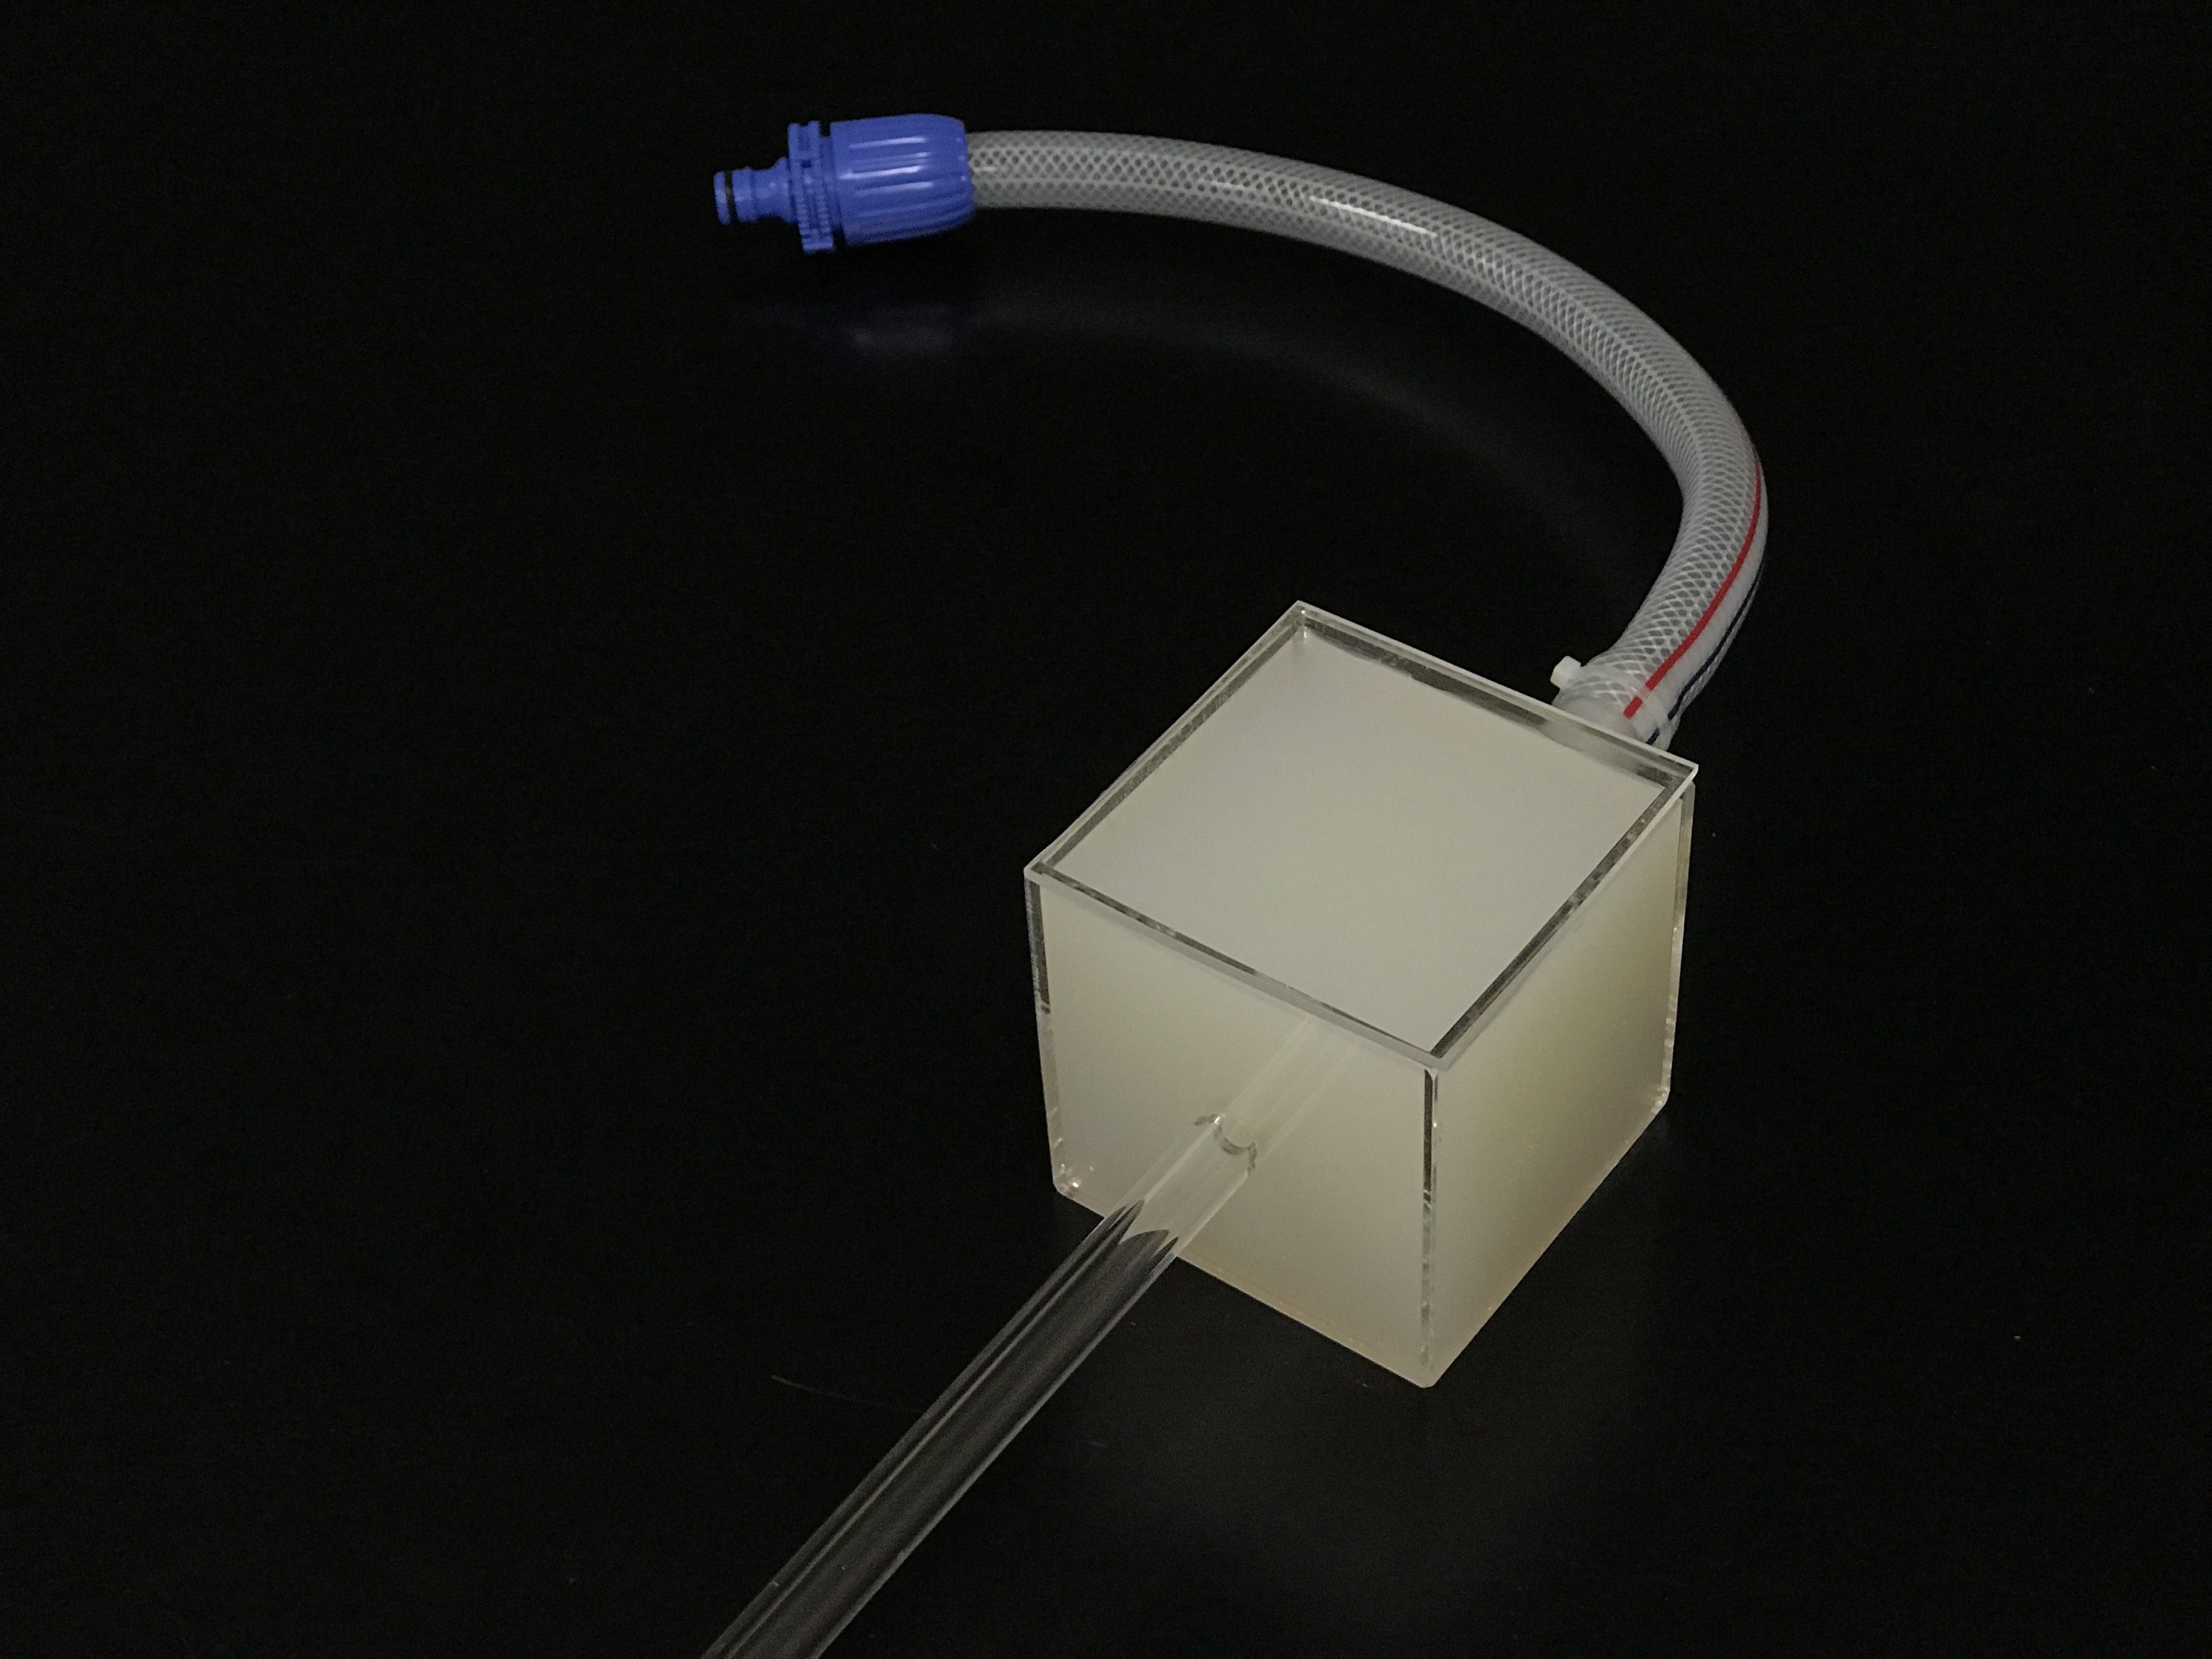
Flow phantom (B)
was an acrylic tube with an inner diameter of 8 mm, installed in an acrylic container measuring 10 cm on each side.
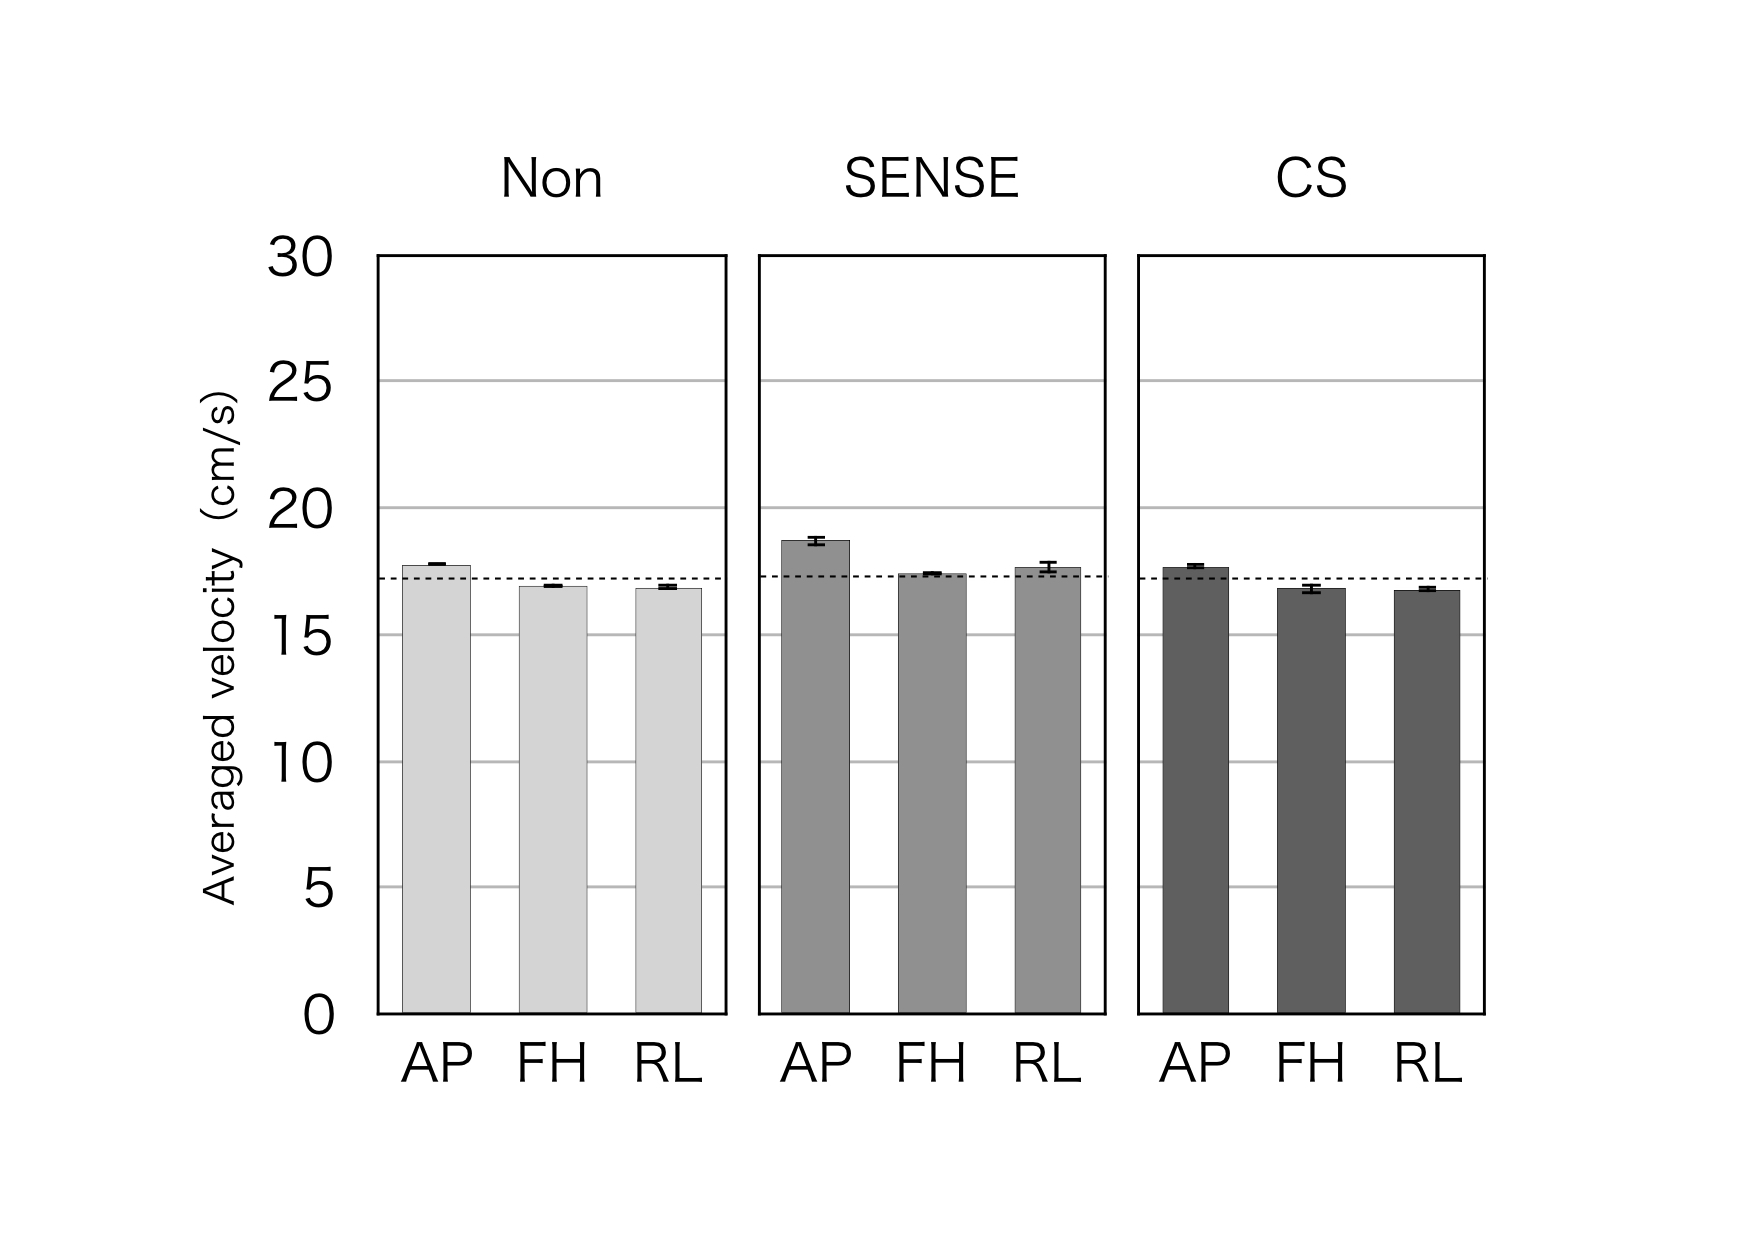
The average velocities of the simulated blood in the three directions.
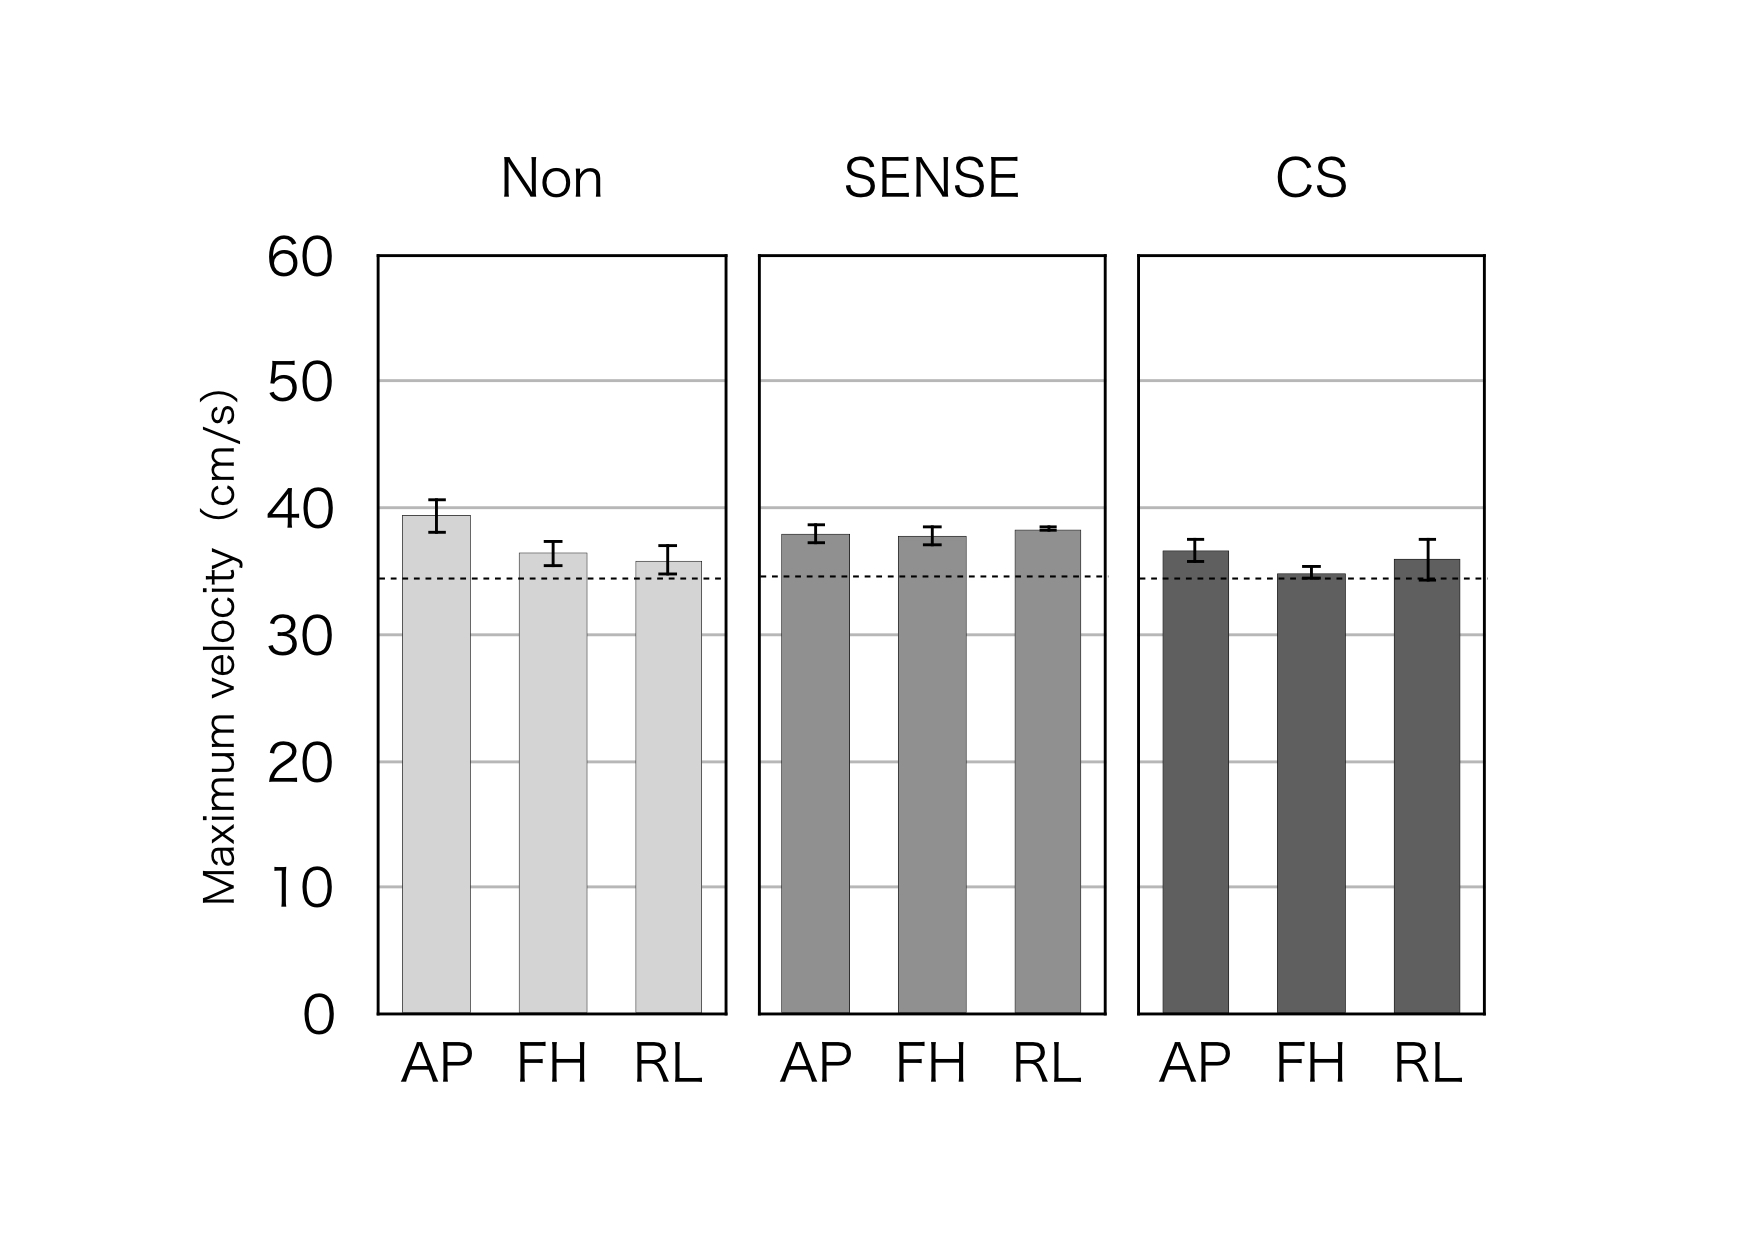
The maximum velocities of the simulated blood in the three directions.
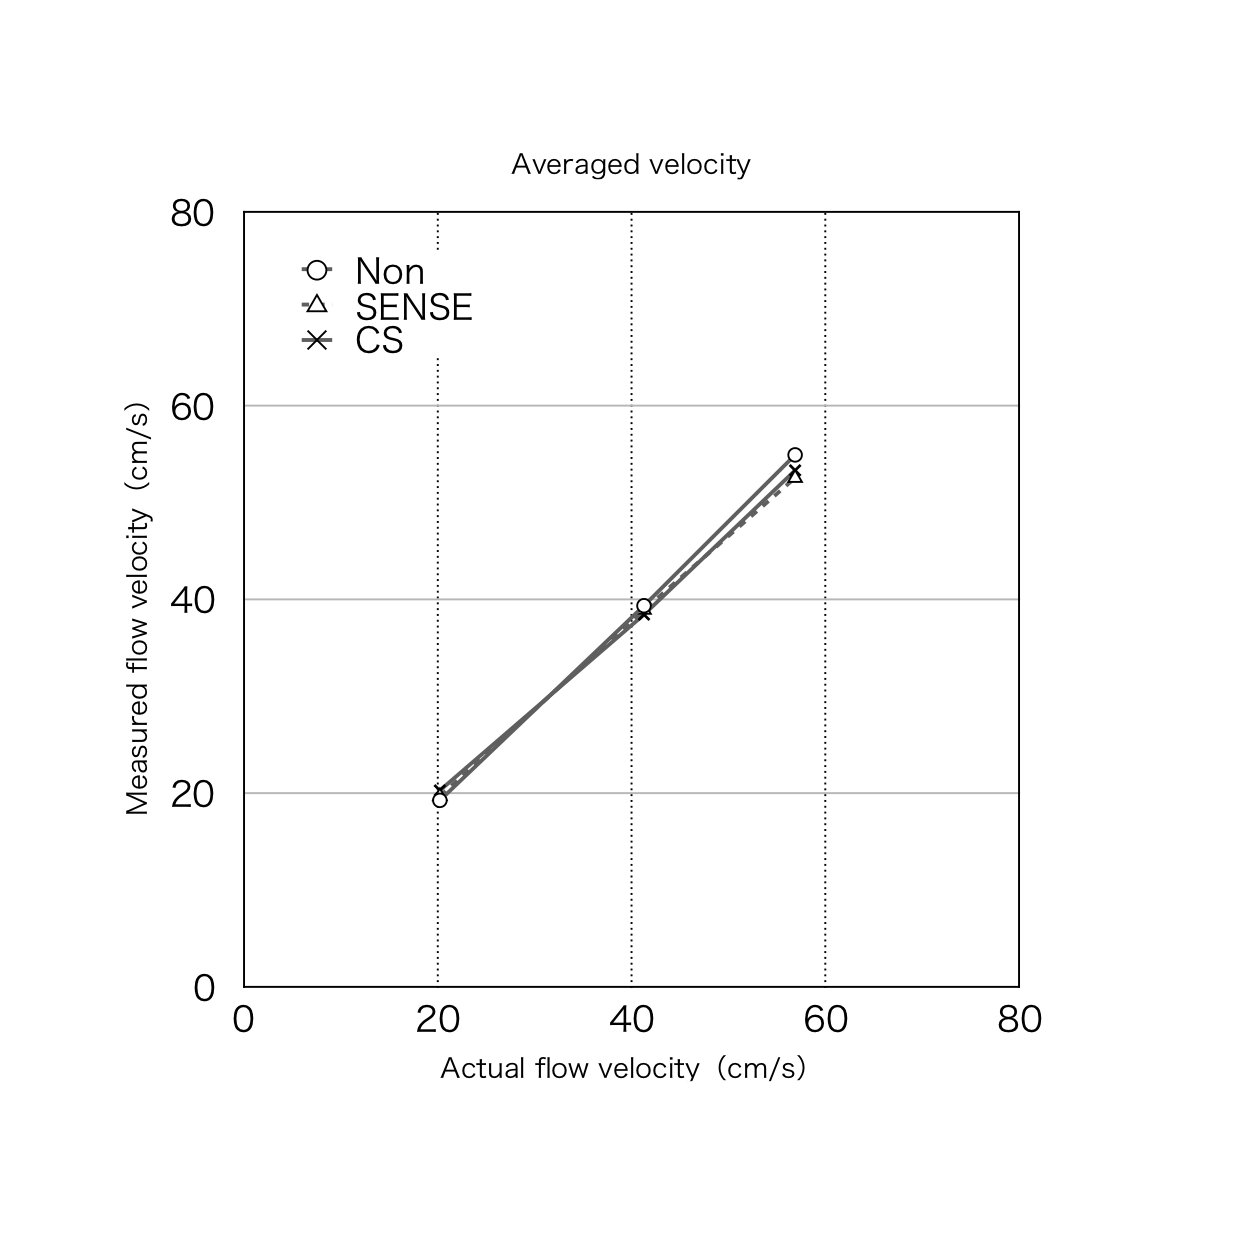
The average velocities when the flow rate was varied.
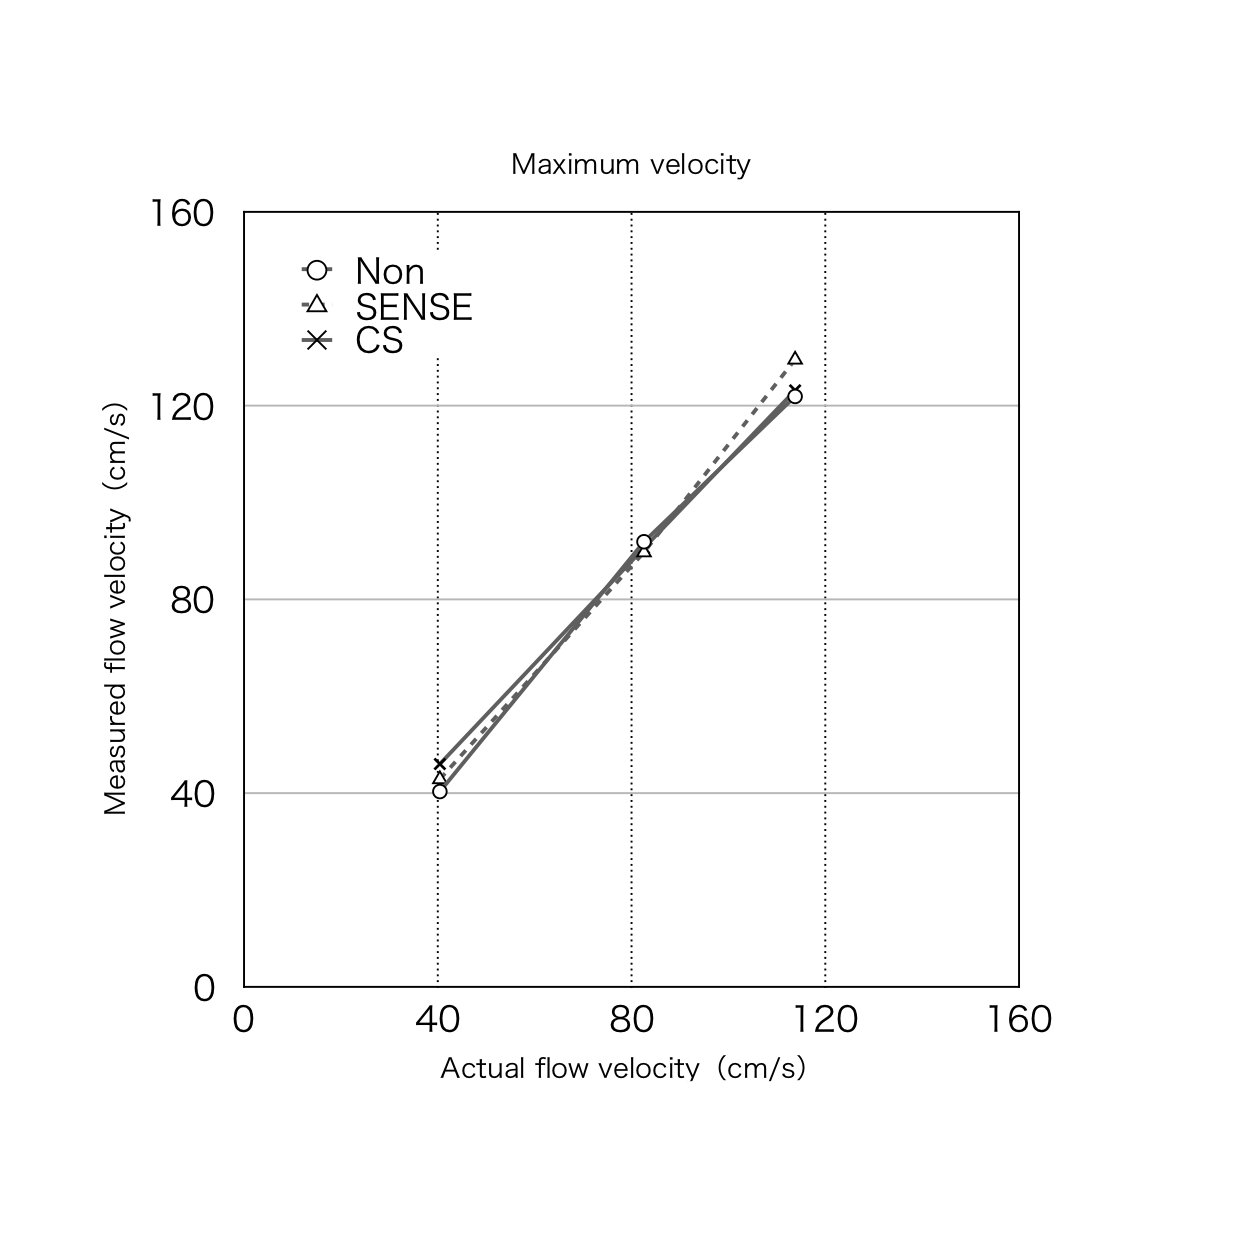
The maximum velocities when the flow rate was varied.