S7
FA Value After 1 Week Decompressive Surgery is a Prognostic Factor in Patients with CSM1Radiology, Otaru General Hospital, Otaru, Hokkaido, Japan, 2Neurosurgery, Otaru General Hospital, Otaru, Hokkaido, Japan, 3Nuclear of Medicine, Hokkaido University, Sapporo, Hokkaido, Japan, 4Radiology, Philips Healthcare, Tokyo, Japan
Synopsis
We evaluated the perioperative FA change in CSM patients using ZOOM DTI. As a result, the FA value after decompression surgery showed the proper state of the damaged cord and had a significant positive relationship with the patient’s outcome. The postsurgical FA value can become an accurate prognostic factor. Besides, the presurgical FA value did not have any relationships with the patient’s outcome, the reason why that a masking effect as an “Aligned Fibers Effect” due to strongly stenosis even using fine resolution DTI.
Purpose
Cervical spondylotic myelopathy (CSM) is the most common cause of spinal cord dysfunction. Intracordal high intensity on T2WI may be a prognostic factor; however, the signal does not always indicate the irreversible state of the cervical spinal cord lesion nor correlate with a clinical outcomes1, 2. To date, Diffusion Tensor Imaging (DTI) for the spinal cord have been performed; however, the smaller cross-sectional area of the cord and the environmental disadvantage of being surrounded by tissues that have a variety of magnetic susceptibility can lead to questionable study results, particularly with regard to the accuracy of the acquired quantitative values. Given the above, novel techniques such as ZOnally Oblique Multislice (ZOOM) DTI in 3T MRI have been developed (Figure 1). The purpose of this study is to reveal the possibility of the quantitative estimation with CSM patients by the prerioperative change of FA value with ZOOM DTI.Methods
[MRI] Ingenia 3.0T (PHILIPS, Best, Netherlands).[Statical analysis software] JMP version 12 (SAS Institute Inc., Cary, NC, USA.).
[Subjects] 28 CSM patients were enrolled in this study. The group consisted of 15 males (54%) and 13 females (46%), aged 42-92 years (mean 71.3±12.7 years). 20 patients (71%) had intracordal high intensity before surgery. All patients underwent decompressive surgery. ZOOM DTI and Japanese Orthopedic Association (JOA) assessment were performed before surgery (pre) and at 1 Week (1w), 6 Months (6m), and 1 year after surgery (1y). Twelve normal controls were also included in this study for comparison to the CSM patients (Table 1).
[Quantitative analysis] The FA map was calculated on ZOOM DTI. The FA value of the spinal cord were measured. The ROI was manually contoured around the whole spinal cord as large as possible; however, the CSF was omitted by checking a three-dimensional ROI cube. All operations were performed using Fiber Track, which is the software in the MRI scanner (Figure 2). This procedure was repeated from the C3/4 level to the C6/7 level in all patients and controls. The axial plane of the most stenotic (compressed) cervical level, which was the area of the target lesion in all patients, was used for assessment. A repeated measures design and the Tukey-Kramer method were used for comparison between each time point (p<0.05).
Results
1)Control vs CSM patients in FA values There was no significant difference between patients and normal controls (Table 2). We excluded this level, because of the small number of patients with CSM (n=3) in whom the target lesion occurred at the C6/7 level.2)Perioperative change in FA values The mean values of FA value were the followings; Pre = 0.569 ± 0.114, 1w = 0.485 ± 0.096, 6m = 0.556 ± 0.103 (Table 2). There were significant differences between FA pre and 1w (p=0.0076) and between FA 1w and 6m (p=0.0442). The FA value of the intracordal T2WI high group significantly decreased after surgery (p=0.0049) and significantly increased from 1w to 6m(p=0.0390), while the FA value of patients without intracordal high intensity did not undergo any significant changes (Table 3).
3) Prognostic assessment JOA 6m (13.1) improved significantly compared to JOA pre (10.8) (p=0.0003) (Table 4). Only FA 1w had a significant positive relationship with JOA pre and 6m (r=0.552 and 0.517, P=0.0142 and 0.0233, respectively) (Figure 3).
Discussion
In the previous studies of CSM with a low resolution on conventional DTI, FA value before surgery is significantly lower than that of healthy controls3-6, in contrast to our results. This result suggests that the measurement of FA value on the spinal cord is contaminated by CSF due to insufficient image quality7. Therefore, the measurement accuracy in conventional DTI is not reliable. ZOOM DTI can provide superior image quality demonstrated in Figure 1. In ZOOM DTI, even in patients with the destruction of spinal nerve, the presurgical FA value did not differ from the normal controls. Hence, the preoperative FA value in CSM patients is not necessarily lower. In our hypothesis, on the stenosis site, the vectors of the molecular movement in compressed and aligned neural fibers leads to a uniform direction. As a result, FA value slightly increases in spite of the patients with T2WI high signal corresponding nerve destruction. This phenomenon, which we named “Aligned-Fibers-Effect”, can be explained that uniformed direction fiber masked the damaged edematous spinal cord by offsetting the dispersion of vectors. The significant decrease in the FA value after surgery demonstrates the proper state of the cord by omitting the preoperative “Aligned-Fibers-Effect” Unfortunately, conventional DTI can not distinguish these effect. That is, the preoperative FA value is determined by the balance between injury with edema and compression of the spinal cord. Therefore, the postoperative FA value can be a prognostic factor. In our study, only FA 1w had a significant positive relationship with JOA pre and 6m, which proves our above hypothesis.Conclusion
The presurgical FA value in CSM patients did not differ from the normal controls, but significantly decreased after cervical decompression surgery, which was remarkable in intracordal T2WI high signal intensity patients. We concluded that FA 1w value can be a prognostic factor.Acknowledgements
The authors would like to thank Philips Healthcare for supporting this study.References
1. Lin E, Long H, Li G, Lei W. Does diffusion tensor data reflect pathological changes in the spinal cord with chronic injury. Neural regeneration research 2013;8(36):3382-3390. doi: 10.3969/j.issn.1673-5374.2013.36.003
2. Ellingson BM, Salamon N, Hardy AJ, Holly LT. Prediction of Neurological Impairment in Cervical Spondylotic Myelopathy using a Combination of Diffusion MRI and Proton MR Spectroscopy. PloS one 2015;10(10):e0139451. doi: 10.1371/journal.pone.0139451
3. Cui JL, Li X, Chan TY, Mak KC, Luk KD, Hu Y. Quantitative assessment of column-specific degeneration in cervical spondylotic myelopathy based on diffusion tensor tractography. European spine journal : official publication of the European Spine Society, the European Spinal Deformity Society, and the European Section of the Cervical Spine Research Society 2015;24(1):41-47. doi: 10.1007/s00586-014-3522-5
4. Demir A, Ries M, Moonen CT, Vital JM, Dehais J, Arne P, Caille JM, Dousset V. Diffusion-weighted MR imaging with apparent diffusion coefficient and apparent diffusion tensor maps in cervical spondylotic myelopathy. Radiology 2003;229(1):37-43. doi: 10.1148/radiol.2291020658
5. Facon D, Ozanne A, Fillard P, Lepeintre JF, Tournoux-Facon C, Ducreux D. MR diffusion tensor imaging and fiber tracking in spinal cord compression. AJNR American journal of neuroradiology 2005;26(6):1587-1594
6. Song T, Chen WJ, Yang B, Zhao HP, Huang JW, Cai MJ, Dong TF, Li TS. Diffusion tensor imaging in the cervical spinal cord. European spine journal : official publication of the European Spine Society, the European Spinal Deformity Society, and the European Section of the Cervical Spine Research Society 2011;20(3):422-428. doi: 10.1007/s00586-010-1587-3
7.Y Liu et.al, Correlation between diffusion tensor imaging parameters and clinical assessments in patients with cervical spondylotic myelopathy with and without high signal intensity
Figures
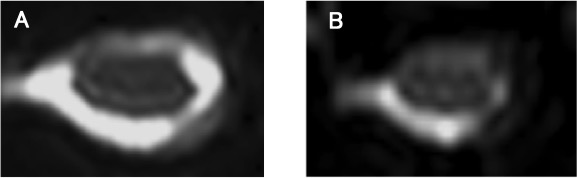
Figure 1. The image of ZOOM and conventional DTI
Diffusion weighted b=0 image of ZOOM DTI (A) has better visibility than that of conventional DTI (B).
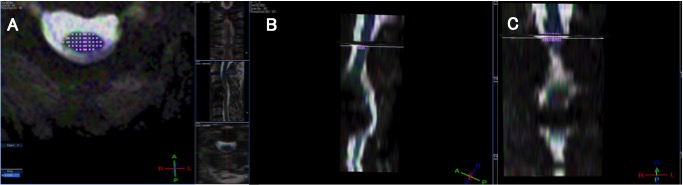
Figure 2. The setting of the ROI:
The ROI was made to be as large as possible to omit the surrounding CSF (A: axial, B: sagittal, C: coronal).
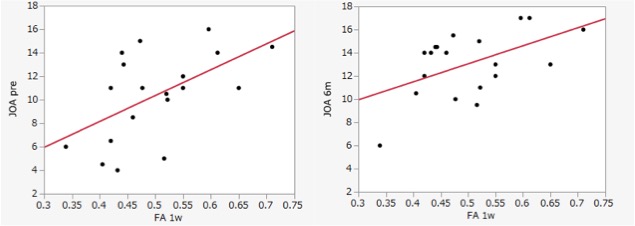
Figure 3. Correlation with FA 1w and JOA score (pre, 6m)
A significant positive relationship was shown(r=0.552 and 0.517, P=0.0142 and 0.0233).
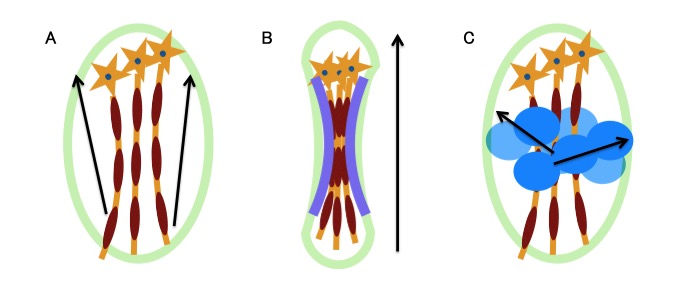
Figure 4. Aligned-Fibers-Effect
A. Normal state.
B. Compressed fibers leads to uniform vectors.
C. Decompressed fibers permit varied direction.
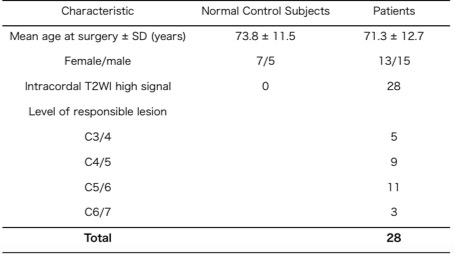
Table 1. Summary of Patient Characteristics
Values are number or as otherwise indicated.
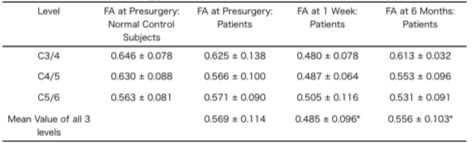
Table 2. Fractional Anisotropy Value at Each Level
Values are mean ± SD.
*Significant difference by repeated-measures design.
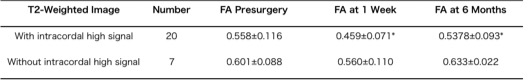
Table 3. FA Change of Patients with and without Intracordal High Signal
*Significant difference by repeated-measures design.
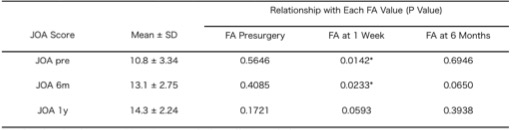
Table 4. Prognostic Assessment by the Japanese Orthopedic Association Assessment
*Significant difference by repeated-measures design.