S62
Is B1+rms as reliable as we think? A quantitative review.1Royal Melbourne Hospital, Melbourne, Australia
Synopsis
Specific Absorption Rate (SAR) and B1+rms are two radiofrequency (RF) exposure metrics used in MRI. The monitoring of RF exposure in patients with implants is crucial for ensuring compliance with specific implant scanning conditions. As SAR can be highly variable many implants now state a B1+rms value to allow scanning of conditional implants. However, more recently several scanner manufacturers have stated that the actual B1+rms value recorded during scanning may be higher than the predicted value. This could impact the scanning of patients with conditional implants and potentially compromise patient safety.
Purpose
Scanners estimate the SAR of each acquisition on the basis of technical details for that sequence, and patient weight. The SAR reported by the scanner is a quantitative estimate with some degree of inaccuracy (1). This can lead to underestimating of RF exposure levels, which has the potential to cause tissue heating and thermal injury (2). Nowadays active implants may also include a B1+rms value, a more precise RF exposure metric than SAR because it is the fundamental RF field parameter related to MRI images creation (3). It is independent of patient characteristics but depends upon flip angle, pulse type, number of echoes, slices, and TR.When scanning patients with conditional implants technologists rely on these RF exposure values to comply with specific device conditions. The purpose of this study was to investigate if the predicted B1+rms levels differ from the actual values obtained.
Methods
23 patients, with varying body habitus, were scanned on two 1.5Ts and one 3T MRI scanner. The predicted B1+rms levels were obtained before the acquisition was commenced, and then the actual peak B1+rms values were obtained at varying time points during each sequence (30 seconds, 1 minute and 2 minutes). Variables such as field strength, body part and sequence type were additionally recorded.Results
See Figures 1 and 2Discussion
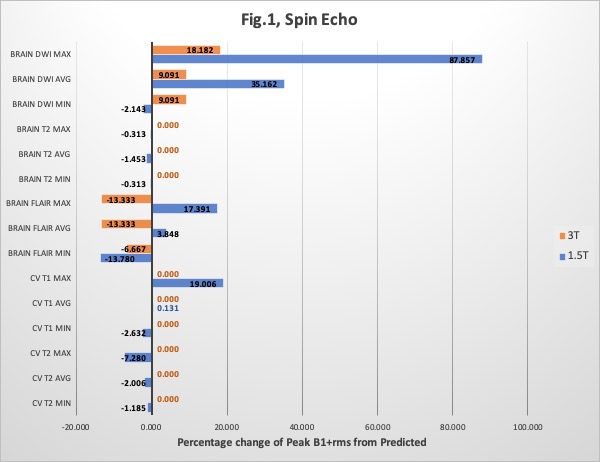
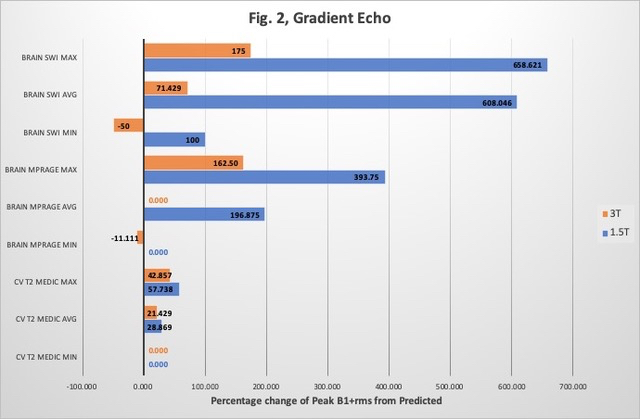
The data was separated into both Gradient Echo and Spin Echo sequences. The percentage difference of the peak B1+rms from the predicted value was then calculated [% change = (peak-predicted)/predicted*100]. Only the minimum and maximum range values, plus the median average were used for each of the variables on the graphs.Fig.1 displays five spin echo sequences at both 1.5T and 3T (brain and cervical spine) and Fig.2 three gradient echo sequences. Where peak B1+rms is lower than predicted, a negative percentage value is displayed.
Brain DWI sequences at 3T (Fig.1) shows that the minimum, maximum, and the median range are all positive percentage values. This includes an extreme peak of nearly 18% higher than predicted, however on review of the data, this difference equates to only 0.2uT. The same sequence at 1.5T showed only a slight negative value for the minimum range but the maximum was nearly 88%, equal to a 1.23uT increase. Overall the spin echo sequences of the cervical spine at 1.5T were either close to predicted B1+rms or lower. However, there was a maximum range of 19% but this could be an anomaly as it’s far from the median on Fig.1. At 3T there was no change and peak and predicted were identical, oddly showing that B1+rms of cervical spine is far more reliable at 3T than it was at 1.5T. Fig.1 shows a very similar pattern with brain T2 imaging.
There is less gradient echo data to analyse due to our department protocols (Fig.2). Nevertheless, there is substantially more positive percentage recordings than neutral or negative. Similarly, 1.5T again appears to predict B1+rms far more conservatively than 3T. The maximum range 1.5T SWI was 658% above predicted, which equates to a 1.9uT increase.
Data collection and time constraints of clinical scanning had proved to be a problem in this study, which could account for some of the anomalies. Department protocols additionally affected data collection due to scanner preferences for each area recorded.
A longer study time would allow further data to be collected for analysis. However, it is felt the trend of the gradient echoes being more unpredictable for B1+rms compared to spin echoes would continue. At this stage, the spin echoes appear to be more predictable and have a lower limit of error for prediction of B1+rms, especially at 3T over 1.5T. However, DWI is the major exception. Expanding the study further with different body regions could be included in a future study.
The results show 3T is more accurate than 1.5T. All three scanners used are from the same vendor, although running different software, which could have contributed to this. Collaborative studies with other sites using different vendor scanners could be of huge interest in exploring the impact vendor and software has on this.
Other variables recorded but later eliminated from analysis, due to the small sample size, included patient height, weight and calculated BMI. This could be an interesting angle to pursue further to investigate if different body habitus affects the ability to predict and deliver the same B1+rms.
Conclusions
Many manufacturers state a maximum B1+rms value for which an implant can be safely scanned. Before each sequence is commenced the predicted value is obtained, if below that set in the conditions the sequence proceeds. The results from this study show that many sequences can exceed the predicted values at various points during sequence acquisition. At times the actual value was considerably higher than the predicted, which has the potential to compromise patient safety.Caution needs to be taken when scanning these implants. The sequence needs to be continuously monitored during scanning and then stopped if it exceeds the maximum allowed value of that implant. Additionally, more testing by manufacturers could be helpful in determining the safety implications if this B1+rms value is exceeded at certain points within the sequence.
Acknowledgements
We would like to thank our MRI colleagues at The Royal Melbourne Hospital for their patience during data collection.References
1. Jerry Allisonand Nathan Yanasak. What MRI Seqences Produce the Highest Specific Absorption Rate (SAR), and Is There Something We Should Be Doing To Reduce the SAR During Standard Examinations?American Journal of Roentgenology, Volume 205, Issue 2
2. Di Qian et al. An RF dosimeter for independent SAR measurement in MRI scanners. Med Phys.2013 Dec; 40(12): 122303. Published online 2013 Nov 15. doi: 10.1118/1.4829527
3. V. M. F. Silva, I. M. Ramos, M. Marques, J. Moreira; Porto/PT. Magnetic resonance safety: are there new paradigms? Scientific Exhibit, ECR 2018
Figures