S52
The upper limit of accelerating on three-dimensional (3D) -TSE using compressed sensing MRI (CS)
Rui Imamura1, Hiroyuki Takashima1, Mitsuhiro Nakanishi1, Hiroshi Nagahama1, and Yoshihiro Akatsuka1
1Division of Radiology and Nuclear Medicine, Sapporo Medical University Hospital, Sapporo, Japan
1Division of Radiology and Nuclear Medicine, Sapporo Medical University Hospital, Sapporo, Japan
Synopsis
The CS technique has been applied to various sequence of MRI, which helped reduce the acquisition time while showing minimal effect on image quality. The aim of this study was to investigate the change of image quality and resolution with increase of acceleration factor, and reveal the upper limit of the number of acceleration factor of CS with 3D MRI. The line profile slope was significantly different with acceleration factor higher than 22 compared to without PI. Our results suggested that the upper limit of acceleration factor on T2WI with 3D-TSE was 22 because of decrease of resolution.
Background
Three-dimensional (3D) MRI can be used to acquire detailed morphologic data because its settings can be adjusted to obtain thin slices with a high signal-to-noise ratio.1 However, a long acquisition time are disadvantages of 3D MRI. Whereas the compressed sensing (CS) technique is a method to accelerate MR acquisition by acquiring undersampling k-space data. In several recent studies, the CS technique has been applied to various sequence of MRI, which helped reduce the acquisition time while showing minimal effect on image quality.2,3 Thus, 3D MRI combined with CS may be useful to short acquisition time with keeping image quality. However, the appropriate number of acceleration factor of CS is unclear.Purpose
The aim of this study was to investigate the change of image quality and resolution with increase of acceleration factor, and reveal the upper limit of the number of acceleration factor of CS with 3D MRI.Methods
A 3-Tesla MRI system (Ingenia; Philips Healthcare) was used for data acquisition in the present study. We scanned a bar pattern phantom containing water and acrylic. The imaging parameters were as follows; pulse sequence, 3D TSE T2-weighted image (WI); TR/ TE, 3000/ 600 ms; echo train length, 128; voxel size, 1× 1× 1 mm. The without parallel imaging (without PI) was defined as reference image. The CS technique in the present study, the technique was combined with SENSE and CS, called ‘Compressed SENSE’. The comparative images were acquired by changing the acceleration factor of CS from 1 to 32. For objective quantification of blurring and resolution, we measured the slope of the signal intensity from the line profile perpendicular to the bar pattern phantom (Fig.1). Moreover, accuracy of image restoration was evaluated using the structural similarity (SSIM) index. Repeated measures analysis of variance was used to evaluation for influence of CS.Results
The slope of acceleration factor 22 in y phase direction (0.429 ± 0.042) was significantly smaller than without PI (0.501 ± 0.013) (p < 0.01) (Fig.2). The slope in z direction was significantly different with acceleration factor 24 (0.338± 0.044) compared to without PI (0.513± 0.016) (p < 0.01) (Fig.3). The SSIM index of acceleration factor 22 was 0.959 (y phase direction) and 0.989 (z phase direction) (Fig.4).Conclusions
Our results suggested that the upper limit of acceleration factor on T2WI with 3D-TSE was 22 because of decrease of resolution.Acknowledgements
No acknowledgement found.References
1. Li, C. Q. et al. J Magn Reson Imaging (2014)
2. Delattre, B. M. A. et al. Eur Radiol (2019)
3. Lohofer, F. K. et al. Eur J Radiol (2019)
Figures
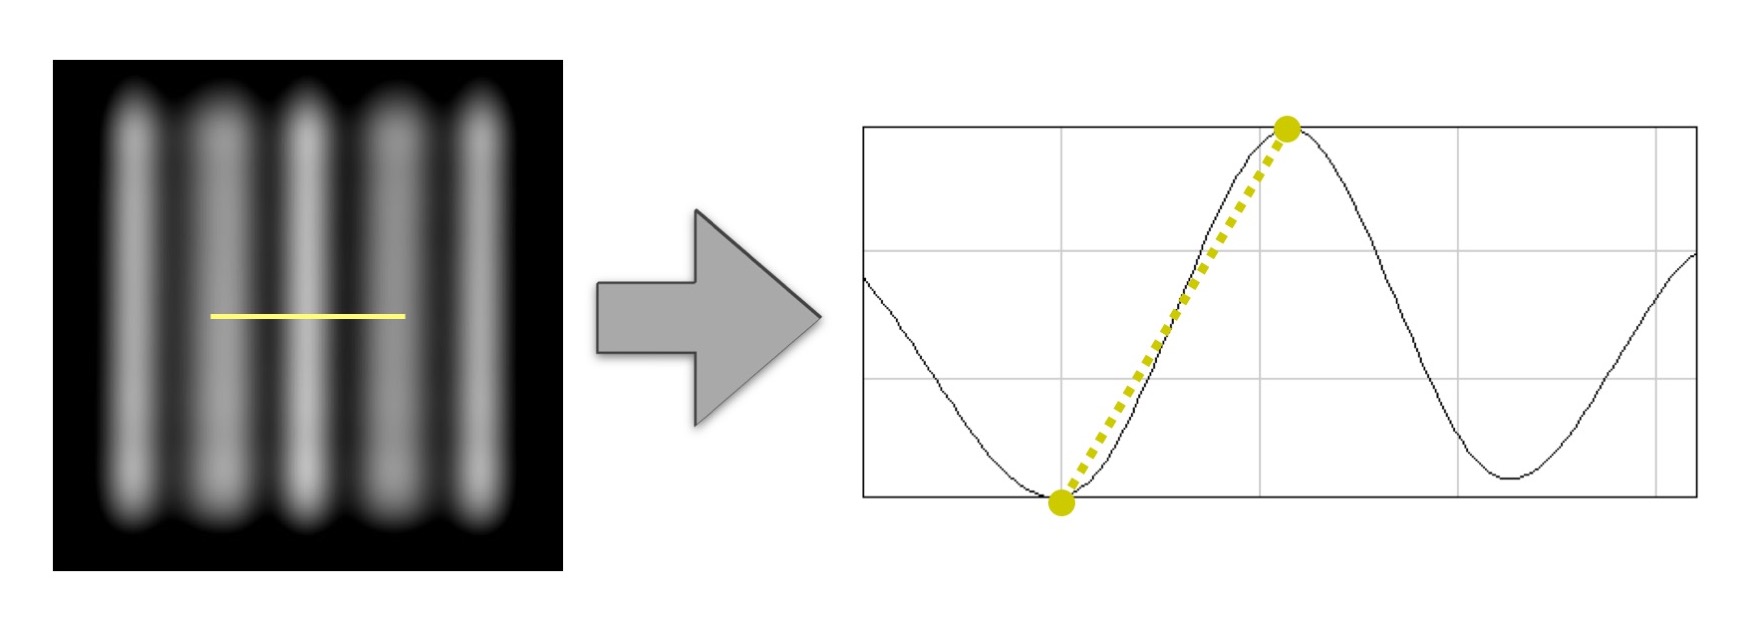
Comparison of the line profile slope at the bar pattern phantom. The line profile was drawn through center of bar pattern phantom.
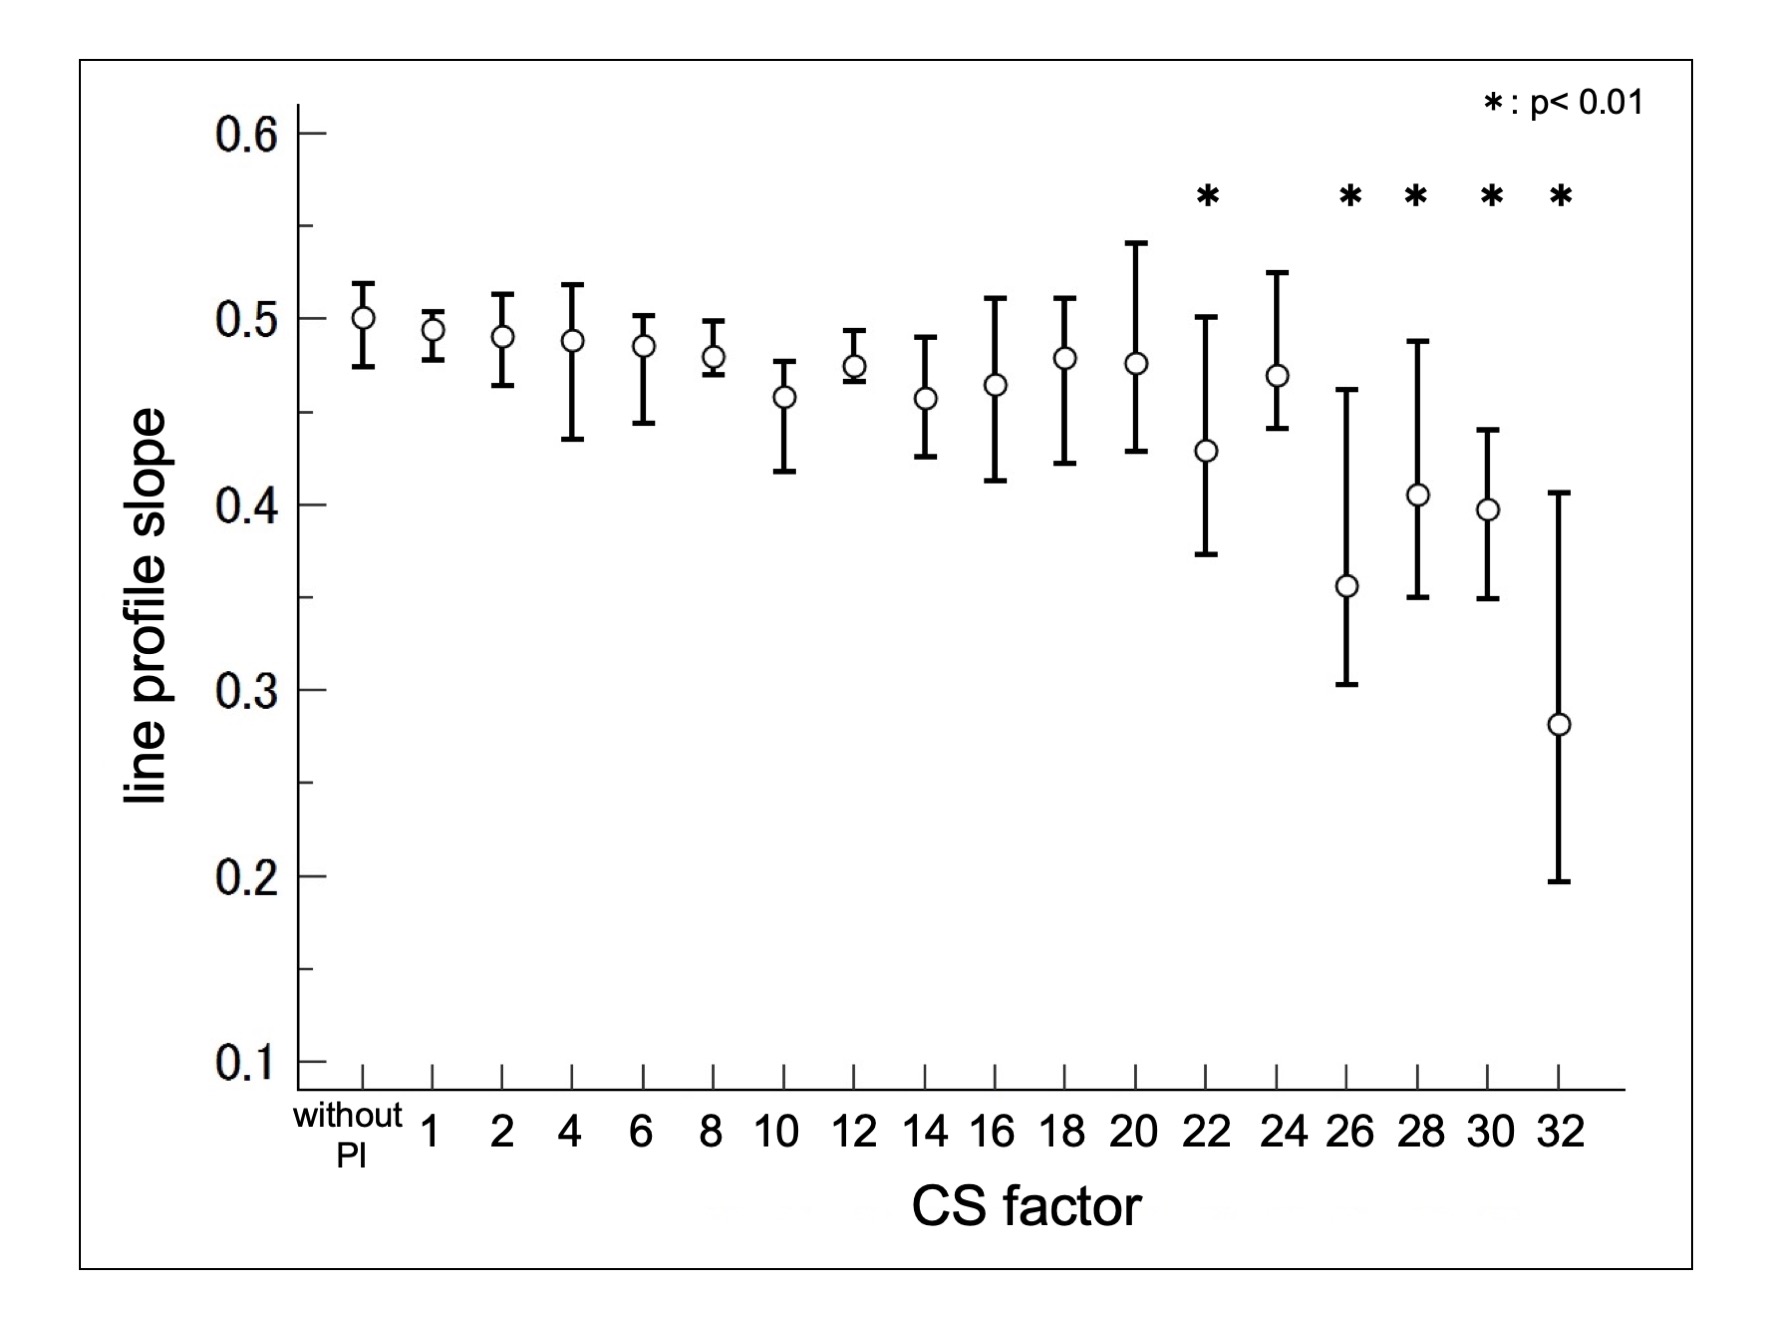
Line profile slope in the y phase direction.
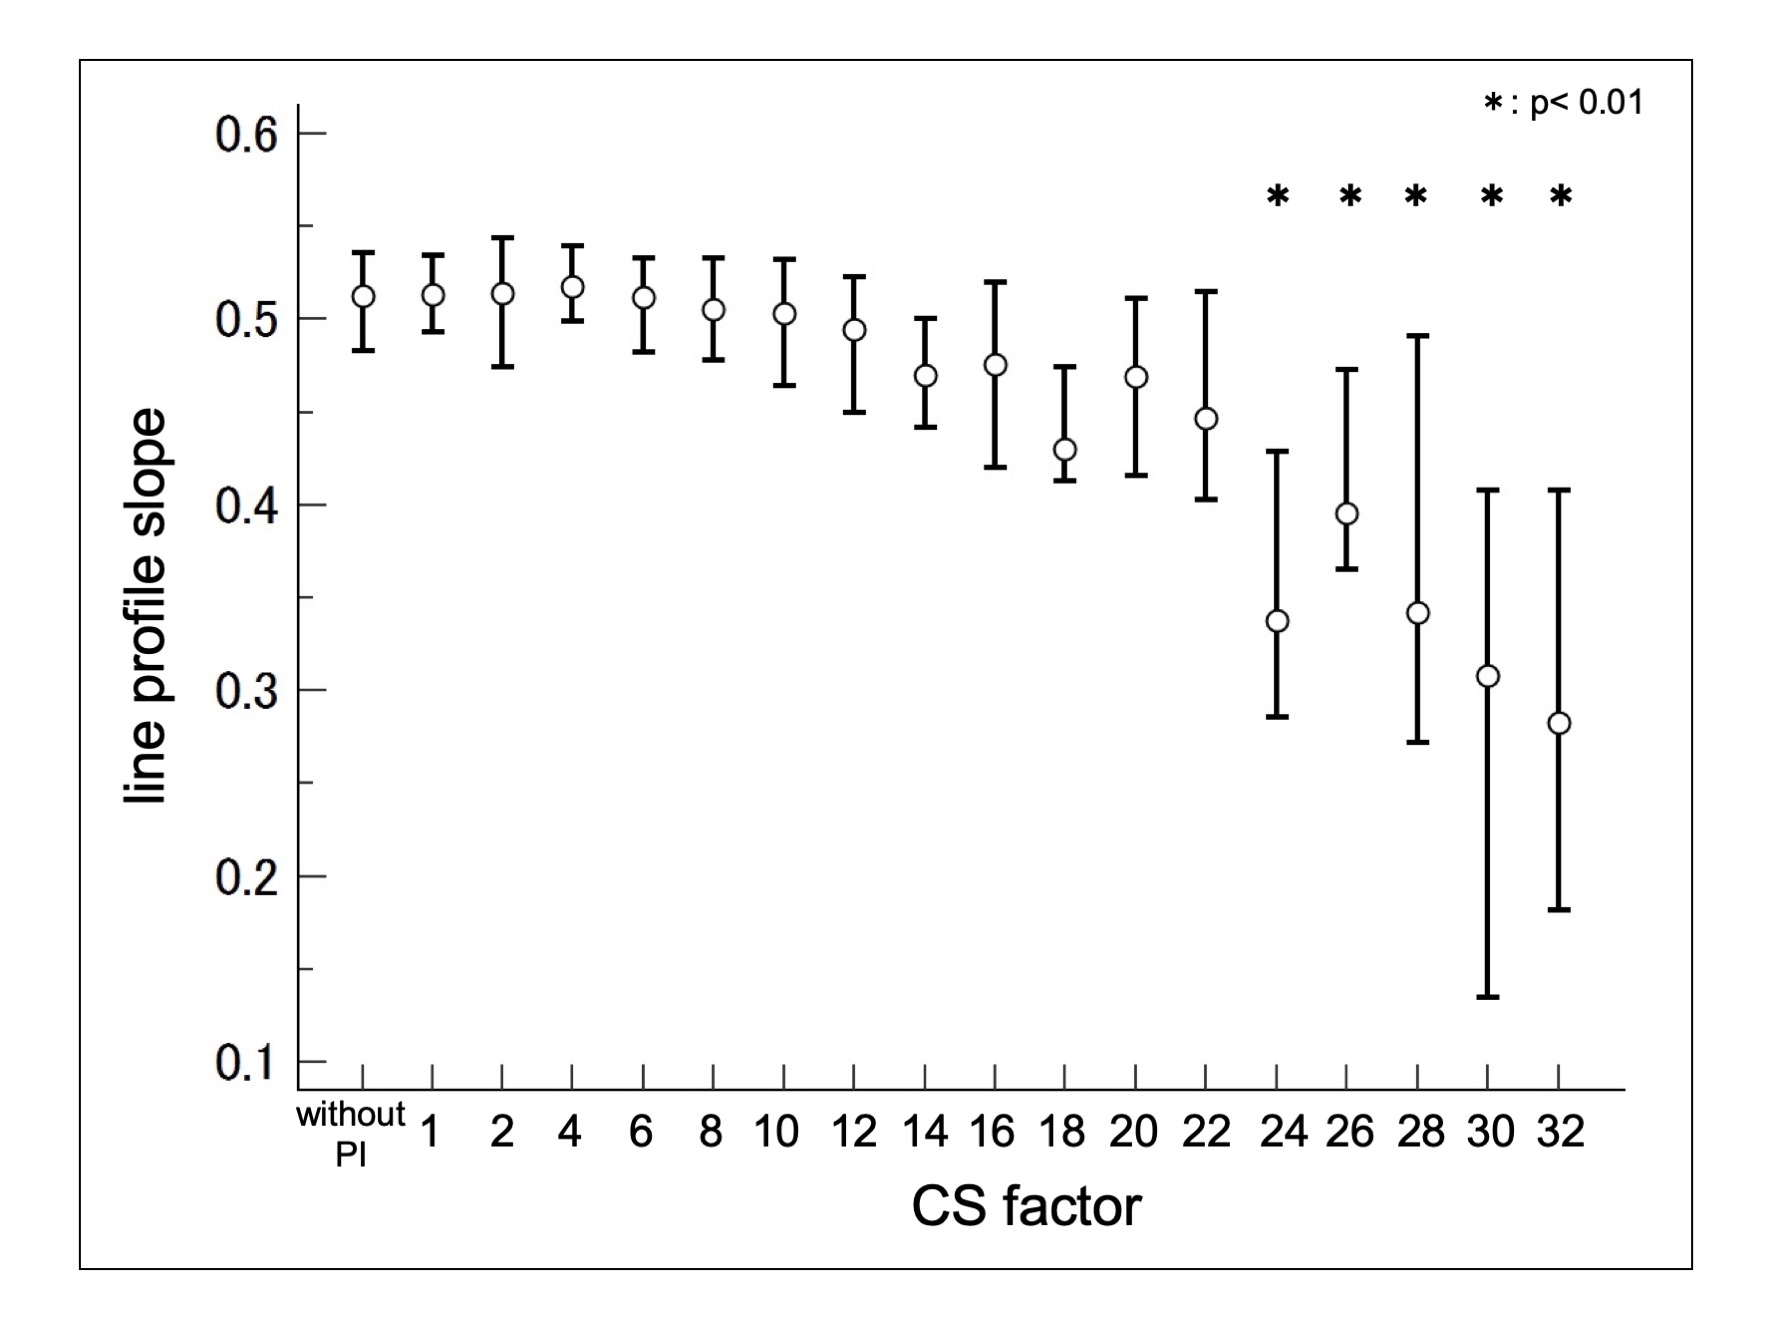
Line profile slope in the z phase direction.
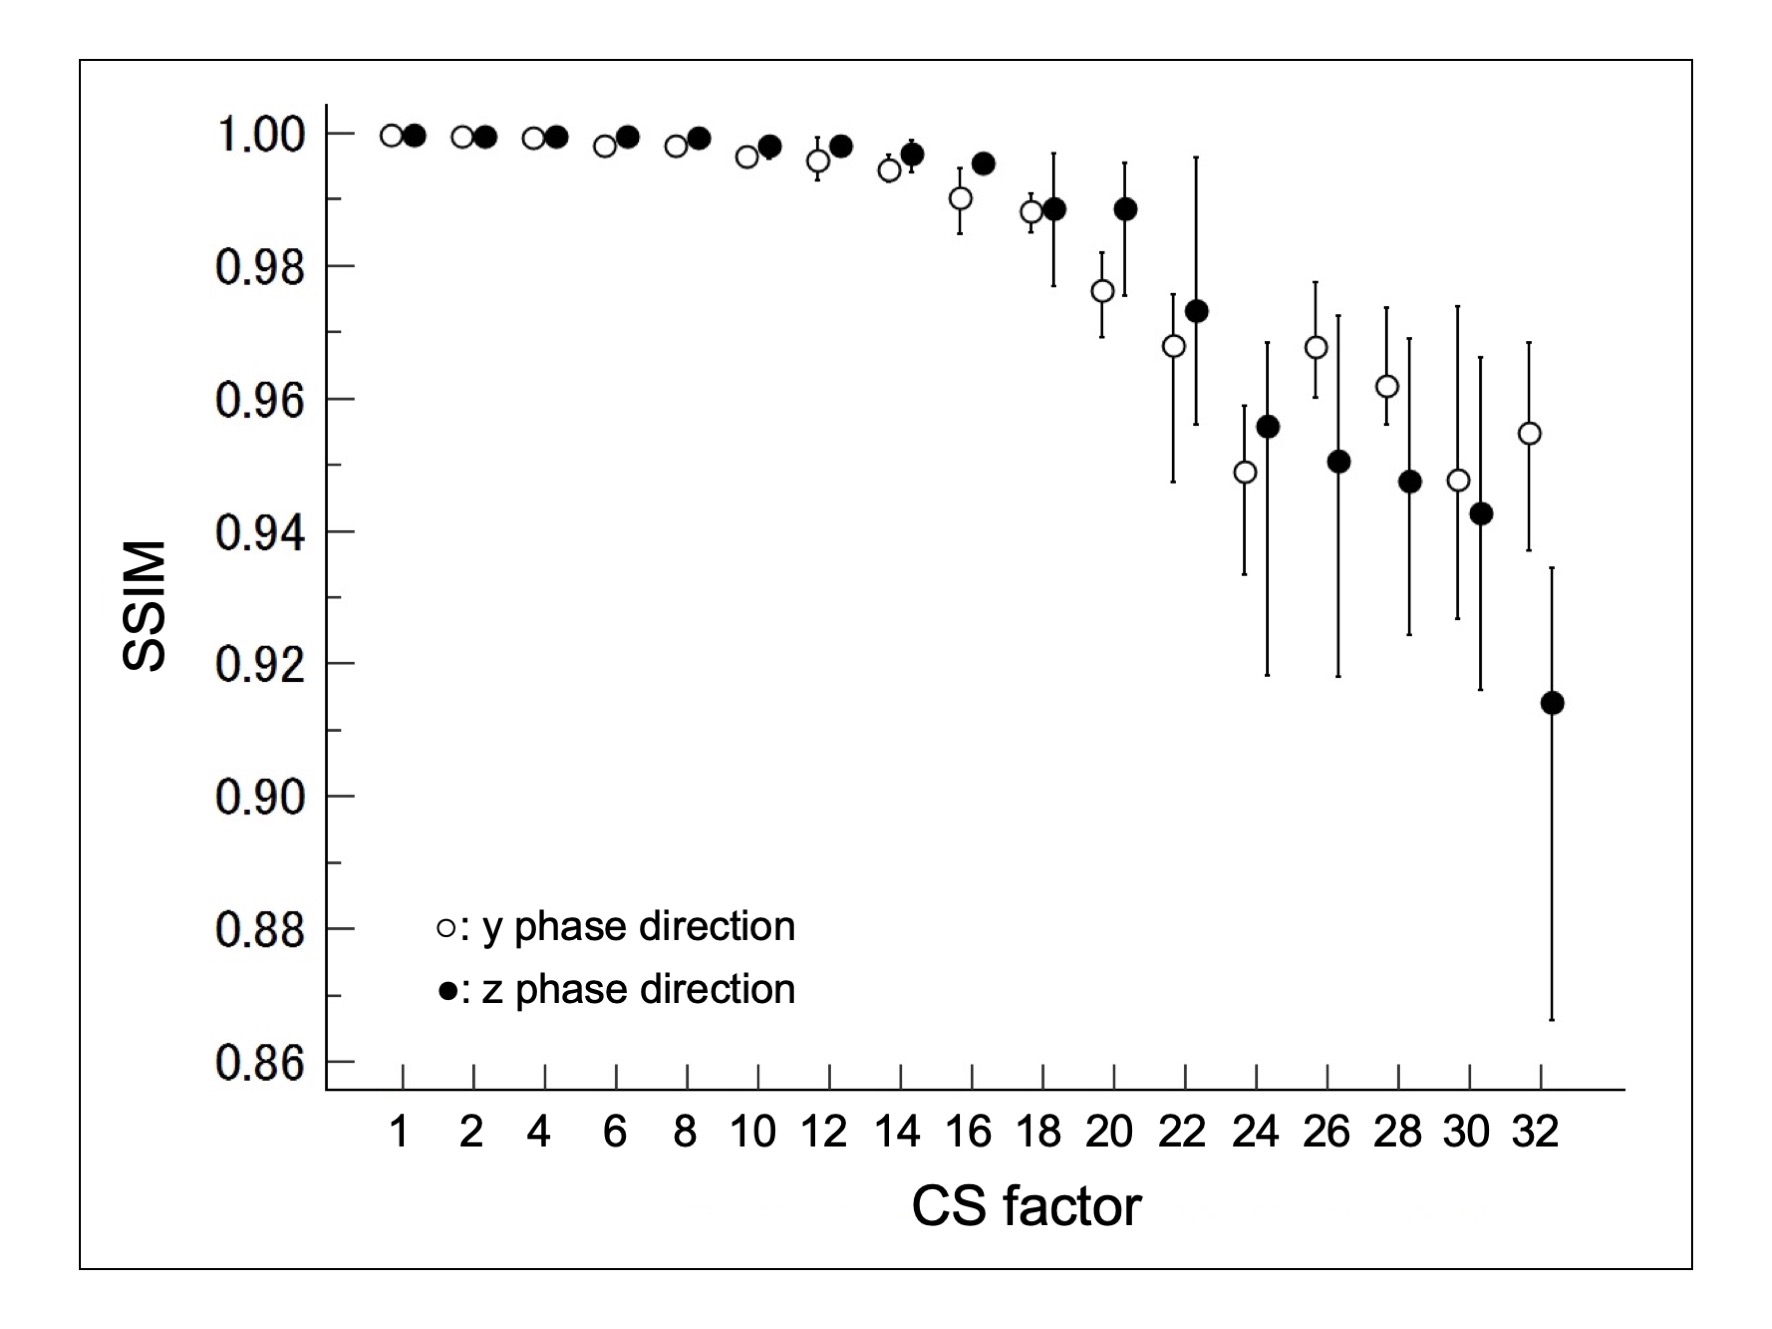
SSIM index in the y (open circles) and z (closed circles) phase direction.