S51
Iron overload detection in extra-hepatic organs on a high-performance 0.55T scanner1Division of Intramural Research, National Heart, Lung, and Blood Institute, National Institutes of Health, Bethesda, MD, United States
Synopsis
Normal iron storage can be found in the liver. When the liver becomes saturated with iron due to a primary or secondary disease process, the iron will deposit in targeted extra-hepatic organs. T2*-based imaging is a non-invasive tool for quantifying iron in an individual organ. This study compared the T2* imaging of extra-hepatic organs on a 1.5T and a prototype low field 0.55T. These results were then compared to blood ferritin levels and found to have a modest correlation.
Background
Iron overload can be a primary disease process via hyperabsorption from the gastrointestinal tract or secondary to chronic blood transfusion therapy for a disease such as sickle cell anemia. The liver is the main repository for iron in the body, but when the transferrin iron-binding capacity becomes saturated, the labile plasma iron becomes deposited in other organs such as the heart, pancreas, kidneys and pituitary, leading to iron overload in these organs. T2*-based MR Imaging is a non-invasive tool for quantifying the iron in an individual organ [1]. In cases of severe iron overload, when the burden of iron is too large, high field MRI systems (e.g. 3T) are unable to accurately assess the amount of iron due to high susceptibility. By virtue of the slower T2* decay, a lower field strength MRI scanner should be able to more accurately capture a broader dynamic range which allows for more sensitive detection of iron overload states. The goal of this study was to examine and compare T2* data from a clinical 1.5T and a research high performance 0.55T MRI scanner in extra-hepatic organs.Methods
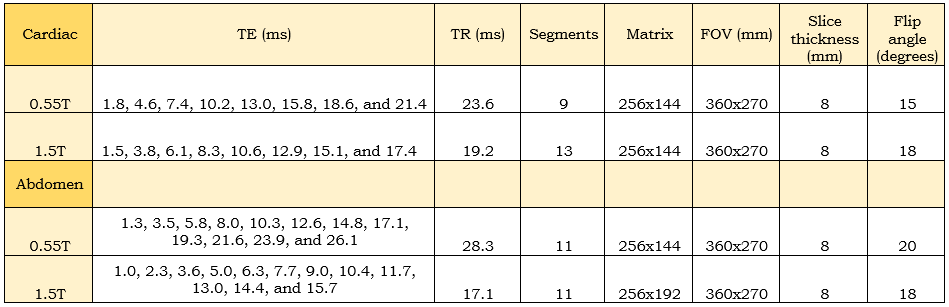
T2* mapping MRI was obtained on 34 patients (20 women, mean age, 40 years +/- 11) who were at risk of iron overload. In each study participant, T2* mapping was performed on a conventional 1.5T MR scanner (MAGNETOM Aera, Siemens AG, Erlangen, Germany) and a commercial 1.5T MRI system modified to operate at 0.55T (prototype MAGNETOM Aera, Siemens AG, Erlangen, Germany) on the same day. The prototype 0.55T MRI system maintained high-performance hardware and advanced imaging methods capable of fast T2* mapping pulse sequences. The primary goal of the protocol was to assess hepatic and myocardial T2* on a clinical 1.5T scanner compared to a high-performance low field 0.55T scanner. As a sub study, additional non-volumetric prescriptions through the pancreas and kidneys were acquired, if possible. A serum ferritin level was drawn within one day of the MRI studies. The T2* mapping multi-echo GRE sequence was cardiac triggered for the heart and abdomen imaging [2,3]. Parameters can be found in Figure 1. Fat suppression was used in the abdomen. The cardiac imaging was performed first at isocenter using a 6-channel body phased array coil and an 18-channel spine coil. After the cardiac imaging was complete, the phase-array coil was moved to the abdomen, and the organ being imaged was placed at isocenter. Regions of interest were drawn on the T2* maps within the liver, myocardial septum, the pancreas, and the kidneys using similar locations and sizes for both the 1.5T and 0.55T scanners, avoiding blood pool, fat, fluid, and anything else that would contaminate the measurement. T2* at 1.5T and 0.55T of these organs were compared to the clinical standard of serum ferritin.Results
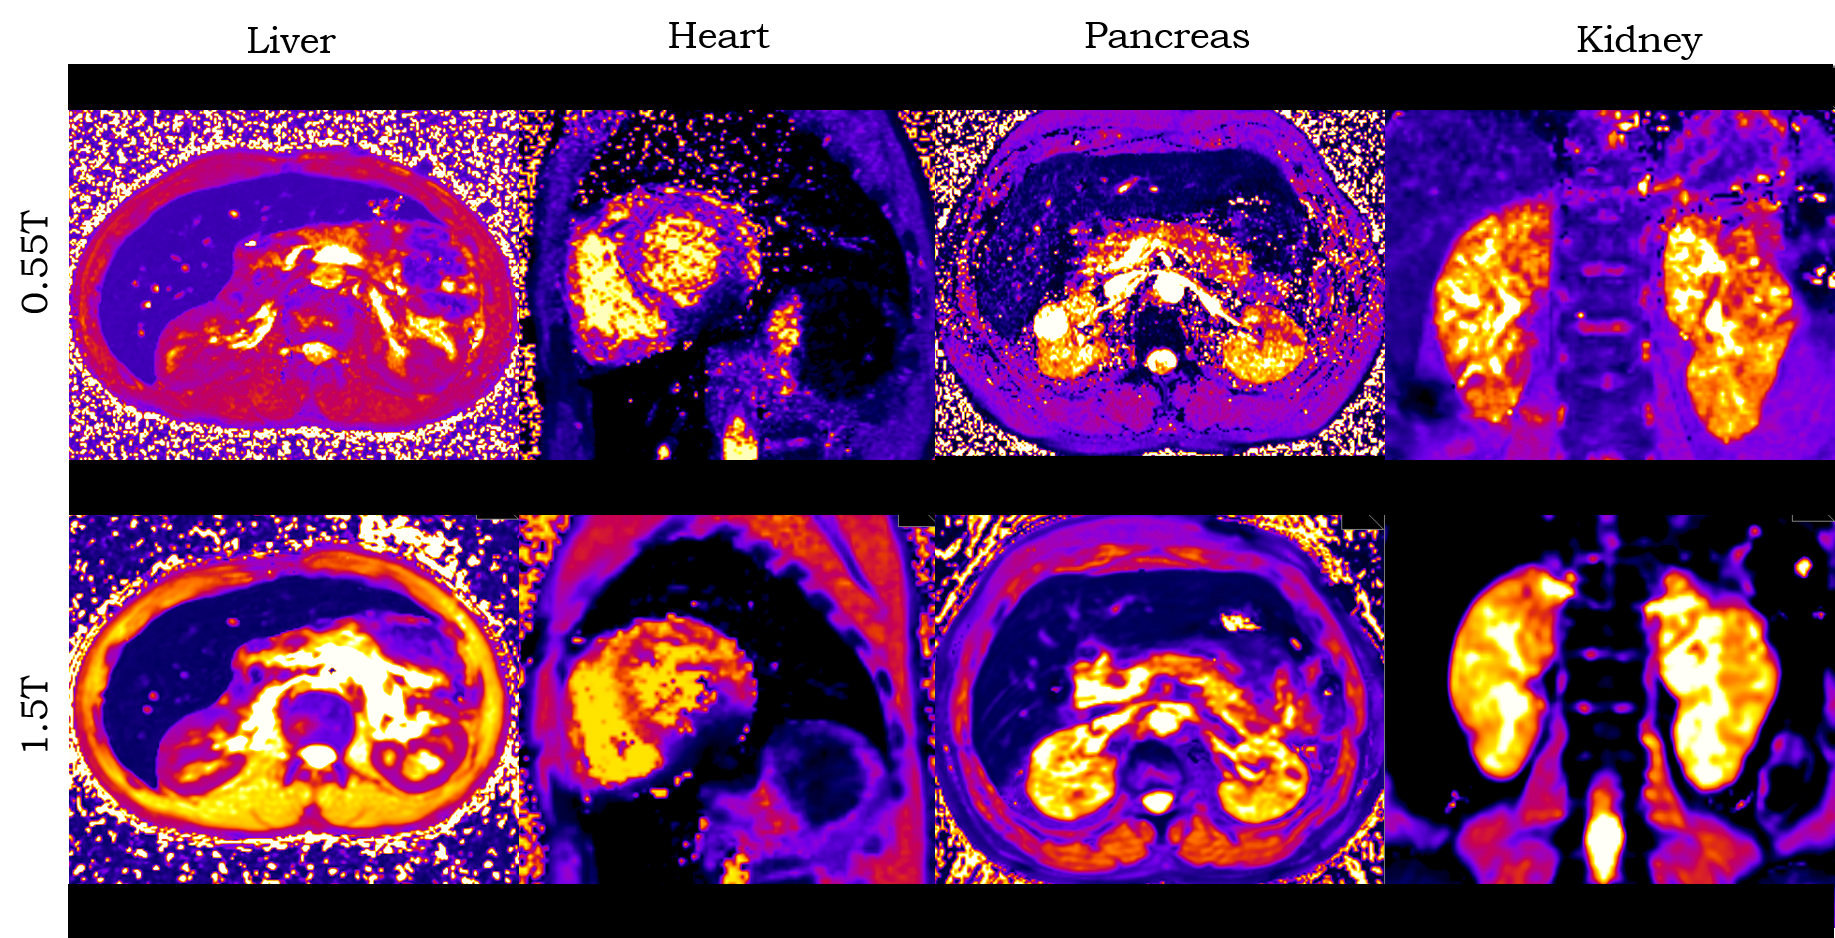
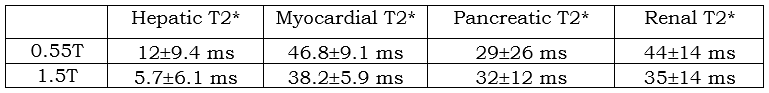
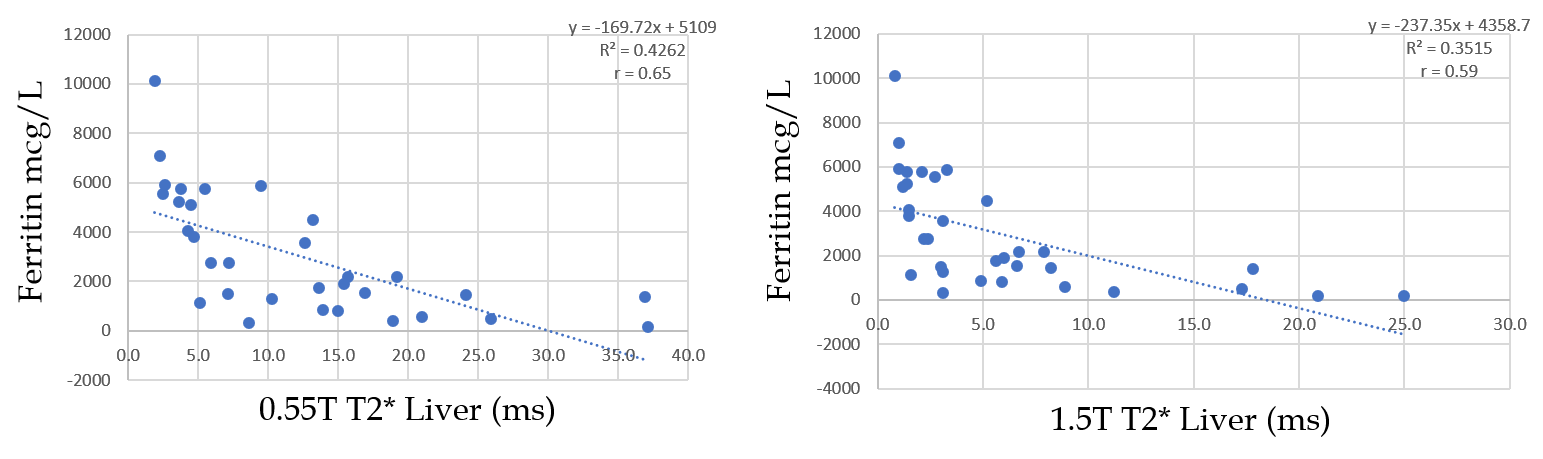
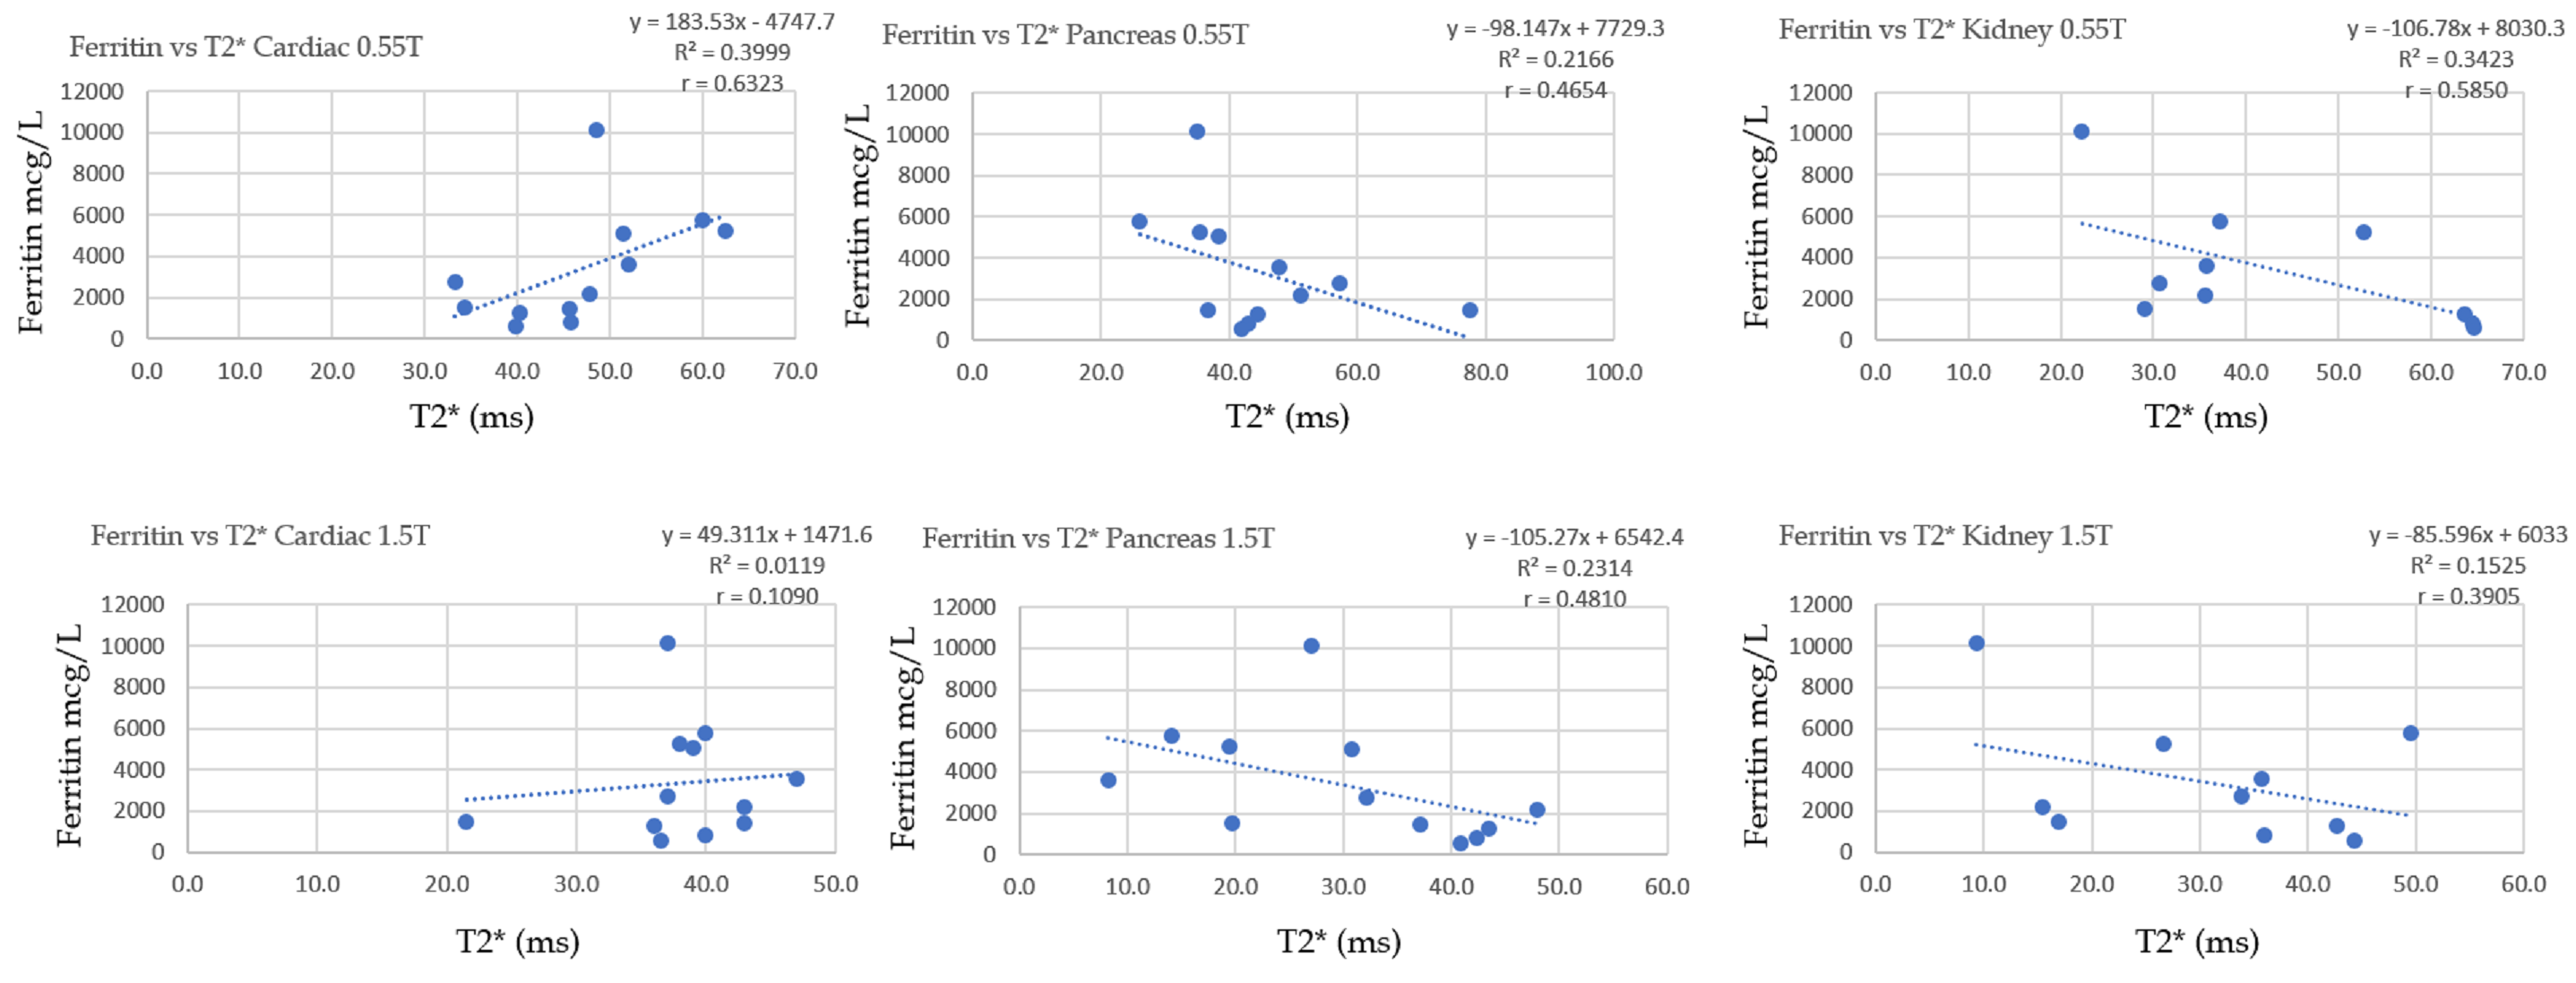
Example of cardiac and abdominal T2* maps from 0.55T and 1.5T are provided in Figure 2. Due to breathing and position differences between the two studies, comparisons of the heart, kidneys, and pancreas could be assessed on only 12 of the 34 patients. The 12 studies comprised the sub-study group that is presented here. Mean hepatic, myocardial, pancreatic and renal T2* values are reported in Figure 3 for 0.55T and 1.5T. We observed a strong correlation between 0.55T hepatic T2* and serum ferritin (Figure 4, r = 0.65). In addition, we found a modest correlation between myocardial, pancreatic and renal T2* at 0.55T and serum ferritin (Figure 5).Discussion
Evaluation of extra-hepatic organs provides an option to complement standard hepatic T2* evaluation; however, the challenge lies in the reproducible and rapid acquisition of these other organs. An inverse correlation between ferritin and cardiac T2* was observed. A larger sample size for the extra-hepatic organs may show a better correlation to the serum ferritin. One limitation of the analysis relates to the fact that volumetric coverage of the pancreas and kidneys can be difficult due to poor and inconsistent breath holds.Acknowledgements
Funding was provided from the National Heart, Lung, and Blood Institute’s Division of Intramural Research. We would like to acknowledge the assistance of Siemens Healthcare in the modification of the MRI system for operation at 0.55T under an existing cooperative research agreement (CRADA) between NHLBI and Siemens Healthcare.References
[1] Sirlin CB, Reeder SB. Magnetic Resonance Imaging Quantification of Liver Iron. Magn Reson Imaging Clin N Am. 2010 August ; 18(3): 359–ix
[2] Sandino CM, Kellman P, Arai AE, Hansen MS, Xue H. Myocardial T2* mapping: influence of noise on accuracy and precision. Journal of Cardiovascular Magnetic Resonance (2015) 17:7
[3] Chavhan GB, Babyn PS, Thomas B, Shroff MM, Haacke EM. Principles, Techniques, and Applications of T2*-based MR Imaging and Its Special Application. Radiographics. 2009 Sep; 29(5): 1433–1449.
Figures