S42
Evaluation gastrocnemius muscle in osteoarthritis of knee using T2 mapping1Radiology, Tianjin hospital, Tian Jin, China, 2Radiology, Tian jin hospital, Tian jin, China
Synopsis
Osteoarthritis is a common chronic disease affecting the joints in older population. Knee pain or stiffness along with other specific knee joint symptoms are common entities found in future sufferers of osteoarthritis. Weight bearing joints such as the knees and hips are heavily affected. T2 mapping is a quantitative MRI technique that enables the quantification of inflammatory changes. However, most existing T2 mapping techniques are also sensitive to changes in the fat content. To evaluate lateral and medial gastrocnemius muscle in asymptomatic symptomatic individuals and patients with symptoms scheduled for knee replacement using T2 mapping.
Purpose
To evaluate lateral and medial gastrocnemius muscle in asymptomatic symptomatic individuals and patients with symptoms scheduled for knee replacement using T2 mappingMethods and Materials
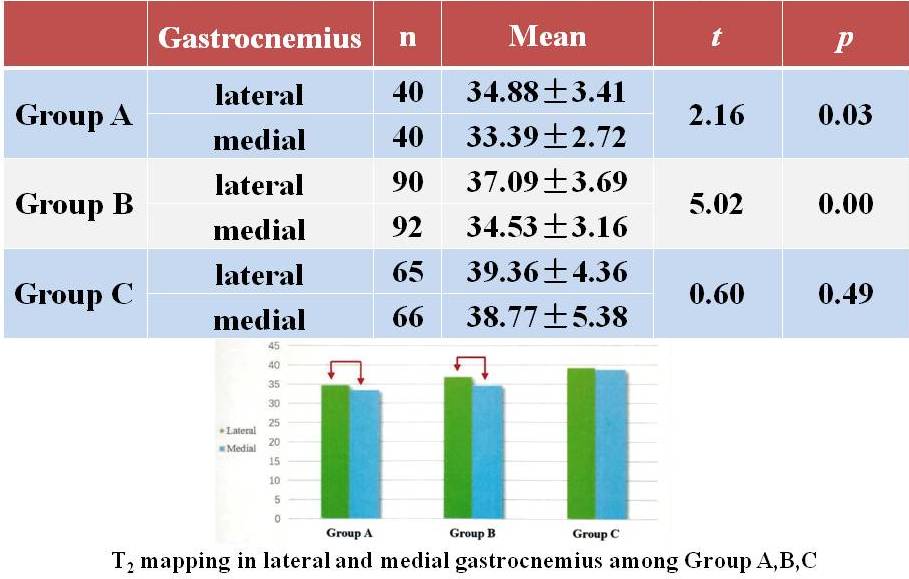
One hundred and ninety eight knees were examined for magnetic resonance imaging with T2 mapping sequence. T2 values of one-hundred and ninety five knees of lateral gastrocnemius and one-hundred and ninety eight medial gastrocnemius muscles were measured for the overall study comparison and evaluation. Three lateral gastrocnemii was unable to be measured due to minimal and/or no coloring in the muscle. The entire study subjects were then allocated to three different groups.First, Group A-"Asymptomatic" consisted of volunteers who had no knee joint symptoms such as pain or stiffness, no minor nor severe disruption of daily activities associated with the knee joint. Group A had forty volunteers with equal male and female participants. The age range found in this group was from 24-29 years with mean age of 26.93±1.47 years.
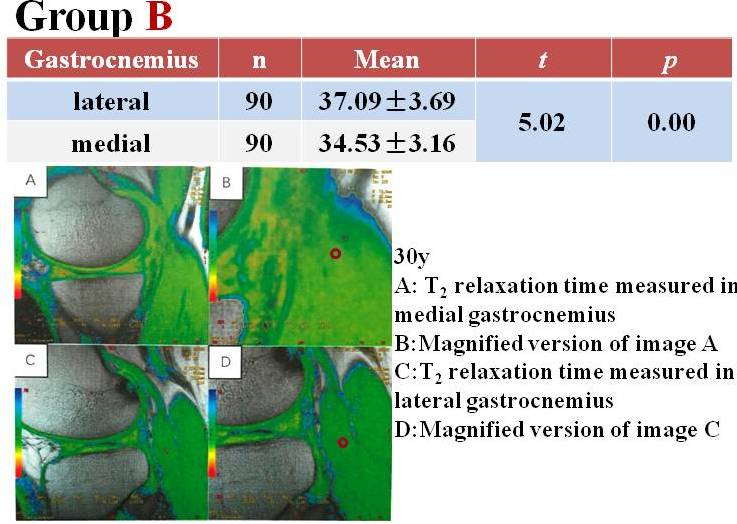
Second Group B-"Symptomatic"had participants entirely opposite to Group A,all the volunteers who complained of having had knee pain, knee stiffness. Group B was assigned with ninety-two individuals, out of which twenty-two were male and seventy female individuals with mean age of 52.84±8.25 years their ages ranging from 36-72 years.
Finally, Group C-"Knee replacement"consisted of individuals who were the patients admitted in the orthopedic department. From sixty-six participants in this group, thirteen were male and fifty were female individuals, their ages ranged from 56-72 years with a mean age of 64.38±4.21 years.
Magnetic resonance imaging of one hungred and ninety eight knees was acquired with a 3 tesla whole body scanner(GE Medical Systems Discovery MR750).T2 mapping:TR/TE=1000/8.6,17.2,25.9,34.5,43.1,51.7,60.3,68.9ms,Slice thickness=4.00mm,Interslice spacing=0mm,Slice=20,FOV=140×140mm,Frequency phase=384×384,NEX=1.00,Time=7min53sec.
Value of T2 mapping for lateral and medial gastrocnemius muscles were measured forall three groups with a cursor of 44. ROI of l mm2 was measured manually at the best possible site of the lateral and medial gastrocnemius muscle with maximum T2 color. T2 mapping settings also consisted of a Threshold at 20, Confidence 0.05 and color level from 0-65.Coloring of the muscle was always heterogeneous thus, proper visualization before measurement was key owing to the distribution of T2 within the muscle. Images where the muscle area could not appreciate T2 mapping color were omitted.
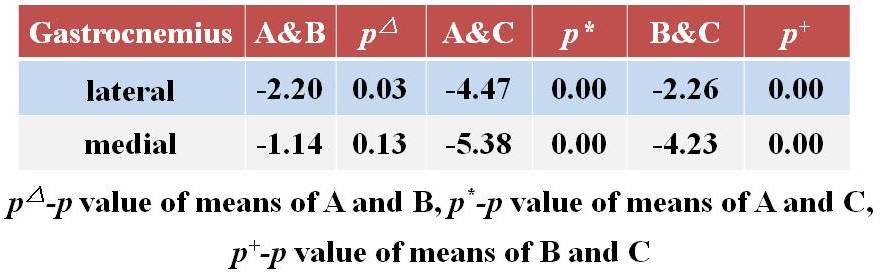
Analysis of variance (ANOVA) test was used in intergroup comparisons of categorical variables. In comparisons amongst the T2 values of Group 1(Asymptomatic),Group 2(Symptomatic) and Group 3(Pain), the lateral and medial gastrocnemius has T2 mapping values measured. P values lower than 0.05 were considered as statistically significant. Confidence interval percentage in the Independent t test was 95%. For a pairwise comparison, the side of gastrocnemius muscle (lateral or medial)was the value for rows and value of T2 mapping was generated in the columns for water,fat and area the respective muscle.
Results
T2 values of lateral and medial gastrocnemius were measured separately. The means of the values were compared and correlated within all the three groups. In lateral gastrocnemius, a vast difference in mean was seen upon comparison amongst asymptomatic, symptomatic and knee replacement. Gradual increase in mean from Group A(Asymptomatic)to Group B(Symptomatic), likewise, with severity of symptoms of the grouping, Group C was found with the highest mean and a steep increment from Group A and Group B noted.A number of factors can influence T2, including fat infiltration, inflammation and edema associated with muscle damage. The severity of the participants complaints increased from Group a to Group c, i.e participants with no knee symptoms(Group A Asymptomatic), participants with knee symptoms causing discomtoy activities but did not require surgical intervention immediately(Group B-Symptomatic) and third, participants with severe knee symptoms requiring correctional surgery since the symptoms were disrupting daily activity and functionality of the knee joint( Group C Knee Replacement). A few authors have had mentioned useful prediction of changes in T2 mapping regarding longitudinal morphologic degeneration of cartilage in the knee.
In medial gastrocnemius, the increment of the means from Group A, B to Group C was similar to the lateral gastrocnemius, however the slop amidst the three had a steeperpeak, the mean of group B was slightly higher than group A. Comparatively, Group C had the highest mean of T2 value thus making the difference range of Group A with Group C highest. (fig1234.right)
A two by two independent t-test revealed that between a comparison of Group A and B, the latter showed higher mean T2 values in lateral and medial gastrocnemius showing statistically significant difference as well, with P value less than 0.05. Likewise, between Group B and C, both lateral and medial gastrocnemius of Group C had the higher mean T2 value. Similarly Group C was still higher upon comparison with Group A with p value significance proving less than 0.05. Evident increase in the mean T2 values were seen from the severity of the symptoms of the participants.(fig5.right) Previous studies have reported increment of T2 relaxation with progression of degeneration.
Conclusions
1.T2 mapping evaluates the changes in lateral and medial gastrocnemius. Lateral gastrocnemius was seen to be more sensitive than medial gastrocnemius.2.The biochemical structures of lateral and medial gastrocnemius differ, however with occurrence of KOA the biochemical structures remain similar.
Acknowledgements
My thesis has been educative, emotional and will always hold a substantial chapter in my life. Sincerest gratitude goes to my supervisor, Professor Wan Yeda, Chief Director of the Radiology department in Tianjin Hospital. His advice, knowledge and encouragement to work from the very early stages of this research have directed me in the proper direction to accomplish commendable results.References
[1]Koster IM. Oei EH, Hensen JH, et al. Predictive factors for new onset or progressionof knee osteoarthritis one year after trauma: MRI follow-up in general practice[J].Eur J Radio,2011,21(7):1509-1516.
[2]Jawahar A, Lu Y, Okur G, et al. Gastrocnemius tendinosis- A frequent finding on MRI knee examination [J]. Eur J Radiol, 2015, 84(12): 2579-2585.
[3]Arpan I, Forbes SC, Lott DJ et al. T2 mapping provides multiple approaches for the characterization of muscle involvement in neuromuscular diseases: a cross-sectional study of lower leg muscles in 5-15-year-old boys with Duchenne muscular dystropy [J].NMR Biomed,2013,26(3):320-328.
[4]Willcocks RJ, Arpan IA, Forbes SC et al. Longitudinal measurements of MRI-T2 in boys with Duchenne muscular dystrophy: effects of age and disease progression[J].Neuromuscul Disord, 2014, 24(5): 393-401.
[5]Carlier PG, Azzabou N, Sousa PL et al. Skeletal muscle quantitative nuclear magnetic resonance imaging follow-up of adult Pompe patients[J]. J Inherit Metab Dis, 2015,38(3):565-572.
[6]Collins-Hooper H, Woolley TE, Dyson L et al. Age-related changes in speed and mechanism of adult skeletal muscle stem cell migration[J]. Stem Cells, 2012,30(6:1182-1195.
[7]Nikkuni Y, Nishiyama H, Hayashi T. Clinical significance of T2 mapping MRI for the evaluation of masseter muscle pain in patients with temporomandibular joint disorders[J].Oral Radiol,2013,29(1):50-55.
[8]Patten C, Meyer RA, Fleckenstein JL. T2 mapping of muscle[J]. Semin Musculoskelet Radiol,2003,7(4:)297-305.
[9]Abulhasan JF GreyMJ Review-Anatomy and physiology of knee stability[J].J Funct. Morphol. Kinesiol, 2017, 2(4): 34-44.
[10] Rossi C, Boss A, Happ M et al. Whole-body T2*mapping at 1.5 T.J. Magn Reson Imaging,2009,.27(4):489-490.
[11] Matzat SI. van Tieli. gold ge et al. Quantitative MRI techniques of cartilage composition[J]. Quant Imaging Med Surg, 2013, 3(3): 162-174.
[12] Fuller S. Reeder S, Shimakawa A et al. Iterative decomposition of water and fat with echo asymmetry and least-squares estimation (IDEAL) fast spin-echo imaging of the ankle: intial clinical experience[J]. AJR Am J Roentgenol, 2006, 187(6): 1442-1447.
[13] Mosher TJ. Dardzinski BJ, Smith MB. Human articular cartilage: influence of aging and early symptomatic degeneration on the spatial variation of T2-preliminary findings at 3T[J] Radiology2000:214(1):259-266.
[14]Feng S, Chen D, Kushmerick M et al. Multi-parameter MRI analysis of the time course of induced muscle damage and regeneration[J]. J Magn Reson Imaging, 2014,40(4):779-788
[15]Anz AW, Lucas EP, Fitzcharles EK, et al. MRI T2 mapping of the asymptomatic supraspinatus tendon by age and imaging plane using clinically relevant subregions[J].Eur J Radiol,2014,83(5):801-805. [16]Hatakenaka M, Ueda M, Ishigami K et al. Effects of aging on muscle T2 relaxation time: difference between fast-and slow-twitch muscles[J]. Invest Radiol, 2001,36(12):692-698.
[17] Dautry R, Bousson V, Manelfe, J et al. Correlation of MRI T2 mapping sequence with knee pain location in young patients with normal standard[J]. JBR-BTR, 2014, 97(1):11-6.
[18] Millard S M, Jones R, Owens C et al. Quantitative assessment of MRI T2 relaxation time of thigh muscles in juvenile dermatomyositis[J]. Rheumatology(Oxford), 2004,43(5):603-608.
[19] Mosher TJ, Dardzinski BJ Cartilage MRI T2 relaxation time mapping: overview and applications[J. Semin Musculoskelet Radiol, 2004, 8(4): 355-368. [20]Pan J, Pialat JB, Joseph T et al. Knee Cartilage T2 Characteristics and Evolution in Relation to Morphologic Abnormalities Detected at 3-T MR Imaging: A longitudinal study of the normal control cohort from the Osteoarthritis Initiative[J]. Radiology, 2011,261(2):507-515.
[21]Sharafi A. Chang G, Regatte RR. Bi-component Tlp and T2 relaxation mapping of skeletal muscle in-vivo. [J] Sci Rep, 2017, 7: 14115. doi: 10.1038/341598-017-14581-9.
[22]Diaz-Manera J, Llauger J, Gallardo E, et al. Muscle MRI in muscular dystrophies [J] Acta Myologia.2015,34(2-3):95-108.
[23] Raynauld JP, Martel-Pelletier J, Haraoui B, et al. Risk factors predictive of joint replacement in a 2-year multicentre clinical trial in knee osteoarthritis using MRI: results from over 6years of observation[J].Ann Rheum Dis,2011,70(8):1328-1338.
Figures