S41

The Value of IVIM in the Diagnosis of Pancreatic Carcinoma
Liu ze qun1 and Sun wen ge1
1The First Affiliated Hospital of China Medical University, Shen yang, China

Synopsis

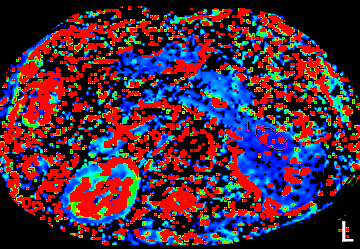
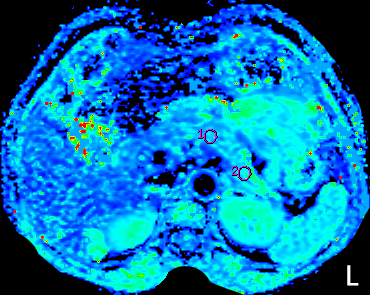
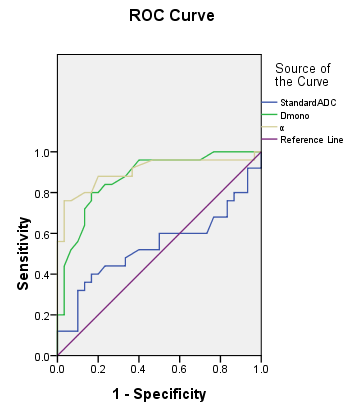
To evaluate the clinical application value of the monoexponential model of diffusion-weighted imaging(DWI), biexponential and stretched-exponential models of intravoxel incoherent motion(IVIM) in the diagnosis of pancreatic cancer.Retrospective collect and analyse 30 pancreatic carcinomas proven bu histopathology and/or clinical history.At the same time, 25 cases of normal pancreas were examined. In this study, multiple IVIM parameters have significant difference on the PC diagnosis from NP, and the diagnostic efficiency better than ADC value of DWI; the alpha value from IVIM sequence of the stretched exponential model is the best parameters in differential diagnosis of pancreatic carcinoma from normal tissue.

Materials and Methods: Retrospective collect and analyse 30 pancreatic carcinomas proven bu histopathology and/or clinical history from September 2015 to January 2017 including male 15 , female 15, age from 48~89, mean age 65.53 ±9.17 years old. At the same time, 25 cases of normal pancreas were examined(male 14 and female 11, age from 45~76,mean age 59.92± 9.55 years old).All the patients were performed MRI examination on an 3.0T scanner (GE-Signa HDXT, USA) in a protocol containing the routine T1WI, T2WI, LAVA, DWI(b=0,600s/mm2), eDWI(b=0, 20, 50, 100, 150, 200, 400, 800, 1200, 2000, 3000s/mm2) and HB DWI(b=0, 1500, 2000, 3000, 4000s/mm2). The author and one radiologist with radiologist with 5 years experience in abdominal MR imaging diagnosis observed the PC's signal, extent and vascular invasion, lymph node metastasis two observers discuss when they have different opinnion. Two observers were blinded to the results and independently measured the data using a dedicated software in Functool on GE ADW4.4 workstation. For each region of interested (ROI),they measured the mean value of ADC in DWI, Standard ADC, D-mono, D*-mono, fmono, D-Bi、D*-Bi、fBi in eDWI, and DDC , αin HB DWI) . ROI was larger than 1/3 of the whole lesion and placed in the local with homogeneous signal, trying to avoid the hemorrhage, necrosis, ROI lesions The average value of three measurements was used for the final statistical analysis. The ROIs of pancreas in NP group were drawn with the same sizes about 80~200 mm² in the head, body and tail of the pancreas, then the average value was calculated for further statistical analysis. The data of two groups of the monoexponential model、biexponential and stretched-exponential models were measured and recorded. SPSS17.0 statistical software was used to analyze the data. Chi-square test was used to analysis images features on T1WI, T2WI and DWI sequences. ICC test was used to examine the consistency of the measurements between two observers, if the data agreed with each other, the average data from two observers were calculated for further statistical analysis. If the parameters fitted normal distribution, the student’s t-test was executed to compare the obtained parametric values, otherwise Mann-Whitney U test was executed to compare the values, there was a significant difference when P<0.05. Draw the ROC curve of each parameter and analyze its diagnostic efficiencyResults: There was no difference in gender and age distribution between the two groups. There was no significant difference in the T1WI signal between the two groups (P<0.05), and there was significant difference in DWI and T2WI signal(P>0.05) .The ICC value of the DWI parameter (ADC), eDWI parameters (Standard ADC, D*-mono, D-mono, fmono, D*-Bi, D-Bi, fBi) and HB DWI(DDC, α) in the PC group and NP group were respectively, 0.983、0.994、0.992、0.980、0.923、0.999、0.998、0.994、0.977、0.992 and0.998、0.992、0.995、0.997、0.996、0.997、0.962、0.958、0.939、0.923, exhibiting an amenable consistency. The ADC, standard ADC of PC and NP were (1.58±0.26)×10-3mm²/s vs.(1.83±0.28)×10-3mm²/s、(1.13 ±0.12)×10-3mm²/s vs.(1.15±0.18)×10-3mm²/s. The D-mono, D*-mono, fmono values of HCC and HH group were (0.55±0.12)×10-3mm²/s and(0.72±0.10)×10-3mm²/s、(5.18±3.19)×10-3mm²/s and(15.07±8.49)×10-3mm²/s、(0.65±0.16)and (0.62±0.13). The D-Bi, D*-Bi , fBi values of them were(1.01±0.73)×10-3mm²/s and(1.08±0.49)×10-3mm²/s、(17.75±10.75)×10-3mm²/s and(46.23±31.03)×10-3mm²/s、(0.63±0.15)×10-3mm²/s and(0.51±0.13)×10-3mm²/s. The DDC and α values of PC and NP were (1.97±0.53)×10-3mm2/s and(3.02±1.57)×10-3mm2/s、(0.59±0.08)and(0.83±0.18),and the value of ADC、Standard ADC、D-mono、D*-mono、D*-Bi、DDC、α remained statistically significant (P<0.05). The area under the ROC curve was more than 0.9 and the AUC was 0.905 , The area under the ROC curve of ADC、D-moono、D*-mono、D*-Bi、DDC was0.725、0.873、0.899、0.773、0.767. The area under the standard ADC curve is greater than 0.5, AUC value of 0.536. ROC of alpha was the largest, the threshold was 0.72, sensitivity was 0.76, specificity was 0.967.

Acknowledgements

I would like to sincerely thank my leader, Professor Sun Wenge, for his strict requirements and careful guidance. This study was completed under the careful guidance of Mr. Sun.I sincerely thank the warm group of radiology department for their great support and help in my study and work, and help me successfully complete the project research.I also want to thank my family, who have been supporting me silently behind me, for their meticulous care for me over the years

References

[1]Balci N C,Semelka R C,Radiologic dianosis and staging of pancreatic ductal adenocarcinoma of pancreatic ductal adenocarcinoma[J].Eur J Radiol,2001,38(2):105-112.

[2]D'Onofrio M, Gallotti A, Mantovani W, et al. Perfusion CT can predict tumoral grading of pancreatic adenocarcinoma[J]. European Journal of Radiology, 2013, 82(2): 227-233.

[3]王婧,赵磊,车娟娟,等.ACE、ACE/ACE2对胰腺癌的临床诊断价值初探[J].临床与病理学杂志,2016,36(4):47-411.

[4]李学彦,郭晓钟,李宏宇等.肿瘤标志物检测在胰腺癌诊断和预后评估中的价值研究[J].中国实用内科杂志,2014,5,34(5):499-503.

[5]Shinmura R,Matsui O,Kobayashi S,Terayama N,Sanada J,Ueda K,Gabata T,Kadoya M,Miyayama S. Cirrhotic Nodules: Association between MR Imaging Signal Intensity and Intranodular Blood Supply[J].Radiology, 2005, 237(2):512~9.

[6]Andreas Lemke, MS,* Frederik B. Laun, et al.Differentiation of Pancreas Carcinoma From Healthy Pancreatic Tissue Using Multiple b-Values[J].Investigative Radiology,2009,12,44(12):769-775.

[7]Bennett KM,Hyde JS,Schmainda KM.Water diffusion heterogeneity index in the human brain is insensitive to the orientation of applied magnetic field gradients[J]. Magn Reson Med, 2006, 56(2): 235~239.

[8]R. Wirestam, M. Borg, S. Brockstedt, A. Lindgren, S. Holtås, F. Ståhlberg, Perfusion-related parameters in intravoxel incoherent motion MR imaging compared with CBV and CBF measured by dynamic[J]. Acta Radiol, 2001(42), 123~128.

[9]Kang KM, Lee JM, Yoon JH, Kiefer B, Han JK, Choi BI. Intravoxel incoherent motion diffusion-weighted MR imaging for characterization of focal pancreatic lesions[J].Radiology, 2014, 270(2):444–453.

Figures

α diagram of pancreatic cancer

α diagram of normal pancreas

ROC of pancreatic cancer

ROC of normal pancreas

Proc. Intl. Soc. Mag. Reson. Med. 28 (2020)
S41