S21
Texture analysis of DCE-MRI for glioma grading
zhao pengfei1, gao yang2, and qiao pengfei2
1Department of MRI, Affiliated Hospital of Inner Mongolia Medical University, Hohhot, China, 2Department of MRI, Affiliated Hospital of Inner Mongolia Medical University, Huhhot, China
1Department of MRI, Affiliated Hospital of Inner Mongolia Medical University, Hohhot, China, 2Department of MRI, Affiliated Hospital of Inner Mongolia Medical University, Huhhot, China
Synopsis
The present study investigated the application of texture analysis of DCE-MRI in different ROIs in glioma grading. 50 with HGG (WHO grade III–IV) and 50 with LGG (WHO grade I–II) were included. All tumors were confirmed by pathology, and patients underwent DCE-MRI. The quantitative parameter of inhomogeneity was determined for two ROIs: whole tumor and solid portion. For both whole tumor ROI, heterogeneity was significantly different between HGG and LGG (P = 0.01). For the solid portion ROI, inhomogeneity was not significantly different between HGG and LGG (P = 0.07). Whole tumor inhomogeneity demonstrated higher diagnostic accuracy.
Background
Gliomas are the most common primary brain tumors. They are stratified into low-grade gliomas (LGG, classified as World Health Organization [WHO] grade I–II) and high-grade gliomas (HGG, classified as WHO grade III–IV)。Tumor grading is important for making treatment decisions and predicting prognosis. HGG is treated by radical resection followed by adjuvant radiotherapy and/or chemotherapy, while LGG grows very slowly and can be radically resected with a good prognosis. The main difference between conventional enhanced MRI and DCE-MRI is the number of images acquired after contrast injection. In conventional MRI, only one set of images is obtained a few minutes after gadolinium contrast injection. In DCE-MRI, continuous dynamic imaging provides multiple images that can be used to calculate a signal intensity curve at different points before and after contrast injection. This DCE kinetic curve reveals the transport of gadolinium contrast to the lesion, as well as its distribution and clearance. Texture analysis is a method of quantifying the spatial distribution of image intensity. It has the potential to be widely used for tumor diagnosis, tumor heterogeneity quantification, separation of tumor from surrounding tissues, tumor grading and classification, and prediction of treatment response and survival. The present study investigated the application of texture analysis of dynamic contrast-enhanced magnetic resonance imaging (DCE-MRI) in different regions of interest (ROIs) in glioma grading.Methods
Fifty patients with high-grade glioma (HGG, World Health Organization [WHO] grade III–IV) and 50 with low-grade glioma (LGG; WHO grade I–II) were included. All scans were performed on a clinical 3T MR system (MAGNETOM Skyra, Siemens AG). A DCE T1-weighted 3D gradient echo sequence was used for volumetric interpolated breath-hold examinations. Prior to the DCE scan, sequential scanning was performed at two different flip angles (2° and 15°) to generate T1 maps during post-processing. Gd-DTPA (GE Healthcare) was injected via an elbow vein trocar (20 G) using a power injector (Medrad, Spectris Solaris EP, USA) at a dose of 0.2 mmol/kg and a rate of 2.5 ml/s. The connecting tube was rinsed at the same flow rate with 20 ml of normal saline immediately after injection. Multi-phase transverse DCE-MRI began when the contrast injection was started. MRI data were transferred to a personal computer. All ROIs in the solid portion and whole tumor were drawn by the same investigator under the guidance of an experienced neuroimaging technologist. To assess image texture features in ROIs, GE Analysis Kit Version V3.0.1A software was used to quantify heterogeneous signals. Histogram analysis was used to calculate first-order parameters. A gray level co-occurrence matrix (GLCM) was applied to extract second-order statistical texture features. Texture analysis was performed in 3D ROIs. Parameter inhomogeneity was used for quantitative analysis. Kurtosis and inhomogeneity were compared between HGG and LGG using a nonparametric Wilcoxon rank sum tests.Results
For both whole tumor ROI, heterogeneity was significantly different between HGG and LGG (Z = 52.11, P = 0.01 < 0.05). For the solid portion ROI, inhomogeneity was not significantly different between HGG and LGG (Z = 35.54, P = 0.07). Among the two parameters, whole tumor inhomogeneity demonstrated higher diagnostic accuracy (Tables 1 and 2). Table 3 and Figure 1 summarizes the ROC analysis results for different ROI inhomogeneities used to discriminate HGG from LGG.Conclusions
This study demonstrates that texture analysis of DCE-MRI in different ROIs can provide important parameters for evaluating tumor heterogeneity, which is correlated with tumor grade. Inhomogeneity in the whole tumor ROI is particularly effective for discriminating HGG from LGG.Acknowledgements
No acknowledgement found.References
1. Skogen K, Ganeshan B, Good C, Critchley G, Miles K. Measurements of heterogeneity in gliomas on computed tomography relationship to tumour grade. J Neurooncol 2013; 111: 213-9.2. Louis DN, Ohgaki H, Wiestler OD, et al. The 2007 WHO classification of tumours of the central nervous system. Acta Neuropathologica 2007; 114: 97-109. 3. Weller M. Novel diagnostic and therapeutic approaches to malignant glioma. Swiss Med Wkly 2011; 141: w13210.4. Server A, Kulle B, Gadmar ØB, Josefsen R, Kumar T, Nakstad PH. Measurements of diagnostic examination performance using quantitative apparent diffusion coefficient and proton MR spectroscopic imaging in the preoperative evaluation of tumor grade in cerebral gliomas. Eur J Radiol 2011; 80: 462-70.5. QIAO PF, NIU GM. The value of dynamic contrast-enhanced magnetic resonance imaging in the staging of brucellosis spondylitis. Chin J Magn Reson Imaging 2017; 8: 908-911. 6. Lang N, Su MY, Yu HJ, et al. Differentiation of myeloma and metastatic cancer in the spine using dynamic contrast enhanced MRI. Magn Reson Imaging 2013, 31: 1285–1291.7. Hillengass J, Zechmann C, Bauerle T, et al. Dynamic contrast-enhanced magnetic resonance imaging identifies a subgroup of patients with asymptomatic monoclonal plasma cell disease and pathologic microcirculation. Clin Cancer Res 2009; 15: 3118–3125.8. ZHAO PF, GAO Y, QIAO PF, et al. The value of dynamic contrast-enhanced MRI in the differentiation of brucellosis spondylitis, tuberculous spondylitis and spinal metastatic tumors 2017; 51: 197-201. 9. Chawla S, Kim S, Dougherty L, et al. Pretreatment diffusion-weighted and dynamic contrast-enhanced MRI for prediction of local treatment response in squamous cell carcinomas of the head and neck. AJR Am J Roentgenol 2013; 200: 35-43.10. Wang X, Zhang Z,Chen X, et al.Value of magnetic resonance imaging including dynamic contrast-enhanced magnetic resonance imaging in differentiation between inverted papilloma and malignant tumors in the nasal cavity. Chin Med J (Engl) 2014; 127: 1696-1701.11. Lang N, Su MY, Yu HJ, et al. Differentiation of myeloma and metastatic cancer in the spine using dynamic contrast enhanced MRI. Magn Reson Imaging 2013; 31: 1285-1291.12. Assefa D, Keller H, Ménard C, et al. Texture features for response monitoring of glioblastoma multiforme on T1-weighted and T2-FLAIR MR images: A preliminary investigation in terms of identification and segmentation. Med Phys 2010; 37: 1722-1736.13. Nilsson J, Holgersson G, Carlsson T, et al. Incidence trends in high-grade primary brain tumors in males and females. Oncol Lett 2017; 13: 2831-2837.14. Kang H, Lee HY, Lee KS, et al. Imaging-based tumor treatment response evaluation: Review of conventional, new and emerging concepts. Korean J Radiol 2012; 13: 371-390.15. Park BE, Jang WS, Yoo SK. Texture analysis of supraspinatus ultrasound image for computer aided diagnostic system. Healthcare Inform Res 2016; 22: 299–304. 16. Liu L, Liu Y, Xu L, et al. Application of texture analysis based on apparent diffusion coefficient maps in discriminating different stages of rectal cancer. J Magn Reson Imaging 2017; 45: 1798–1808. 17. Raja R, Sinha N, Saini J, et al. Assessment of tissue heterogeneity using diffusion tensor and diffusion kurtosis imaging for grading gliomas. Neuroradiology 2016; 58: 1217-1231.18. Kang Y, Choi SH, Kim YJ, et al. Gliomas: Histogram analysis of apparent diffusion coefficient maps with standard- or high-b-value diffusion-weighted MR imaging-correlation with tumor grade. Radiology 2011; 261: 882-890.19. Skogen K, Schulz A, Dormagen JB, et al. Diagnostic performance of texture analysis on MRI in grading cerebral gliomas. Eur J Radiol 2016; 85: 824-829.20. Davnall F, Yip CS, Ljungqvist G, et al. Assessment of tumor heterogeneity: An emerging imaging tool for clinical practice? Insights Imaging 2012; 3: 573-589.Figures
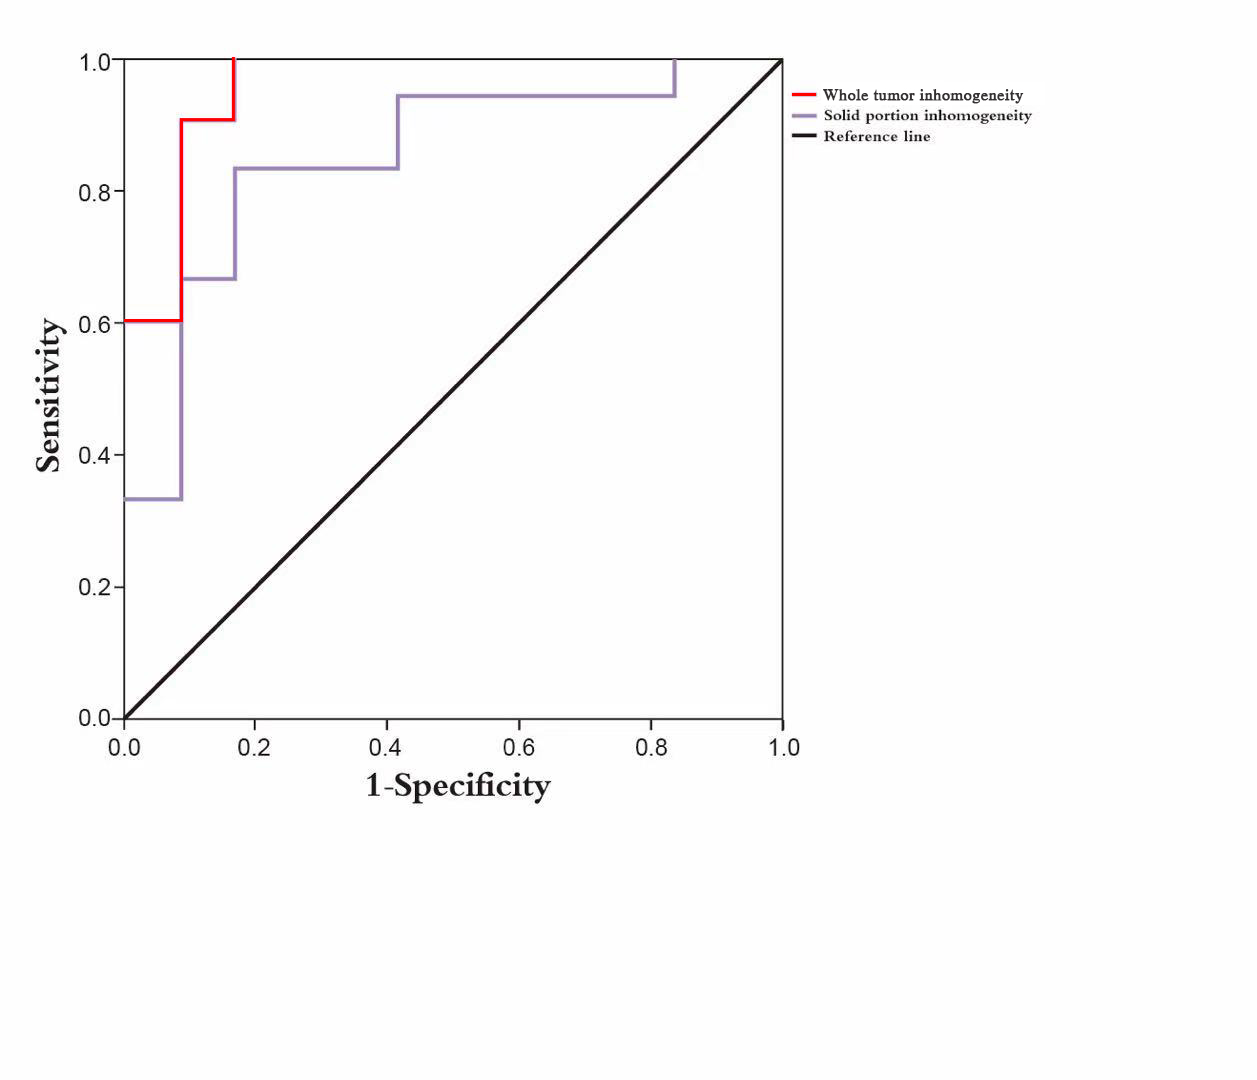
Figure
1 ROC curves for inhomogeneity for glioma grading
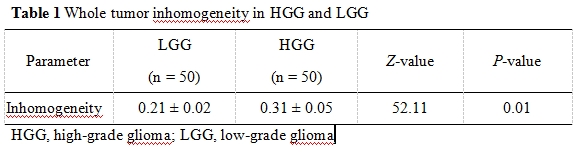
Table 1
Whole tumor inhomogeneity in HGG and LGG
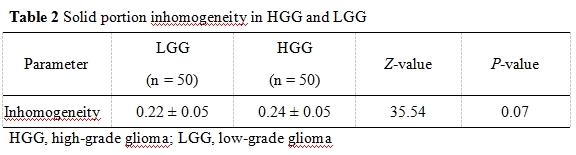
Table 2 Solid portion inhomogeneity in HGG and LGG