Introduction fMRI: Origin of the BOLD Signal
1University of Nottingham, United Kingdom
Synopsis
BOLD fMRI is a popular tool for studying brain function due to its non-invasive nature and the ability to provide high spatial resolution across the brain. However, the BOLD contrast is not a direct measure of neuronal activity and can also be used to interrogate vascular properties of the brain. Here we will explore the physical and physiological mechanisms which generate the BOLD signal. With this knowledge we will briefly explore how a given BOLD signal could have been generated in many different ways; and methods to disentangle this information; highlighting the opportunities and challenges BOLD contrast offers.
Target Audience
Those wishing to understand the underlying physiology and the basic physics which generate the BOLD contrast and how it may be possible to use these complex physiological origins to our benefit in understanding brain function and health.Purpose
BOLD fMRI has become a popular tool for studying brain function due to its non-invasive nature and the ability to study most regions of the brain with a high spatial resolution. However, the BOLD contrast is not a direct measure of neuronal activity and in some instances is used to interrogate vascular properties of the brain. Therefore here we will explore the physical and physiological mechanisms which generate the BOLD signal. With this knowledge we will briefly explore how a given BOLD signal could have been generated in many different ways; and methods to disentangle this information. As such we will highlight the opportunities and challenges the BOLD contrast offers.Blood Oxygenation Level Dependent (BOLD) contrast
The BOLD contrast used in fMRI arises from the difference in magnetic properties of oxy-haemoglobin (which is diamagnetic) and deoxy-haemoglobin (which is paramagnetic). Haemoglobin is present in red blood cells and is the primary way in which oxygen is transported around the body to the tissue. A high concentration of deoxy-haemoglobin in a blood vessel produces a magnetic field which penetrates the extravascular tissue. The local field inhomogeneity generated by deoxy-haemoglobin results in a shortening of T2* and therefore a reduced MRI signal compared with when oxy-haemoglobin is present.It has been shown through simulation that the T2* of tissue perfused by randomly orientated capillaries is dependent on the blood volume and the concentration of deoxy-haemoglobin in the blood [1]. A more recent model [2] reflects the true orientation of the microvasculature, showing the same general dependence of T2* as previously but also that the orientation of the cortex relative to the static magnetic field affects the measured MRI signal. It is generally assumed that arterial blood is highly oxygenated and therefore the amount of deoxy-haemoglobin in arterial blood is close to zero. Oxygen exchange to the tissue, for the metabolic purpose of ATP generation, occurs at the capillaries, therefore the concentration of deoxy-haemoglobin gradually increases as the blood passes through the capillary bed with the venous blood having the highest concentration of deoxy-haemoglobin [3].
The MRI signal changes due to the BOLD contrast occur due to changes in the ratio of oxy- to deoxy-haemoglobin. In functional imaging we are interested in how the MRI signal changes due to the BOLD contrast over time and then relating these changes to changes in underlying function. The change in BOLD signal over time is related to the interplay between the change in: i) oxygen metabolism of the tissue, ii) blood flow and iii) blood volume.
The link between the BOLD signal and neuronal activity is generally driven by the fact an increase in neuronal activity results in an increase in cerebral metabolic rate of oxygen consumption (CMRO2, required to supply energy to the neurons). This increase in oxygen demand is accompanied by an increase in cerebral blood flow (CBF) and volume (CBV). The increase in CBF is 2-4 times greater than the increase in CMRO2 [4]. As a result upon neuronal activation there is a relative increase in venous oxy-haemoglobin and an increase in MRI signal. This is the general premise of neurovascular coupling and results in a positive BOLD signal, i.e. an increase in the MRI signal above baseline.
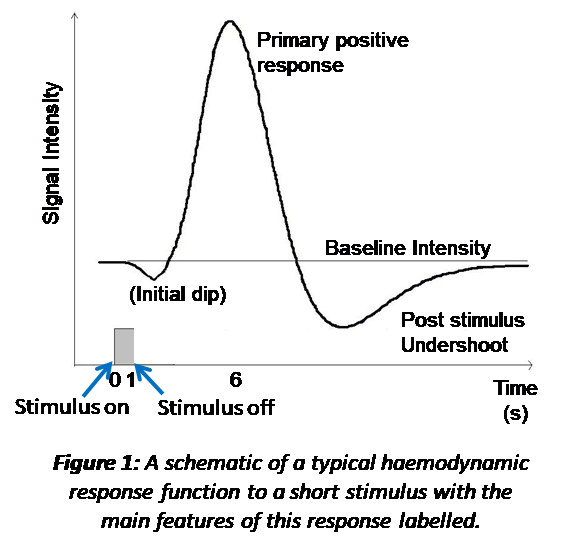
The sluggish response of the vasculature to the change in neuronal activity is characterised by the heamodynamic response function (HRF). The HRF has been derived from studying the response to brief sensory stimuli, Figure 1. A single HRF is typically used in modelling the expected BOLD response to a stimulus, such as the 2 gamma functions commonly employed in analysis packages (e.g. https://www.fil.ion.ucl.ac.uk/spm/ and https://fsl.fmrib.ox.ac.uk/fsl/fslwiki). However, this is an over simplification of the true HRF as different brain regions will have different vascular architecture and reactivity [5] as well as potentially different neuronal activity to the same stimulus [6-8]. All of which affect the shape of the HRF. In addition BOLD response non-linearities with stimulus duration are also known to pertain [8]. As a result, the oversimplification in analysis packages may lead to spurious negative findings due to imperfect modelling [7].
Therefore, when using BOLD fMRI to understand brain function it is important to remember the complex origins of the BOLD response and the possibility the BOLD response amplitude and/or shape could be generated by more than one mechanism. We will finally explore a few examples of this. The first is the post-stimulus undershoot (Figure 1) occurring at stimulus cessation. This response was originally thought to be due to poor vascular compliance (the balloon model) [9]. However, in recent years with improved MRI (higher field strengths and faster acquisitions) this initial theory has been questioned and it is possible this post-stimulus response, at least in part, reflects another phase of neuronal activity [10-13]. The second is a negative BOLD response (i.e. a decrease in the BOLD signal relative to baseline), which was originally thought to be due to a blood steal effect [14] but now is thought to be related to underlying neuronal activity [15-17], with the precise driving mechanisms still being explored. Finally, we will review some examples of physiological (non-neuronal) and neuronal changes which may drive unexpected changes in the BOLD signal between stimuli/groups/conditions [18, 19].
Acknowledgements
No acknowledgement found.References
1. Yablonskiy, D.A. and E.M. Haacke, Theory of NMR signal behavior in magnetically inhomogeneous tissues: the static dephasing regime. Magn Reson Med, 1994. 32(6): p. 749-63.
2. Gagnon, L., et al., Quantifying the microvascular origin of BOLD-fMRI from first principles with two-photon microscopy and an oxygen-sensitive nanoprobe. J Neurosci, 2015. 35(8): p. 3663-75.
3. Ogawa, S., et al., Brain magnetic resonance imaging with contrast dependent on blood oxygenation. Proc Natl Acad Sci U S A, 1990. 87(24): p. 9868-72.
4. Buxton, R.B., Interpreting oxygenation-based neuroimaging signals: the importance and the challenge of understanding brain oxygen metabolism. Front Neuroenergetics, 2010. 2: p. 8.
5. Bright, M.G., et al., Multiparametric measurement of cerebral physiology using calibrated fMRI. Neuroimage, 2019. 187: p. 128-144.
6. Gonzalez-Castillo, J., et al., Whole-brain, time-locked activation with simple tasks revealed using massive averaging and model-free analysis. Proc Natl Acad Sci U S A, 2012. 109(14): p. 5487-92.
7. Handwerker, D.A., J.M. Ollinger, and M. D'Esposito, Variation of BOLD hemodynamic responses across subjects and brain regions and their effects on statistical analyses. Neuroimage, 2004. 21(4): p. 1639-51.
8. Lewis, L.D., et al., Stimulus-dependent hemodynamic response timing across the human subcortical-cortical visual pathway identified through high spatiotemporal resolution 7T fMRI. Neuroimage, 2018. 181: p. 279-291.
9. Buxton, R.B., E.C. Wong, and L.R. Frank, Dynamics of blood flow and oxygenation changes during brain activation: the balloon model. Magn Reson Med, 1998. 39(6): p. 855-64.
10. Lu, H., et al., Sustained poststimulus elevation in cerebral oxygen utilization after vascular recovery. J Cereb Blood Flow Metab, 2004. 24(7): p. 764-70.
11. Mullinger, K.J., et al., Poststimulus undershoots in cerebral blood flow and BOLD fMRI responses are modulated by poststimulus neuronal activity. Proc Natl Acad Sci U S A, 2013. 110(33): p. 13636-41.
12. Sadaghiani, S., K. Ugurbil, and K. Uludag, Neural activity-induced modulation of BOLD poststimulus undershoot independent of the positive signal. Magn Reson Imaging, 2009. 27(8): p. 1030-8.
13. van Zijl, P.C., J. Hua, and H. Lu, The BOLD post-stimulus undershoot, one of the most debated issues in fMRI. Neuroimage, 2012. 62(2): p. 1092-102.
14. Wade, A.R., The negative BOLD signal unmasked. Neuron, 2002. 36(6): p. 993-5.
15. Boillat, Y., et al., Metabolite concentration changes associated with positive and negative BOLD responses in the human visual cortex: A functional MRS study at 7 Tesla. J Cereb Blood Flow Metab, 2019: p. 271678X19831022.
16. Huber, L., et al., Investigation of the neurovascular coupling in positive and negative BOLD responses in human brain at 7 T. Neuroimage, 2014. 97: p. 349-62.
17. Wilson, R., et al., The relationship between negative BOLD responses and ERS and ERD of alpha/beta oscillations in visual and motor cortex. Neuroimage, 2019. 199: p. 635-650.
18. Butler, R., et al., Decorrelated Input Dissociates Narrow Band gamma Power and BOLD in Human Visual Cortex. J Neurosci, 2017. 37(22): p. 5408-5418.
19. Buxton, R.B., et al., Variability of the coupling of blood flow and oxygen metabolism responses in the brain: a problem for interpreting BOLD studies but potentially a new window on the underlying neural activity. Front Neurosci, 2014. 8: p. 139.
Figures