MRS: A Diffusion Cocktail
1Nuffield Department of Clinical Neurosciences, University of Oxford, United Kingdom
Synopsis
This course aims at introducing diffusion-weighted magnetic resonance spectroscopy (DW MRS) to people with a basic understanding of diffusion MRI. Hopefully, you will be able to seize whether DW MRS techniques can be useful for your research question, and to get an idea of its implementation, from acquisition to analysis.
Take-home
- Grasping the potential of DW-MRS for your research question.- Including DW-MRS in your study: practical considerations.
- References and resources for setting up.
Resonate at various frequencies and gain specificity!
Diffusion-weighted MRI techniques, based on water diffusion, are very potent and sensitive to microstructure. However, water ubiquity can be sometimes a source of confusion. Disentangling intracellular, extracellular, neuronal, glial contributions from the diffusion signal in the brain can be tricky when modelling the microstructure.Diffusion-weighted magnetic resonance spectroscopy (DW-MRS) relies on the diffusion properties of concentrated metabolites. The most reported are N-Acetylaspartate (NAA), choline compounds (tCho) and creatine/phosphocreatine (tCr). Other J-coupled or less concentrated metabolites, such as glutamate (Glu), myo-inositol (Ins), taurine (Tau), lactate (Lac), glutamine (Gln) etc are exploitable when the spectral resolution and the sensitivity keep up. Coming from the cellular metabolism, these molecules are mostly intracellular and some of them are even more specific to neurons (typically NAA) or astrocytes (typically Ins) (Fig.1). Therefore, their diffusion properties directly reflect specific cell morphology and other cell properties! Then, why aren’t we all diffusion spectroscopists? There is no magic tool: the more concentrated metabolites are about 10-4 less concentrated than water in the brain, and therefore the lack of sensitivity is a major limitation (for now) when the regions of interest are small.
Nonetheless, various DW-MRS methods have been successfully implemented in clinical and preclinical systems. Exploring a large range of diffusion times (0.4 ms with OGSE to 2000 ms with PGSTE1,2) or harnessing high diffusion weightings (b=60 μm2/ms)3, with simple or double diffusion encoding4, these methods (Fig.2) explore a broad range of questions. From the quest of biomarkers in pathologies (notably being sensitive to astrocytic or glial activation5,6, with typical cell morphology evaluated by modeling, as in Fig.3) to biophysics queries (cytosolic viscosity, intracellular microscopic anisotropy, metabolite compartmentation), DW-MRS is ripe for the picking.
Methods: the case of upfield 1H DW-MRS in the brain [7]
The single voxel approachThe low metabolites concentration and the signal loss inherent to diffusion methods impose a relatively large single voxel in most studies. In rodents, typical voxel sizes encompass a full structure (e.g. the whole striatum, hippocampus etc), particularly when the studies take advantage of the strong gradient systems of preclinical systems. In humans at high fields, voxels can reach few cm3 [2]. A pure temporal FID is acquired from the top of the echo (no k-space sampling).
A few words on metabolites properties
Relaxation8
Metabolites have longer transversal relaxation times than water (typically 100-300ms at 11.7T). When a localization sequence is coupled to diffusion gradients, echo times can be quite long, particularly on clinical settings (100-150ms): some signal remains thanks to their relatively long T2. Longitudinal relaxation times are about 1.5s with extremes for the tCr peak at 4ppm (1s) and for Taurine (>2s). Macromolecules are another important contributor to spectra, particularly at short TE (T2,MM ~ 20-30ms)
Diffusivity3,9
Metabolites diffusivity is about an order of magnitude lower than water diffusivity. The apparent diffusion coefficient of metabolites in brain tissue for intermediary diffusion times is about 0.1-0.2 μm2/ms. Macromolecules have a very low diffusivity (~0.01 μm2/ms).
Processing the data
The result of an acquisition is a very crowded 1D-spectrum (FT of the acquired FID). Not only metabolites and macromolecules are overlapping, but the spectrum appearance depends strongly on the sequence, and therefore tools for robust quantification are recommended (LCModel, jMRUI, TARQUIN among others). The basis set of metabolites used for fitting should be quantum mechanically simulated. Empiric macromolecular baseline should be included in the basis set. Before quantification, it is crucial to correct the phase and frequency of each repetition in order to coherently add the signal and avoid an artificial signal loss10, particularly at higher diffusion-weightings.
Modeling the data
The diffusion data from different metabolites can be primarily modeled with infinite cylinders models, as it has been shown that metabolite diffusion primarily occurs in long fibers11. At long diffusion times, the cell complexity (size, embranchments) induces an ADC time dependence reflected by a morphometric modeling2,6.
Beware of motion artifacts
Motion during acquisition: on preclinical systems, the minimum care consists in an efficient holding system: bit and ear bars make a big difference. Without them, an increase of metabolite ADC of 50-100% can be easily observed (when the signal is still quantifiable).
Acknowledgements
No acknowledgement found.References
[1] Ligneul et al., ISMRM 2017
[2] Palombo et al., 2016, 10.1073/pnas.1504327113
[3] Ligneul et al., 2017, DOI 10.1002/mrm.26217
[4] Shemesh et al., 2014, DOI 10.1038/ncomms5958
[5] Ercan et al., 2015, DOI 10.1093/brain/aww031
[6] Ligneul et al, 2019, DOI 0.1016/j.neuroimage.2019.02.046
[7] Ronen et Valette, 2015, DOI 10.1002/9780470034590.emrstm1471
[8] De Graaf et al., 2006, DOI 10.1002/mrm.20946
[9] Pfeuffer et al., 2000, DOI 10.1097/00004647-200004000-00011
[10] Upadhyay et al. 2007, DOI 10.1002/mrm.21372
[11] Najac et al. 2016, https://doi.org/10.1007/s00429-014-0968-5
Figures
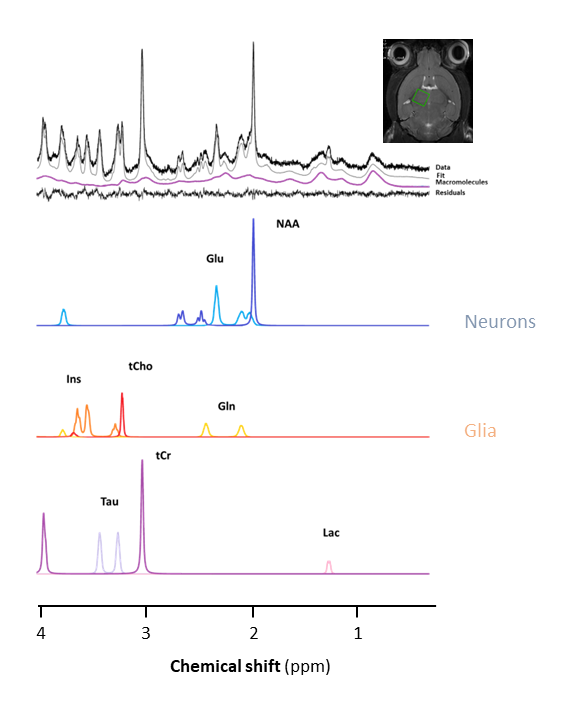
Figure 1
1H spectrum acquired in the thalamus of a mouse at 11.7 T with a cryoprobe. A LASER sequence (TE/TR=20/5000ms, 128 repetitions) was used for localisation and VAPOR was used for water suppression. The LCModel fit and decomposition for some metabolites are shown.
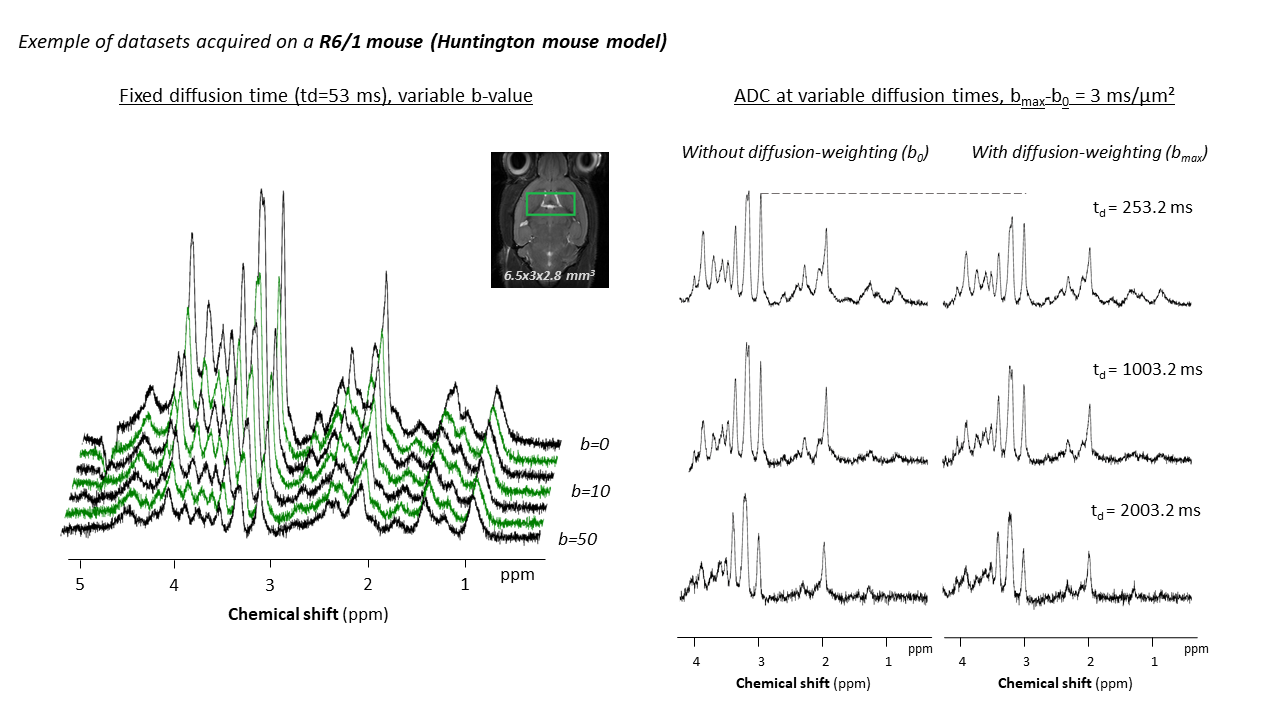
Figure 2
Representative datasets acquired at variable b-values (up to b=50 ms/μm²), or at variable diffusion times (up to td=2003 ms) in the striatum of a R6/1 mouse. Spectra were all acquired with a STELASER3 at 11.7 T, with a cryoprobe.
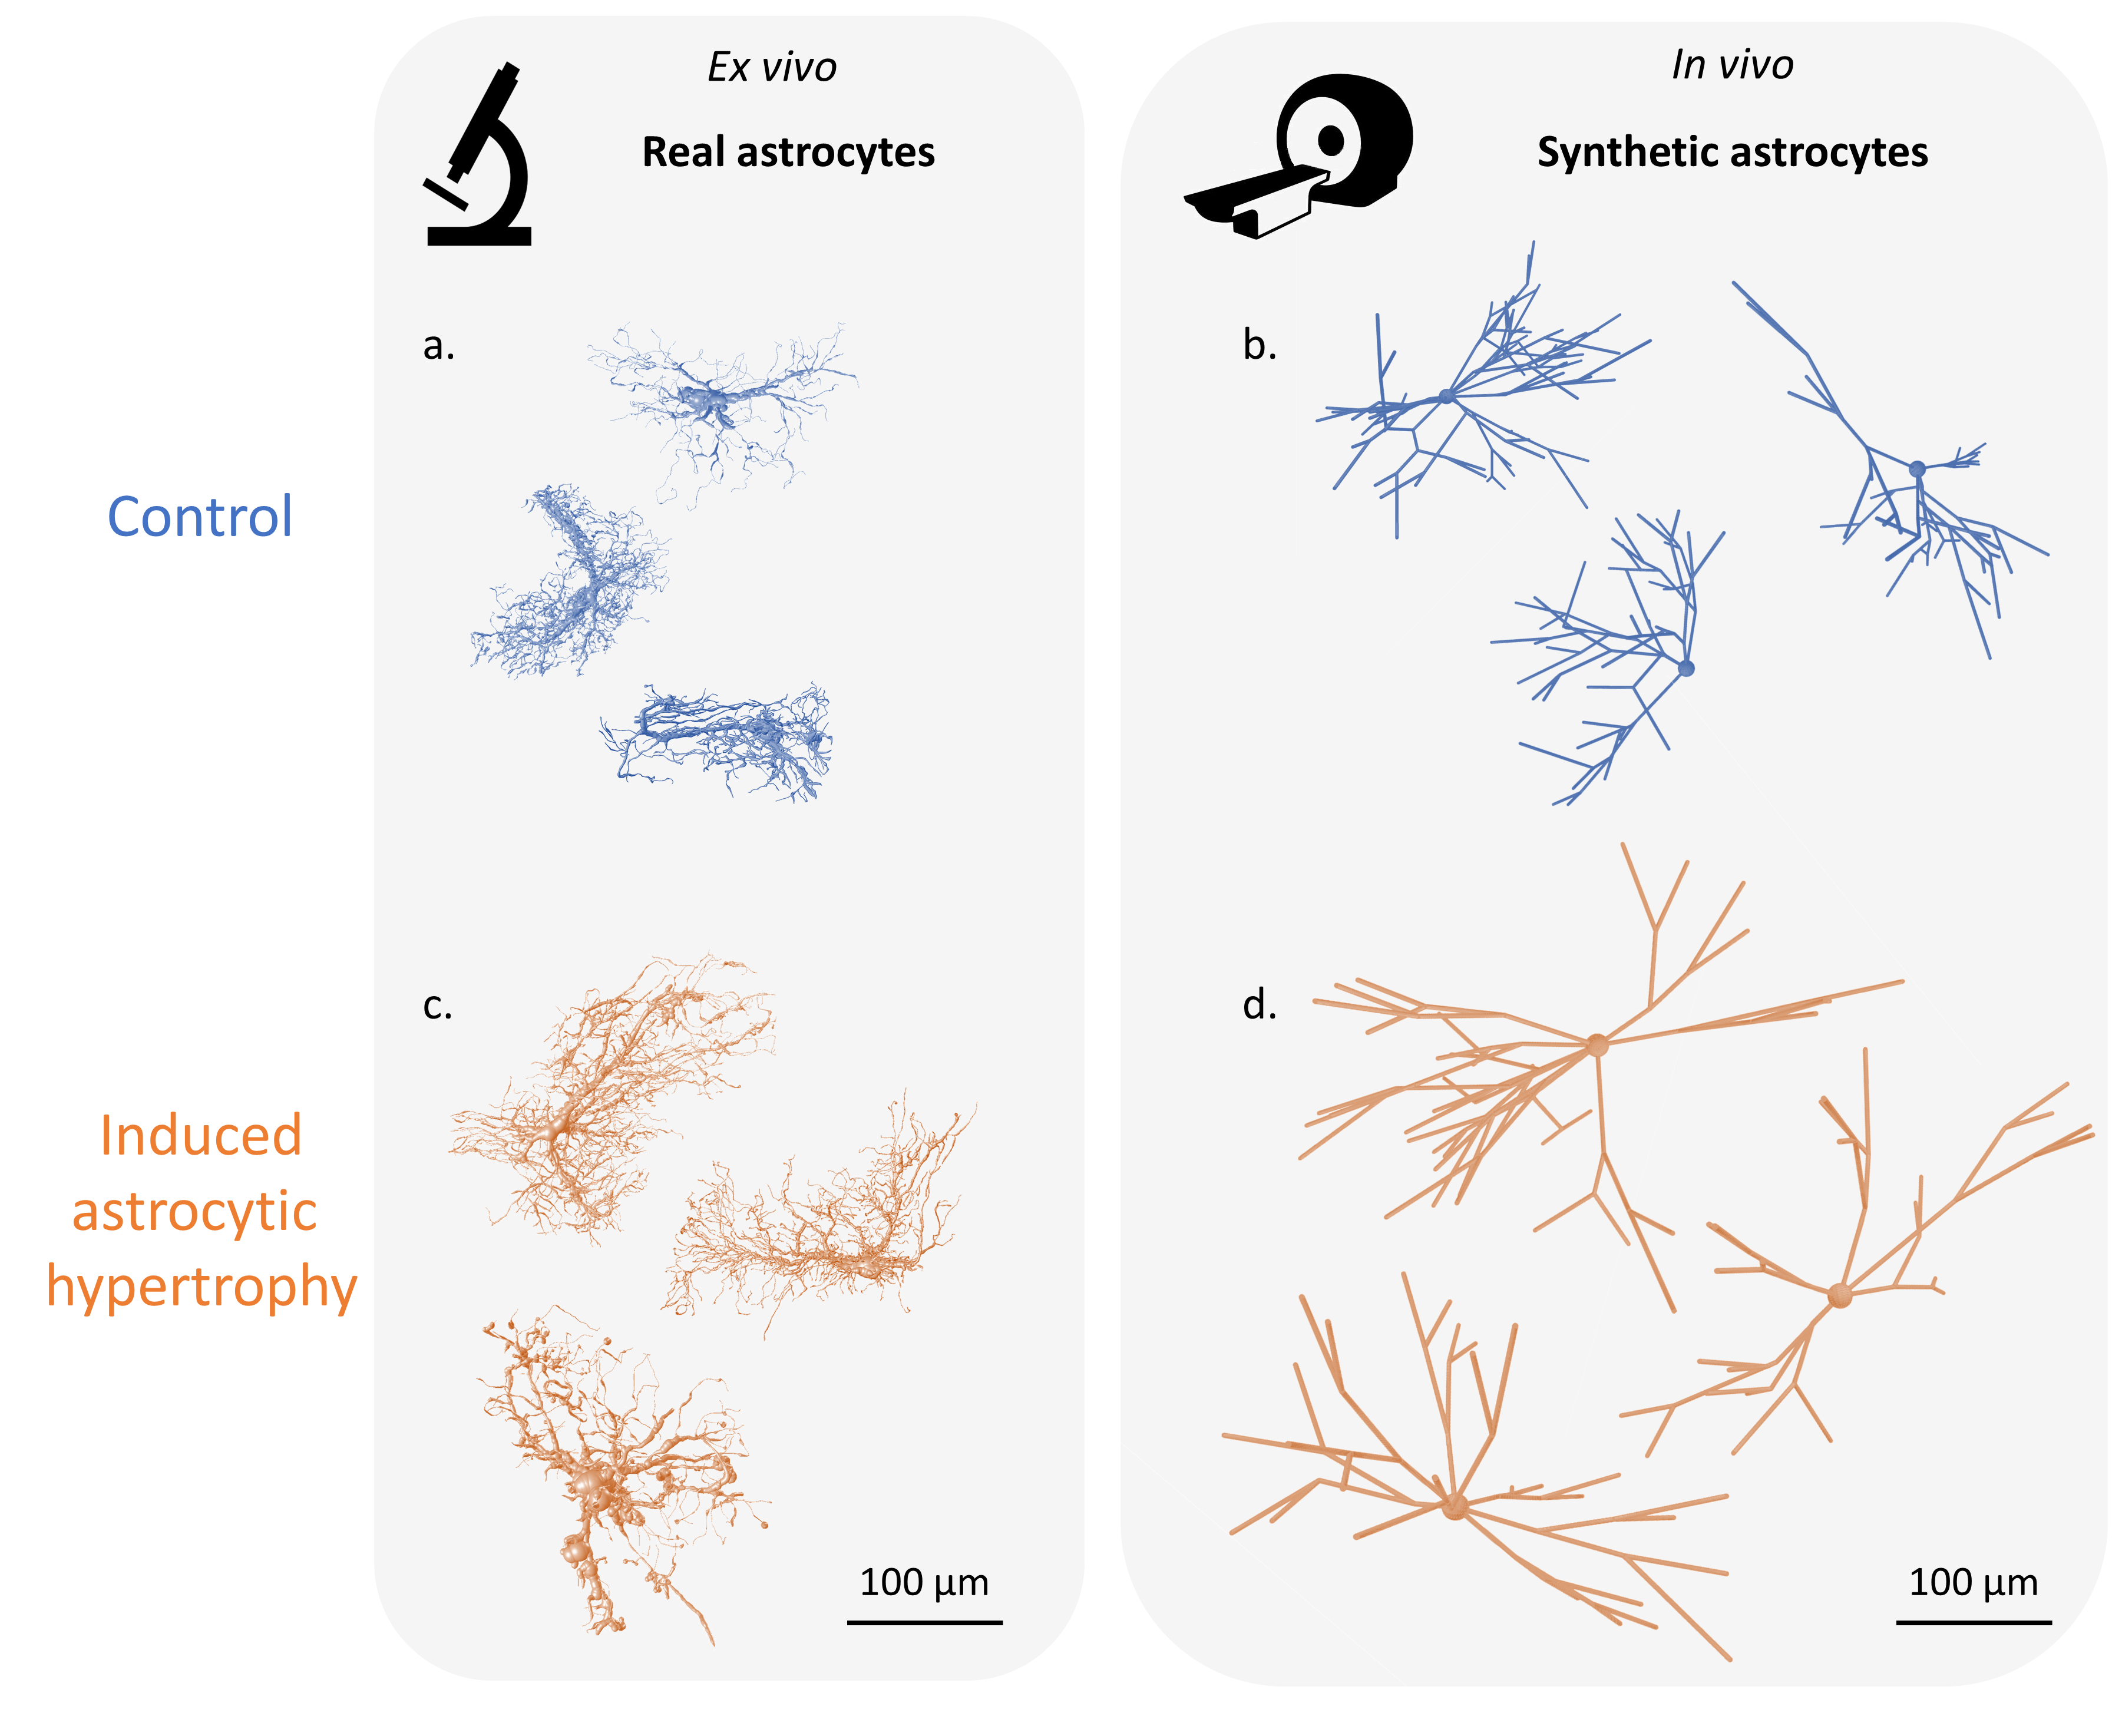
Figure 3
Representative astrocytes (3D reconstructions from co-focal microscopy) in a mouse model of astrocytic activation induced by lentiviral injection of CNTF+GFP in the striatum6 (c) compared to control (a). Typical cell morphologies obtained with the modeling2,6 of myo-inositol diffusion data acquired on the same mouse model(b) and control(d).