Multicenter MRS/MRSI Studies: What to Do & How
1Radiology/ A.A. Martinos Center for Biomedical Imaging, Massachusetts General Hospital, Charlestown, MA, United States, 2Harvard Medical School, Boston, MA, United States
Synopsis
Imaging biomarkers may be used to help identify the natural history of disease progression, monitor therapeutic response, and identify side effects. 1H MRS offers the unique ability to measure metabolite levels in a non-invasive manner and has been widely used to access metabolisms in the brain, muscle, liver, prostate, breast, kidney, etc. However, MRS has only infrequently used in multi-center clinical trials. Here we discuss the potential and limitations of the techniques and suggest recommendations for the application of MRS to multi-center clinical trials.
Motivation
In clinical trials, clinical outcome assessment measures, such as the patient’s symptoms, are often the primary outcome measures. However, they usually lack sensitivity especially in the early stages of the disease, have poor test–retest reliability [1] and require long clinical trials with large sample sizes [2]. Therefore, clinical assessment measures should be supplemented with non-invasive neuroimaging biomarkers to help identify populations for a study, monitor therapeutic response, and identify side effects.Basics of MRS examination
1H MRS offers the unique ability to measure metabolite levels in a non-invasive manner and has been widely used to assess metabolisms in the brain, muscle, liver, prostate, breast, kidney, etc. Typical metabolites that can be detected include: N-acetylaspartate (NAA), a marker of neuronal density and viability; creatine/phosphocreatine (tCr), a marker for bioenergetics; choline-containing compounds, membrane markers related to tumor malignancy; and lactate (Lac), produced by anaerobic glycolysis. MR spectra acquired with short echo times are characterized by additional resonances from myo-inositol (mI), a proposed neuroinflammatory marker, and glutamate/glutamine (Glx), an excitatory neurotransmitter and its precursor. In the past several years the metabolite 2-Hydroxyglutarate (2HG) has received much attention as an oncometabolite [3, 4].1H MRS has been used to improve diagnosis, to better define the natural history of a disease process, and, in some studies, to monitor metabolic responses to therapy [5]. Despite its potential to provide meaningful biomarkers for disease progression and metabolic response to therapy, there is a wide notion that MRS is difficult to implement within clinical workflow and lacks both sensitivity and specificity [6]. The presentation will discuss several prior clinical trials, their outcomes and limitations.
Preparation for multi-center clinical trials
Prior to the trial, investigators will need to establish the cohort of participants, the clinical outcome measures, and which biomarker/metabolite can be used to objectively track the disease-related biological changes. For drug studies, one needs to establish the expected effect size and the potential adverse events of the agents to be tested.Generalizability:
An important factor is the generalizability of outcomes. Prior studies which established efficacy were often derived from a single imaging center, utilizing highly advanced image acquisition, analysis software, and expertise not easily available in a clinical setting [2]. In contrast, most therapeutic trials are performed in a multi-center setting, combining data from a variety of MR scanners from different vendors, different field strengths, and potentially acquired with different MRS sequences. Thus, when choosing sites for a clinical trial, investigators need to find out in advance the participating sites’ infrastructure, resources, and capabilities in terms of vendors, MRI field strengths, RF coils, available pulse sequences, and expertise at the sites (e.g. will an MR Physicist / MR Spectroscopist or dedicated MR technologists perform the MRI/MRS scans?)
Harmonization:
Usage of multiple scanners necessitates harmonization of data acquisition and analysis protocols between centers and, most importantly, stringent quality control. Important considerations include:
i) Single voxel spectroscopy (SVS) vs. 2D/3D MRSI: SVS is appropriate for investigation of focal lesions, specific anatomical regions, or diffuse brain diseases. However, MRSI is preferred when multiple areas need to be evaluated simultaneously, e.g., heterogeneous tumor lesions [7].
ii) In order to reassure consistent repositioning of the MRS volume of interests (VOIs) between scans, the distribution of training material is important. Recently, more sophisticated methods (e.g. Auto VOI [8]) using automated positioning and alignment of anatomical landmarks to reproducibly place VOIs are available or are currently investigated.
iii) The choice of echo time (TE) depends on the question being asked. Intermediate TE (135 to 144 ms) spectra may result in fewer metabolites, however, they have less baseline distortion, are easy to process and analyze and the lactate resonance is inverted, which makes it easier to differentiate from lipids/macromolecules. On the other hand, short TE demonstrates peaks attributable to more metabolites, including glutamine, glutamate, myo-inositol lipids and macromolecules. Recently, a TE of 97 ms has been identified as optimal for the detection of 2HG [3, 4].
iv) Other parameters to be decided on beforehand include repetition time (TR), number of averages, and of course VOI size.
Quality Control
To assess test-retest reproducibility (intra-site variability) and inter-site variability, phantom measurements and healthy control subject measurements (ideally a traveling human phantom if the budget allows) can be incorporated [9, 10].Analysis
The data analysis should be performed at one central site by one software, making sure of consistent pre-processing of data (e.g. Eddy current compensation, Filtering, Zero filling, Fourier Transformation, Phase correction, Baseline correction).In vivo quantification of metabolite concentrations can be challenging when attempting absolute quantification. Although the normalization to creatine or water may not be perfect, it can offer a practical compromise for multi-center studies.
Examples
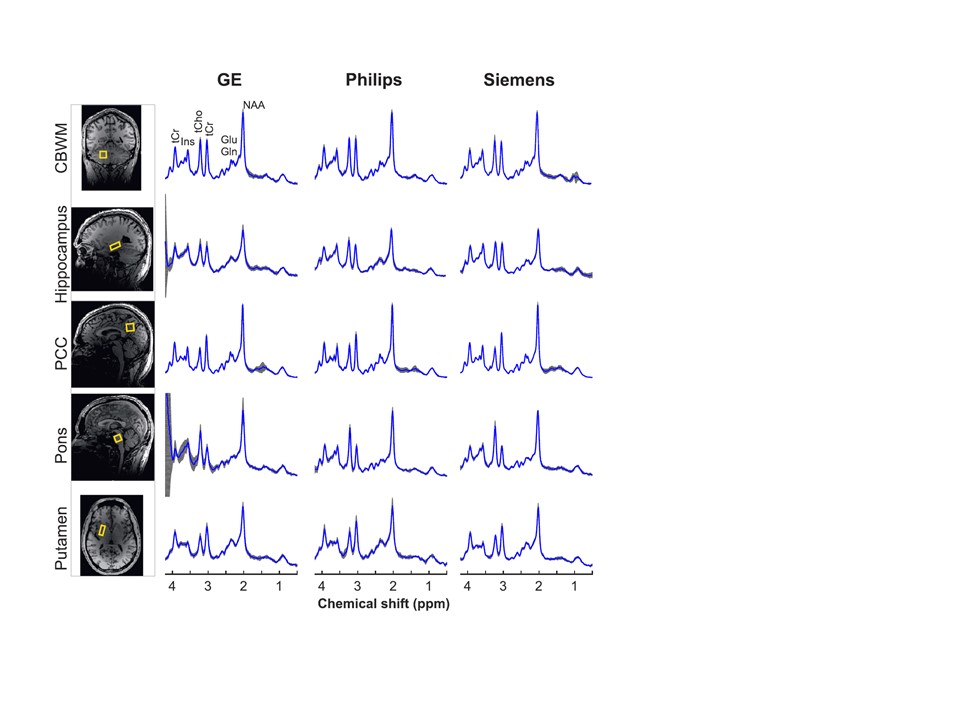
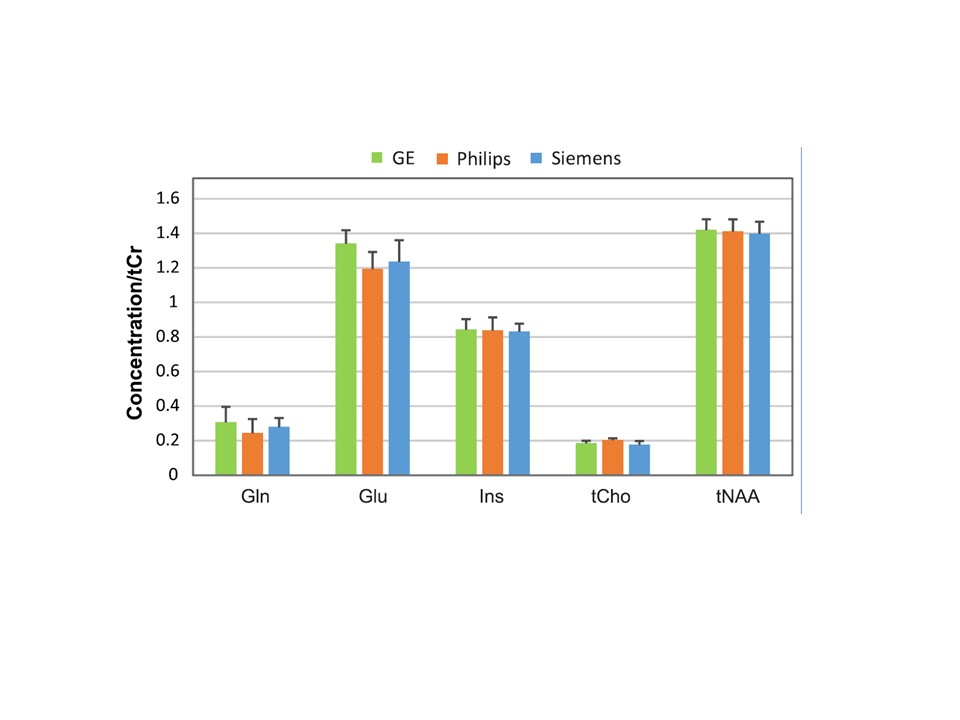
The presentation will discuss the speaker’s personal experience with multiple multi-center clinical trials in which MRS was used as an endpoint for the evaluation of neurodegenerative disorders such as spinal cerebellar ataxia (Figures 1 and 2) [11,12] and the evaluation of anti-angiogenic therapy in recurrent glioblastoma (Figure 3) [13].Conclusion
In conclusion, if carefully conducted, MRS can be a powerful tool to non-invasively characterize biochemical-pathologic changes in multi-center clinical trials.Acknowledgements
This work was supported by funding from the National Institutes of Health (NIH) (R01NS080816, U01NS104326, R01CA190901, U01CA079778 and U01CA080098).References
1. Mueller SG, Schuff N, Weiner MW. Evaluation of treatment effects in Alzheimer's and other neurodegenerative diseases by MRI and MRS. NMR Biomed. 2006;19(6):655-68. doi: 10.1002/nbm.1062. PubMed PMID: 16986115; PubMed Central PMCID: PMCPMC1820857.
2. Ashizawa T, Oz G, Paulson HL. Spinocerebellar ataxias: prospects and challenges for therapy development. Nat Rev Neurol. 2018;14(10):590-605. doi: 10.1038/s41582-018-0051-6. PubMed PMID: 30131520; PubMed Central PMCID: PMCPMC6469934.
3. Andronesi OC, Kim GS, Gerstner E, Batchelor T, Tzika AA, Fantin VR, et al. Detection of 2-hydroxyglutarate in IDH-mutated glioma patients by in vivo spectral-editing and 2D correlation magnetic resonance spectroscopy. Sci Transl Med. 2012;4(116):116ra4. doi: 10.1126/scitranslmed.3002693. PubMed PMID: 22238332; PubMed Central PMCID: PMCPMC3720836.
4. Choi C, Ganji SK, DeBerardinis RJ, Hatanpaa KJ, Rakheja D, Kovacs Z, et al. 2-hydroxyglutarate detection by magnetic resonance spectroscopy in IDH-mutated patients with gliomas. Nat Med. 2012;18(4):624-9. doi: 10.1038/nm.2682. PubMed PMID: 22281806; PubMed Central PMCID: PMCPMC3615719.
5. De Stefano N, Filippi M, Miller D, Pouwels PJ, Rovira A, Gass A, et al. Guidelines for using proton MR spectroscopy in multicenter clinical MS studies. Neurology. 2007;69(20):1942-52. doi: 10.1212/01.wnl.0000291557.62706.d3. PubMed PMID: 17998486.
6. Weinreb JC, Blume JD, Coakley FV, Wheeler TM, Cormack JB, Sotto CK, et al. Prostate cancer: sextant localization at MR imaging and MR spectroscopic imaging before prostatectomy--results of ACRIN prospective multi-institutional clinicopathologic study. Radiology. 2009;251(1):122-33. doi: 10.1148/radiol.2511080409. PubMed PMID: 19332850; PubMed Central PMCID: PMCPMC2663583.
7. Wilson M, Andronesi O, Barker PB, Bartha R, Bizzi A, Bolan PJ, et al. Methodological consensus on clinical proton MRS of the brain: Review and recommendations. Magn Reson Med. 2019;82(2):527-50. doi: 10.1002/mrm.27742. PubMed PMID: 30919510.
8. Park YW, Deelchand DK, Joers JM, Hanna B, Berrington A, Gillen JS, et al. AutoVOI: real-time automatic prescription of volume-of-interest for single voxel spectroscopy. Magn Reson Med. 2018;80(5):1787-98. doi: 10.1002/mrm.27203. PubMed PMID: 29624727; PubMed Central PMCID: PMCPMC6107418.
9. Turner MR, Bowser R, Bruijn L, Dupuis L, Ludolph A, McGrath M, et al. Mechanisms, models and biomarkers in amyotrophic lateral sclerosis. Amyotroph Lateral Scler Frontotemporal Degener. 2013;14 Suppl 1:19-32. doi: 10.3109/21678421.2013.778554. PubMed PMID: 23678877; PubMed Central PMCID: PMCPMC4284067.
10. Gunter JL, Bernstein MA, Borowski BJ, Ward CP, Britson PJ, Felmlee JP, et al. Measurement of MRI scanner performance with the ADNI phantom. Med Phys. 2009;36(6):2193-205. doi: 10.1118/1.3116776. PubMed PMID: 19610308; PubMed Central PMCID: PMCPMC2754942.
11. Deelchand DK, Berrington A, Noeske R, Joers JM, Arani A, Gillen J, et al. Across-vendor standardization of semi-LASER for single-voxel MRS at 3T. NMR Biomed. 2019:e4218. doi: 10.1002/nbm.4218. PubMed PMID: 31854045.
12. Joers JM, Deelchand DK, Guo B, Eberly LE, Park YW, Berrington A, et al., editors. Multi-site/Multi-vendor reproducibility of advanced MRS at 3T in a clinical cohort. ISMRM 28th Annual Meeting & Exhibition; 2020; Sydney, Australia.
13. Ratai EM, Zhang Z, Snyder BS, Boxerman JL, Safriel Y, McKinstry RC, et al. Magnetic resonance spectroscopy as an early indicator of response to anti-angiogenic therapy in patients with recurrent glioblastoma: RTOG 0625/ACRIN 6677. Neuro Oncol. 2013;15(7):936-44. doi: 10.1093/neuonc/not044. PubMed PMID: 23645534; PubMed Central PMCID: PMCPMC3688017.
Figures
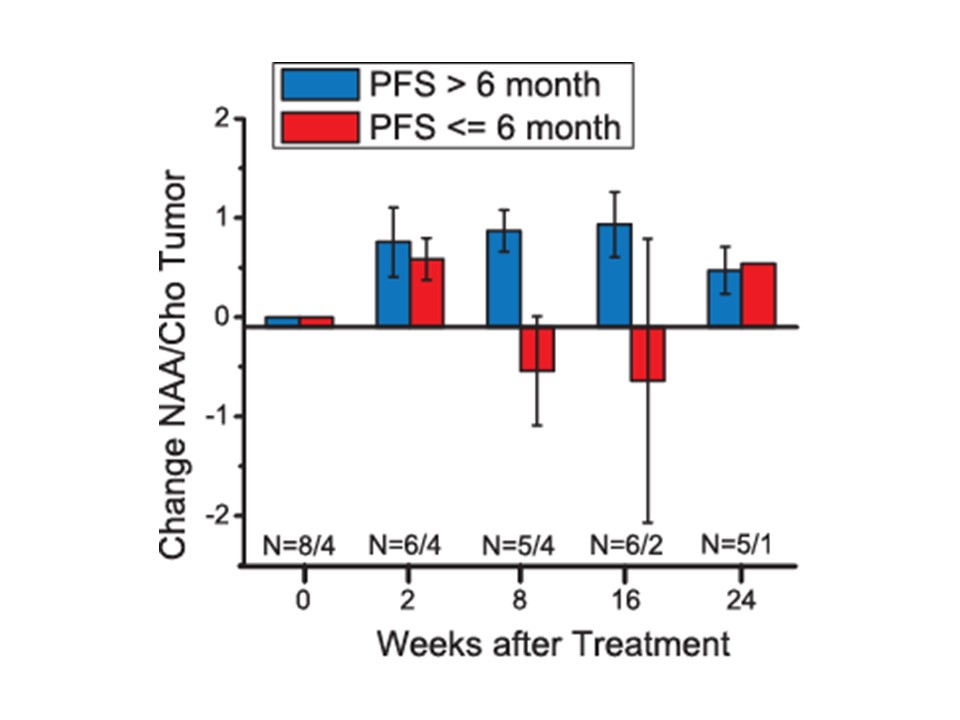
Distinguishing actual tumor response to anti-angiogenic therapy from so-called “pseudo-response” can be challenging. A multicenter trial by the American College of Radiology Imaging Network demonstrated increased NAA/Cho levels in the tumor at 8 weeks post treatment are associated with six month progression free survival.
Changes in NAA/Cho from baseline in tumor voxels grouped by progression free survivors at 6 months (PFS > 6 months, blue) and non progression free survivors (PFS ≤ 6 months, red). Error bars represent standard error of the mean (Ratai et al. Neuro Oncol. 2013)