Quantitative Ultrashort Echo Time MR Imaging of Tendon
1University of California, San Diego, San Diego, CA, United States, 2VA San Diego Health System, CA, United States
Synopsis
In the human body, tendons perform the function of transferring force from muscle to bone in order to execute movements. Tendons typically have short apparent transverse relaxation times (T2) and show little or no signal with conventional clinical pulse sequences. UTE sequences allow us to directly image and quantify the clinically “MR invisible” tendons and its enthesis. This presentation aimed to investigate the MR morphology of tendons and entheses, then assess their MR properties, including T2*, T1, T1rho, magnetization transfer ratio and magnetization transfer modeling of parameters characterizing the water and macromolecular proton fractions of tissue using UTE sequences.
Target audience
This presentation will benefit the one who is interested in new MR imaging techniques to evaluate tendinopathy.Outcome
The conventional MRI sequences cannot detect signals from tendon. With ultrashort echo time (UTE) sequences, the tendon signals can be well detected and future quantified. New developments about the quantitative UTE techniques including UTE-T2*, UTE-T1, and UTE-magnetization transfer (MT) will be introduced during the presentation.Purpose
In the human body, tendons perform the function of transferring force from muscle to bone in order to execute movements (1). MRI has been widely used for visualizing the features of arthritis and traumatic disease,6 but conventional clinical MRI has not been helpful for demonstrating and characterizing the key normal tissues present in tendons and entheses. Tendons typically have short apparent transverse relaxation times (T2) and show little or no signal with conventional clinical pulse sequences (2-4). UTE sequences allow us to directly image and quantify the clinically “MR invisible” tendons and its enthesis. This presentation aimed to investigate the MR morphology of tendons and entheses, then assess their MR properties, including T2*, T1, magnetization transfer ratio (MTR) and magnetization transfer (MT) modeling of parameters characterizing the water and macromolecular proton fractions of tissue using UTE sequences at 3 T.Methods
Whole ankle joints, Achilles tendon and rotator cuff tendon samples were obtained from the University of California, San Diego (UCSD) Medical School Anatomical Preparation Laboratory. MR data were acquired using a 3D UTE sequence implemented on a 3T MR750 scanner (GE Healthcare Technologies, Milwaukee, WI, USA) with a maximum gradient performance of 50 mT/m and 200 mT/m/ms. Both knee coil and homemade small solenoid coils were used for data acquisition. Morphological imaging was performed with the basic 3D UTE Cones sequence, which employed a short rectangular pulse (duration 26-150 μs) for signal excitation followed by spiral sampling with conical view ordering (5). Conventional clinical gradient echo and fast spin echo (FSE) sequences, including T1 and proton density weighted imaging, were performed for comparison.Quantitative imaging was performed with a dual‐echo 3D UTE Cones sequence to measure T2* (two sets of dual echoes with TE values of 0.032/4.4 ms and 0.4/8.8 ms, TR = 20 ms, a flip angle or FA of 10°, fat saturated). 3D UTE Cones variable FA (VFA) acquisitions were used to measure T1 (TR = 20 ms, FA = 5°, 10°, 20°, and 30°, TE = 0.032 ms) with B1 correction using actual FA mapping (TR = 20/100 ms, FA = 45°, TE = 0.032 ms) (6). A Cones MT sequence was used to measure MTR with a series of MT frequency offsets (Δ f = 2, 5, 10, 20, and 50 kHz) and MT powers (θ = 400°, 600°, 800°, 1000°). To accelerate the UTE‐Cones MT data acquisition, multiple spokes (n = 11) were utilized with each MT preparation pulse (7). Other imaging parameters included a bandwidth (BW) of 166 kHz, a field of view (FOV) of 11 cm, a slice thickness of 2 mm, 36 slices, acquisition matrix of 256 × 256, total scan time of 8 min for T2* measurement, 31 min for T1 measurement, and 43.3 min for MTR and MT modeling, respectively.
Results
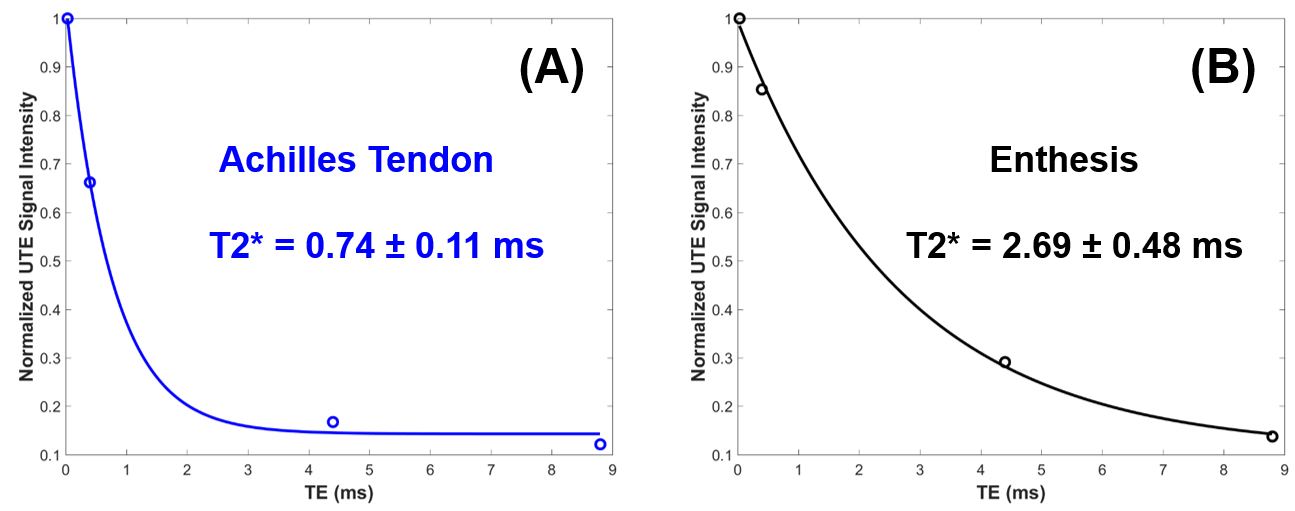
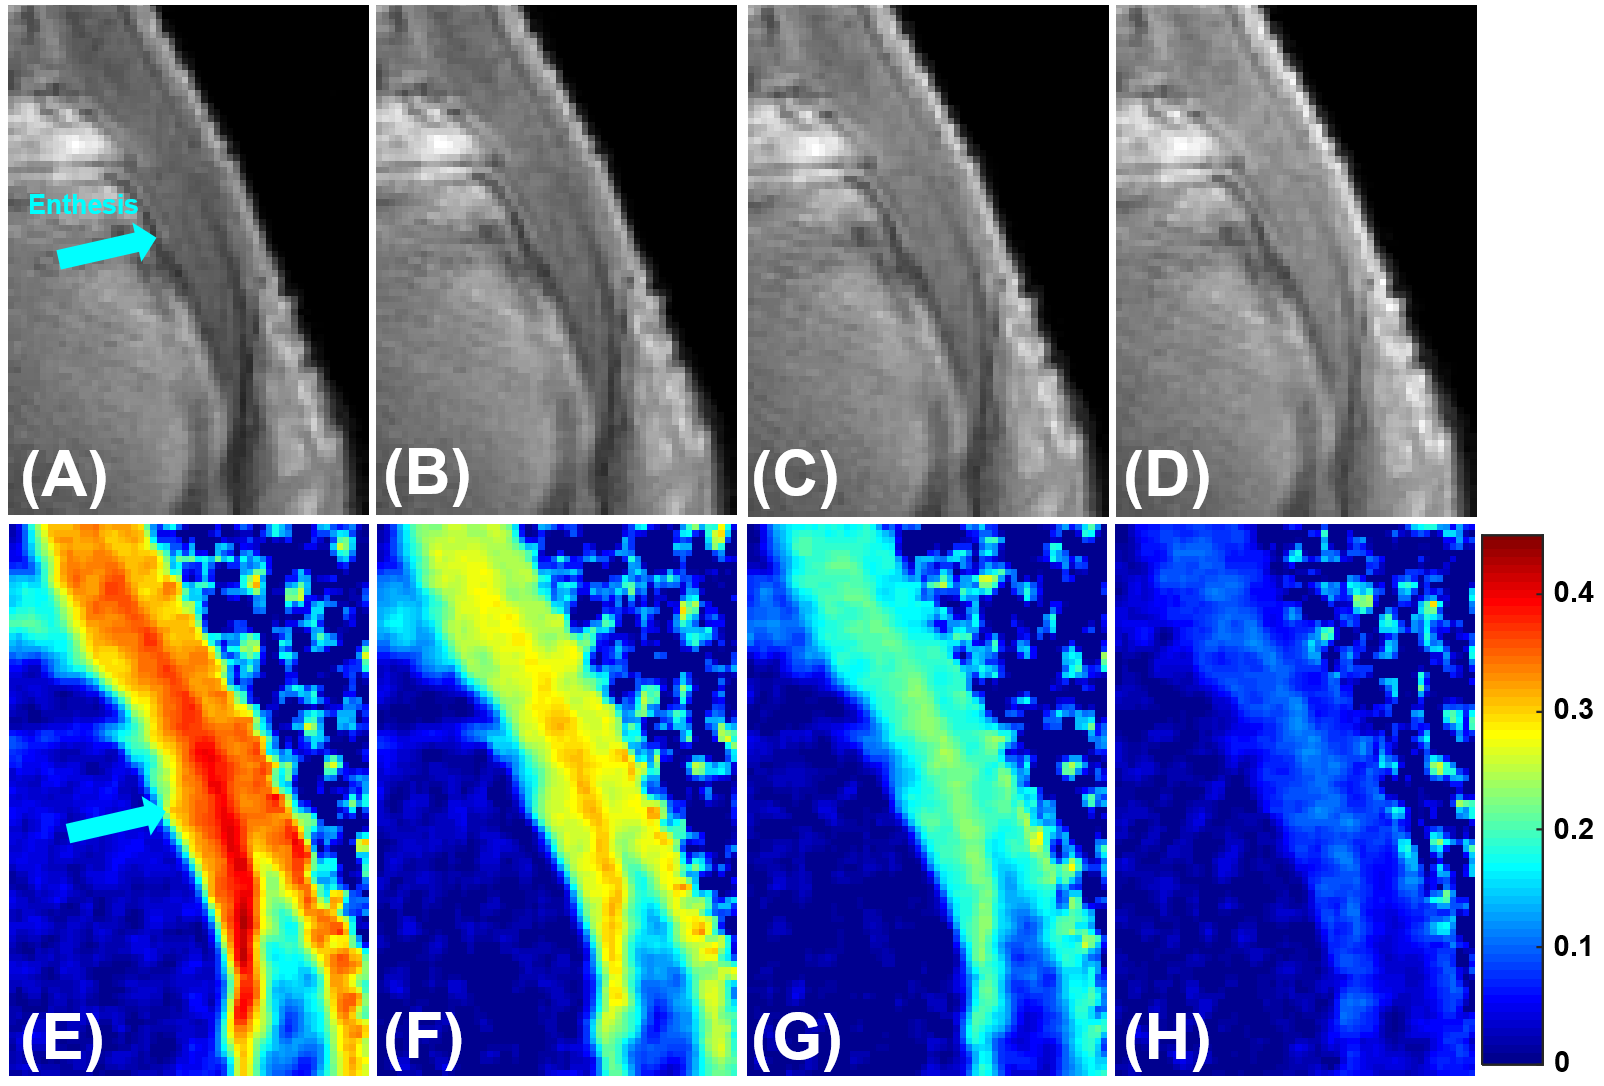
Figure 1 shows representative single‐component T2* fitting for the Achilles tendon and enthesis, respectively. A short T2* of 0.74 ± 0.11 ms was demonstrated for the Achilles tendon, while a longer T2* of 2.69 ± 0.48 ms was demonstrated for the enthesis.Figure 2 shows UTE MT images acquired with four frequency offsets (2, 5, 10, and 20 kHz) with an MT power of 1000°. The corresponding MTR maps are also displayed. Higher MTR values were observed when lower MT frequency offsets were used. The ankle enthesis had a lower MTR than the Achilles tendon for each set of MT frequency offset and MT power values.
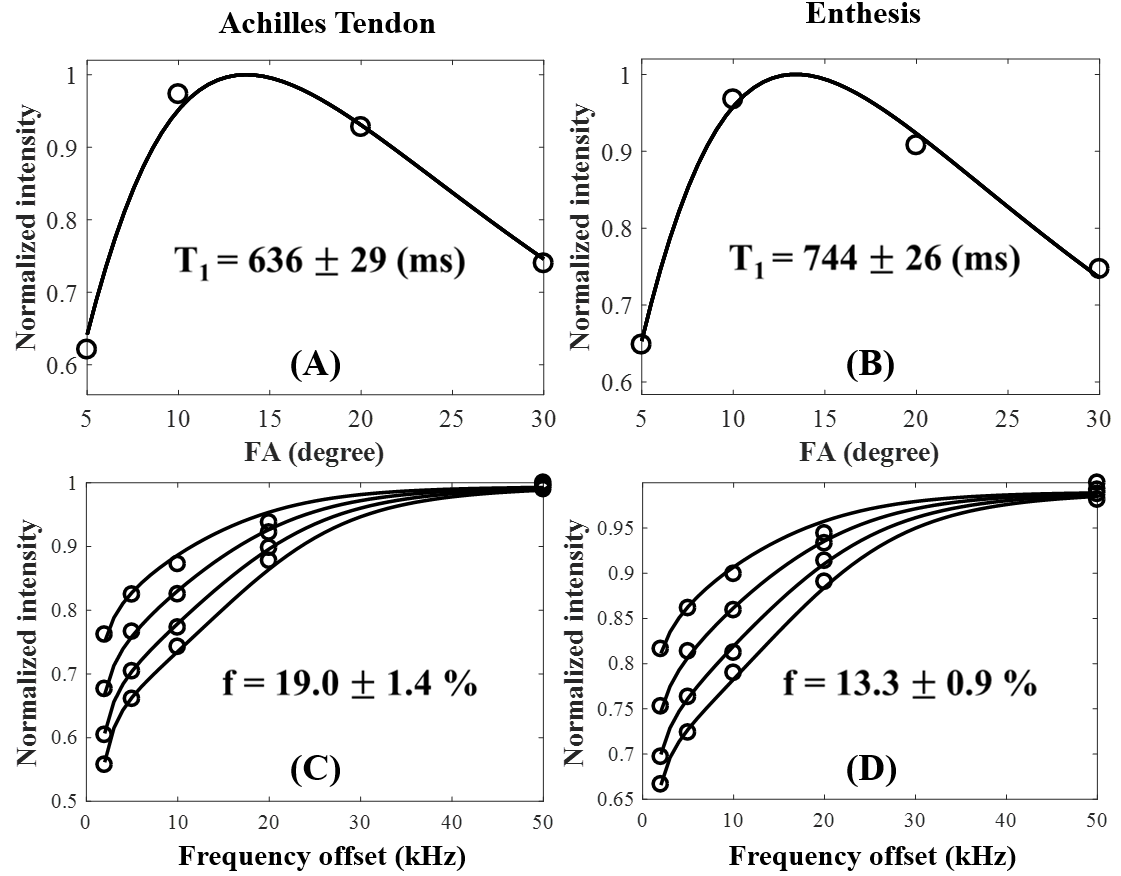
Figure 3 shows selected quantitative T1 and MT fitting curves of one specimen. Excellent T1 and two‐pool MT modeling were achieved for both the Achilles tendon and enthesis. The enthesis had a longer T1 and lower macromolecular proton fraction than the Achilles tendon.
Conclusion
The 3D UTE Cones sequences also provide quantitative measures of T2*, T1, MTR, and MT modeling of macromolecular proton fractions. These UTE measures can potentially be used as biomarkers of biomechanical degradation of the tendons and enthuses, and this is likely to help in the clinical investigation of SpA and other diseases of entheses.Acknowledgements
The authors acknowledge grant support NIH (1R21 AR073496, 1R01 AR062581-06, 1R01 AR068987, and 1R01 NS092650) and the VA Clinical Science R&D Service (I01CX001388 and I01RX002604).References
1. Benjamin M, Toumi H, Ralphs JR, Bydder G, Best TM, Milz S. Where tendons and ligaments meet bone: attachment sites ('enthesis') in relation to exercise and/or mechanical load. J Anat. 2006;208:471‐490.
2. Benjamin M, Bydder GM. Magnetic resonance imaging of enthesis using ultrashort TE (UTE) pulse sequences. J Magn Reson Imaging. 2007;25:381‐389.
3. Du J, Bydder M, Takahashi AM, Carl M, Chung CB, Bydder GM. Short T2 contrast with three‐dimensional ultrashort echo time imaging. Magn Reson Imaging. 2011;29:470‐482.
4. Chen B, Zhao Y, Cheng X, et al. Three‐dimensional ultrashort echo time Cones (3D UTE‐Cones) magnetic resonance imaging of enthesis and tendons. Magn Reson Imaging. 2018;49:4‐9.
5. Carl M, Bydder GM, Du J. UTE imaging with simultaneous water and fat signal suppression using a time‐efficient multi‐spoke inversion recovery pulse sequence. Magn Reson Med. 2016;76:577‐582.
6. Ma YJ, Zhao W, Wan L, Guo T, Searleman A, Jang H, Chang EY, Du J. Whole knee joint T1 values measured in vivo at 3T by combined 3D ultrashort echo time cones actual flip angle and variable flip angle methods. Magnetic resonance in medicine. 2019 Mar;81(3):1634-44.
7. Ma YJ, Chang EY, Carl M, Du J. Quantitative magnetization transfer ultrashort echo time imaging using a time‐efficient 3D multispoke Cones sequence. Magn Reson Med. 2017;79:692‐700
Figures