Imaging Myocardial Fibrosis
1Brigham & Women's Hospital, United States
Synopsis
Mapping of the magnetization relaxation parameters such as T1 in the myocardium has transformed cardiac magnetic resonance (CMR) over the last decade into a highly versatile imaging modality for myocardial tissue characterization. T1 mapping rendered it possible to detect diffuse myocardial fibrosis that is not visible by late-gadolinium enhancement. Initially, this was accomplished by estimating the extracellular volume fraction for gadolinium contrast as a biomarker that correlates with the accumulation of connective tissue in the myocardial interstitium. Since then, significant advances have also been made in the use of native imaging markers (i.e. not requiring gadolinium contrast).
Introduction
Mapping of the magnetization relaxation parameters such as T1, T2, T2* in the myocardium has transformed cardiac magnetic resonance (CMR) over the last decade into a highly versatile imaging modality for myocardial tissue characterization. The effects of myocardial ischemia and infarction on myocardial T1, T2, and T2* contrast had been studied for a long time, but the emergence of myocardial mapping techniques provided quantitative and potentially more sensitive new biomarkers for detecting myocardial pathology, including myocardial fibrosis. Initial interest in myocardial T1 mapping was instigated by realizing that the extracellular volume fraction could serve as a marker of diffuse myocardial fibrosis. Diffuse fibrosis, in contrast to focal fibrosis detected by LGE, arguably requires quantitative measurements because it generally affects the entire heart muscle. Since the initial focus on ECV, native relaxation properties of myocardium have been increasingly studied to serve as potential biomarkers of adverse myocardial tissue remodeling without requiring gadolinium contrast administration.T1 Mapping
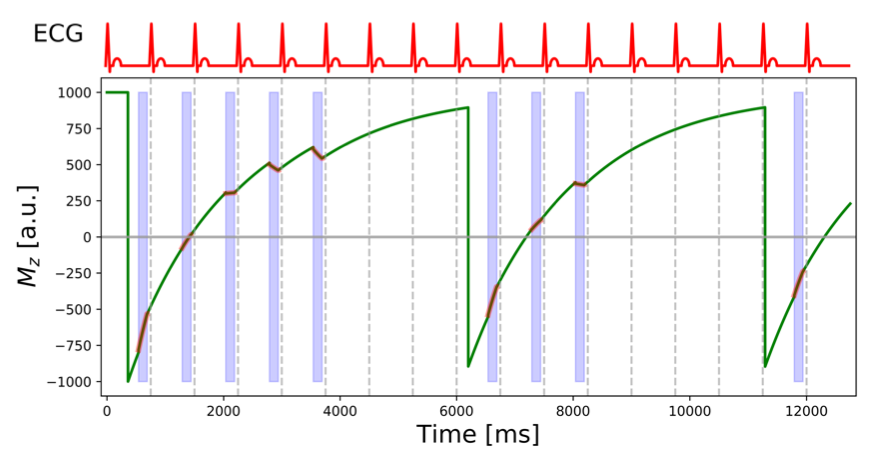
Myocardial T1 mapping is generally carried out today using single-shot image acquisitions with steady-state free precession (SSFP). The modified Look-Locker imaging (MOLLI) technique [1] is currently the preeminent technique that provides for fixed cardiac phase (diastole) a set of images with different times after inversion.A schematic illustration of MOLLI is shown in Figure 1. Modified Look-Locker imaging comprises a series of cycles – called Look-Locker cycles - initiated in each case by an inversion pulse followed by the single-shot acquisition of SSFP images during a fixed diastolic phase of the cardiac cycle. For almost complete recovery of the longitudinal magnetization additional “rest-period” heart beats are included in each cycle, except the last one. The Mz graph in Figure 1 shows the evolution of the longitudinal magnetization (solid green line) during a MOLLI acquisition. The SSFP image read-outs are highlighted by the red overlays and the light-blue shading of the interval of the cardiac cycle used for image acquisition. The top graph shows a schematic electrocardiographic (ECG) trace. The R-wave on the patients ECG trace is used to trigger the acquisition. The inversion pulse at the beginning of each Look-Locker cycle is delayed after the ECG R-wave so that the TI time for the first image corresponds to a user-defined value, typically between 100-400 ms. All other TI values are given by this first TI value and a multiple of the R-to-R durations. In the present example, 5 images are acquired during the first Look-Locker cycle, 3 during the second, and 1 during the last cycle. This MOLLI acquisition scheme is therefore referred to as 5-3-1.
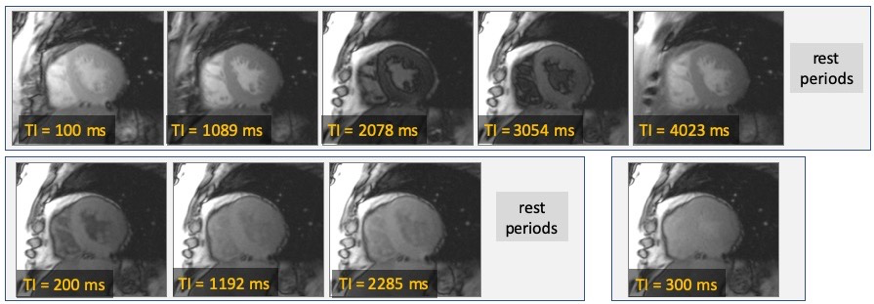
Figure 2 shows an example of MOLLI images of the heart acquired with a 5-3-1 scheme. The times after the inversion pulse (TI) for each image are shown as insets for each image. Only the first TI value is fixed by the user, and later TI values are determined by the patients R-to-R durations. Images are generally acquired with breath-holding to facilitate calculation of T1 maps.
Possible Alternatives to MOLLI for Myocardial T1 Mapping are
- Use saturation preparation for shorter acquisition and heart-rate independence (SASHA) [2]·
- STONE for more efficient multi-slice coverage than MOLLI [3]
Technical Challenges of T1 Mapping
- Motion-correction for calculation of pixel-wise T1 maps – through-plane motion cannot be corrected with current approaches
- T1 estimates from MOLLI are dependent on sequence parameters (e.g. flip angle) due to magnetization transfer and other effects from sequence on the measured magnetization.
Extracellular Volume Fraction
The myocardial extracellular volume (ECV) fraction can be estimated from the changes of T1 in myocardium and blood pool measured before and after administration of a gadolinium-based contrast agent. ECV provides a marker of extracellular volume expansion that is independent of potential confounders like contrast agent dosage, and within certain limits the time delay between contrast injection and T1 measurement. The ratio of R1 changes in tissue and blood is referred to as the myocardial partition coefficient for gadolinium (λGd) [4]: ΔR1tissue/ΔR1blood. The distribution volume of a gadolinium-based contrast agent in blood is approximately given by (1-Hct), where Hct, represents the blood hematocrit, expressed as a fraction. The exctracellular volume fraction (ECV) of myocardial tissue can be estimated from the partition coefficient, by correcting for the distribution volume of Gd in blood: ECV = (1-Hct)·λGd.
Reasons for myocardial ECV quantification are:
- Quantitative, largely observer-independent marker
- Can be used to assess diffuse myocardial fibrosis Potential pitfalls and challenges
- Interpretation of ECV expansion has to be disease specific and ECV increases cannot in general be equated with diffuse fibrosis
- Changes in ECV can be confounded by changes in cardiomyocyte size. E.g. after aortic valve replacement ECV may increase, but this may for the most part just reflect a decrease in cardiomyocyte size after off-loading the ventricle.
Potential pitfalls and challenges:
- Interpretation of ECV expansion has to be disease specific and ECV increases cannot in general be equated with diffuse fibrosis
- Changes in ECV can be confounded by changes in cardiomyocyte size. E.g. after aortic valve replacement ECV may increase, but this may for the most part just reflect a decrease in cardiomyocyte size after off-loading the ventricle.
Intracellular Water Lifetime
Gd-based contrast agents are excluded from the intra-cellular space in viable cells. In fact, an intact cell-membrane is paramount for maintaining cell viability. Derivation of the formula for estimating ECV is based on the assumption of fast water exchange between the intra-cellular and extra-cellular spaces in myocardial tissue. This results in a linear relationship between R1 measured in tissue and R1 measured in blood – the slope of that relationship defines the myocardial partition coefficient for Gd contrast.
The validity of the fast-exchange assumption depends on the difference of intrinsic relaxation times between extra-cellular and intra-cellular spaces relative to the rate of water-exchange. The administration of contrast changes the intrinsic (i.e. the relaxation properties without consideration of water-exchange effects) relaxation time in the extra-cellular space. Before any contrast administration the T1 relaxation times for the intra- and extra-cellular spaces are relatively close compared to the water-exchange rate – the fast exchange regime applies. As one increases contrast concentration in the extracellular space conditions change from fast-exchange through intermediate to slow exchange conditions.
If ECV is estimated based with linear fast-exchange model then it is necessary to measure the post-contrast T1 at Gd concentrations that are sufficiently low to assure these conditions of fast water exchange [5], in addition to the requirement that contrast concentration has reached a steady-state equilibrium between vascular and interstitial spaces. In practice this means that one should standardize the post-contrast T1 measurement to a time on the order of 20 minutes after administering Gd contrast if the standard ECV formula is used with one pre- and one post-contrast T1 measurements. ECV determined with the fast-exchange assumption using two T1 measurements (pre and post-contrast) was found to increase approximately linearly for as long as 45 minutes after injection [6].
The R1 relaxation rate for myocardial tissue can be described as a function of R1 in blood with a 2-space water-exchange (2SX) model of equilibrium transcytolemmal water-exchange, originally developed by Landis et al.[7, 8] The model predicts a deviation from the linear dependence of R1t in tissue on the R1 in blood that becomes more pronounced as R1 in blood increases, and with increasing intra-cellular lifetime (τic). This sublinear dependence on R1 of blood can be one source for underestimating ECV[5]. The effects of transcytolemmal water exchange can provide useful information on cardiomyocyte size and cell permeability.
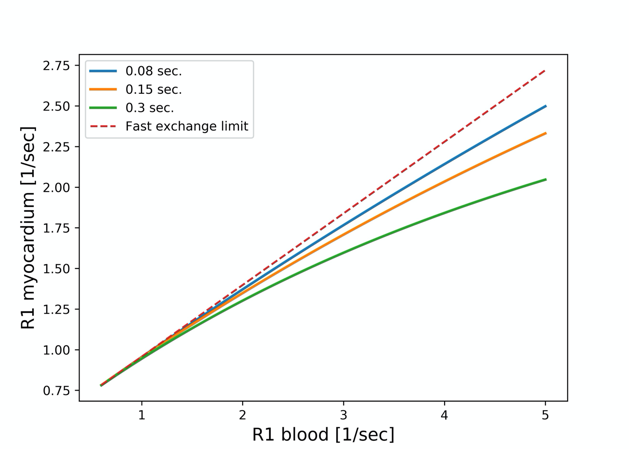
Figure 3 shows the dependence of the R1 relaxation rate in myocardium on R1 in blood for different rates of water exchange between the intra- and extra-cellular spaces. Water exchange moves from the fast exchange regime prevalent without contrast administration to intermediate-to-slow exchange conditions. At higher Gd-concentrations the rate of exchange becomes a bottleneck for the relaxation of the intracellular water. Under fast and intermediate exchange rates the relaxation recovery can still be well approximated by a single-exponential recovery. Each of the curves in Figure 3 is for a different rate of water exchange, listed in seconds in the legend. The dashed line corresponds to the fast exchange limit. The nominal ECV for the simulated curves was 0.28, and blood hematocrit was assumed to be 41%.
Potential advantages for measuring intra-cellular water lifetime as measure of cardiomyocyte size
- (1-ECV), multiplied with left ventricular myocardial mass [10] provides an approximate measure of totalcardiomyocyte volume in the heart. It is an approximate measure because cardiomyocytes contribute by volume around 90% of total intra-cellular volume.
- A change of total LV cardiomyocyte mass can come from changes in cardiomyocyte size and changes in the number of cardiomyocytes (e.g. from apoptosis). A separate measure of average cardiomyocyte size could resolve the contribution of potentially confounding effects.
Potential challenges for estimation of intra-cellular water lifetime (τic):
- Model requires > ~ 4 post-contrast T1 measurements to avoid overfitting.
- Effects of noise on the T1 data are biased. Bias can be mitigated by increasing number of T1 data points.
- Only validation against histological measurements has been with Look-Locker sequence
- Changes of τic can reflect changes in cell-size and cell-membrane permeability. Water transport across cell-membrane depends on metabolic state.
Native T1 and T1ρ
Native T1 has become a useful biomarker, though the causes and mechanisms of changes of native T1 can be complex and relate to a multitude of factors that characterize the tissue microstructure and milieu. At the risk of some oversimplification we list below examples of physiological and pathological changes and their effect on native T1.
Increases of native T1 occur with
- Myocardial edema· Amyloid protein accumulation
- Coronary vasodilation
Decreases of native T1 occur with
- myocardial lipid accumulation
- infarct related myocardial accumulation of iron
- Fabry disease and iron overload
The relationship of native myocardial T1 with fibrosis remains a topic of active investigation. Myocardial edema and inflammation often precede extensive fibrosis.
T1ρ: T1 in the rotating frame of reference (T1ρ or T1 rho) refers to the T1 in the presence of a B1 magnetic field that “locks” the magnetization in the rotating frame of reference, i.e. T1 is measured during application a radio-frequency pulse. As B1 << B0, the T1r relaxation time constant is sensitive to low-frequency relaxation mechanisms (few hundred Hz to kHz), such as interactions between macromolecules and water. T1r may be useful to detect T1 effects from 1H nuclei with relatively low mobility and these conditions may apply more in the presence of myocardial fibrosis. Variable T1r weightings can be achieved with a spin-lock preparation. The unavoidable spread of B1 related precession frequencies is refocused in the spin-lock preparation by a 180-degree pulse [9]. Each T1r preparation is followed immediately by an image readout. T1ρ can be quantified fitting the signal as a function of the duration of the spin-lock pulse - the amplitude of spin-lock pulse (γ·B1~0.1-few kHz) is typically kept constant.
Ultra-short TE (UTE) imaging has been used ex-vivo for direct assessment of connective tissue and fibrosis[10]. 1H nuclei in connective tissue are part of a “dark-pool” of spins with T2 relaxation times in the sub-millisecond range. This “dark-pool” of spins related to collagen and other connective tissue components does not directly contribute to the inversion-recovery signal measured with T1 mapping techniques with TE’s on the order of milliseconds. This fact also casts some doubt on claims that native T1 measured with techniques such as MOLLI can detect myocardial fibrosis. UTE provides a potential alternative for direct detection of the fraction of “dark-pool” spins. This concept of assessing myocardial fibrosis is compelling, but technical challenges for detecting fibrosis by in-vivo cardiac UTE imaging remain relatively high.
Acknowledgements
-References
1. Messroghli, D.R., et al., Optimization and validation of a fully-integrated pulse sequence for modified look-locker inversion-recovery (MOLLI) T1 mapping of the heart. J Magn Reson Imaging, 2007. 26(4): p. 1081-6.
2. Chow, K., et al., Saturation recovery single-shot acquisition (SASHA) for myocardial T(1) mapping. Magn Reson Med, 2014. 71(6): p. 2082-95.
3. Weingartner, S., et al., Free-breathing multislice native myocardial T1 mapping using the slice-interleaved T1 (STONE) sequence. Magn Reson Med, 2014.
4. Flacke, S.J., S.E. Fischer, and C.H. Lorenz, Measurement of the gadopentetate dimeglumine partition coefficient in human myocardium in vivo: normal distribution and elevation in acute and chronic infarction. Radiology, 2001. 218(3): p. 703-10.
5. Coelho-Filho, O.R., et al., Role of transcytolemmal water-exchange in magnetic resonance measurements of diffuse myocardial fibrosis in hypertensive heart disease. Circ Cardiovasc Imaging, 2013. 6(1): p. 134-41.
6. Kawel, N., et al., T1 mapping of the myocardium: intra-individual assessment of post-contrast T1 time evolution and extracellular volume fraction at 3T for Gd-DTPA and Gd-BOPTA. J Cardiovasc Magn Reson, 2012. 14: p. 26.
7. Landis, C.S., et al., Equilibrium transcytolemmal water-exchange kinetics in skeletal muscle in vivo. Magn Reson Med, 1999. 42(3): p. 467-78.
8. Landis, C.S., et al., Determination of the MRI contrast agent concentration time course in vivo following bolus injection: effect of equilibrium transcytolemmal water exchange. Magn Reson Med, 2000. 44(4): p. 563-74.
9. Witschey, W.R., et al., Rotating frame spin lattice relaxation in a swine model of chronic, left ventricular myocardial infarction. Magn Reson Med, 2010. 64(5): p. 1453-60.
10. de Jong, S., et al., Direct detection of myocardial fibrosis by MRI. J Mol Cell Cardiol, 2011. 51(6): p. 974-9.
Figures