Myelin Water Imaging: Multiple Compartmental Model
1University of British Columbia, Canada
Synopsis
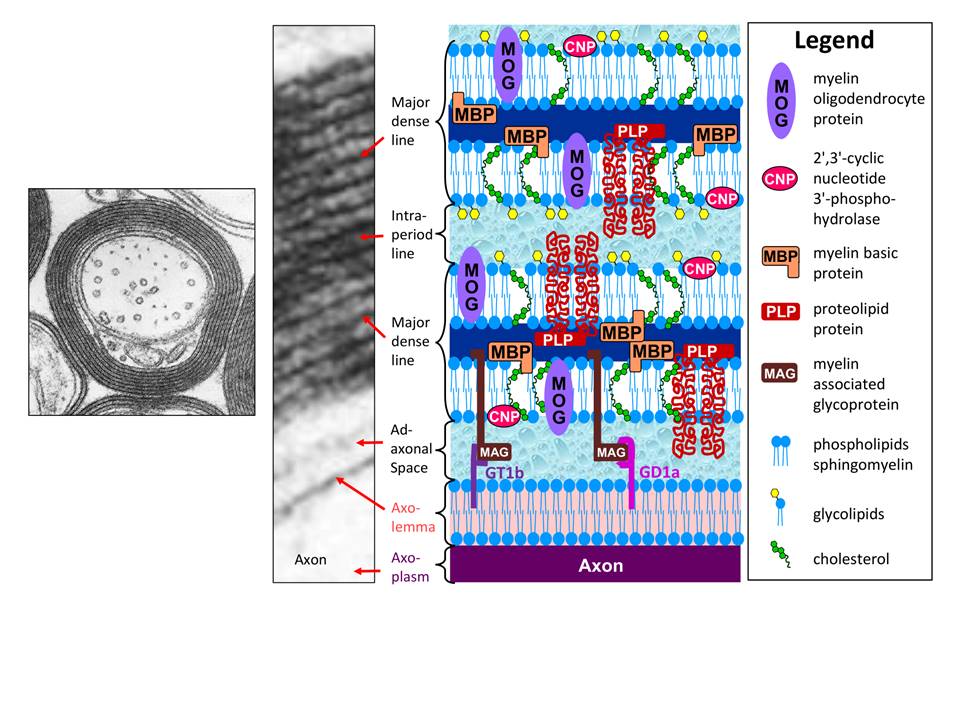
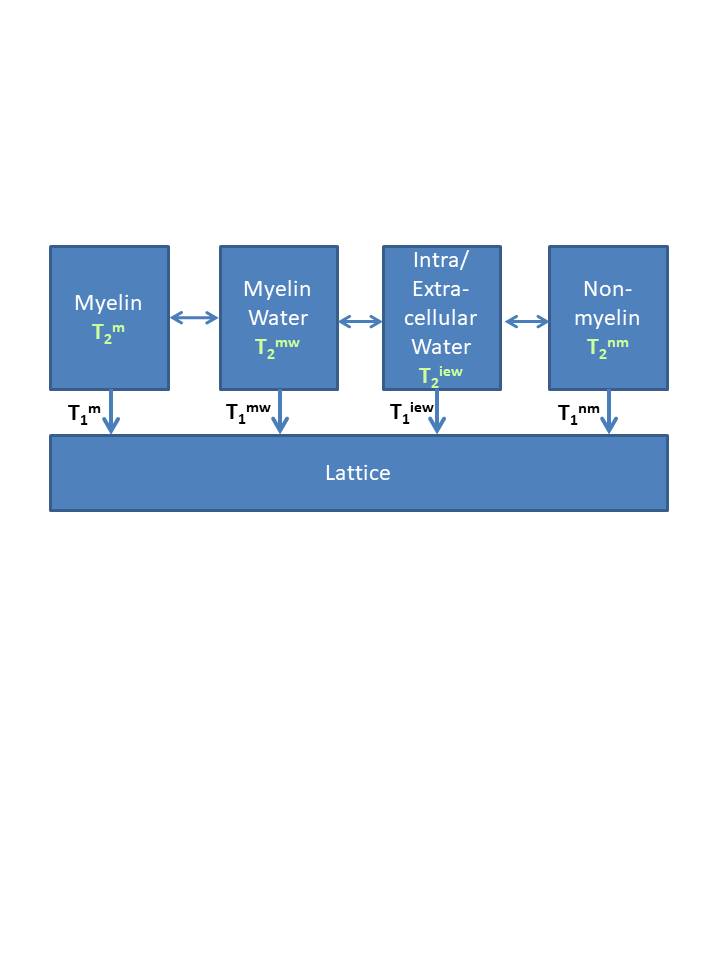
Myelin is composed of alternating layers of lipid bilayers with water in between. The multiple proton compartments in white matter can be modeled as four pools (myelin water, intra/extracellular water, myelin non-aqueous and non-myelin non-aqueous) which have different exchange properties. The water within the myelin bilayers can be measured using its shorter T1 and T2 relaxation time.
Target Audience
Clinicians and imaging scientists interested in myelin water imaging.Highlights
- White matter can be modeled with 4 proton pools- The water pools can be separated based on their relaxation times
- There is exchange between the proton pools which may affect the myelin water fraction
White Matter Models
Myelin water imaging (MWI), as the name implies, refers to imaging the signal from water associated with myelin. Myelin itself is a complex system consisting of alternating lipid bilayers and water, termed “myelin water” (Figure 1). White matter also contains water in other physical spaces, for example inside and outside of axons, termed “intra/extracellular (IE) water.” Because multiple water reservoirs exist in white matter, the MR relaxation signal cannot be accurately fit by a single exponential component. Many studies have employed a 4 pool- model (Figure 2) which includes 2 water pools (myelin water and IE water) and 2 non-aqueous proton pools (myelin and non-myelin)1, each with their own relaxation times. These pools exchange magnetisation with one another either through diffusion or cross relaxation. Due to myelin water’s close interaction with non-aqueous protons, it has a shorter T2 than IE water2. Using MWI, we can quantify this water pool thereby obtaining an in vivo measure of myelin2-5.MWI techniques
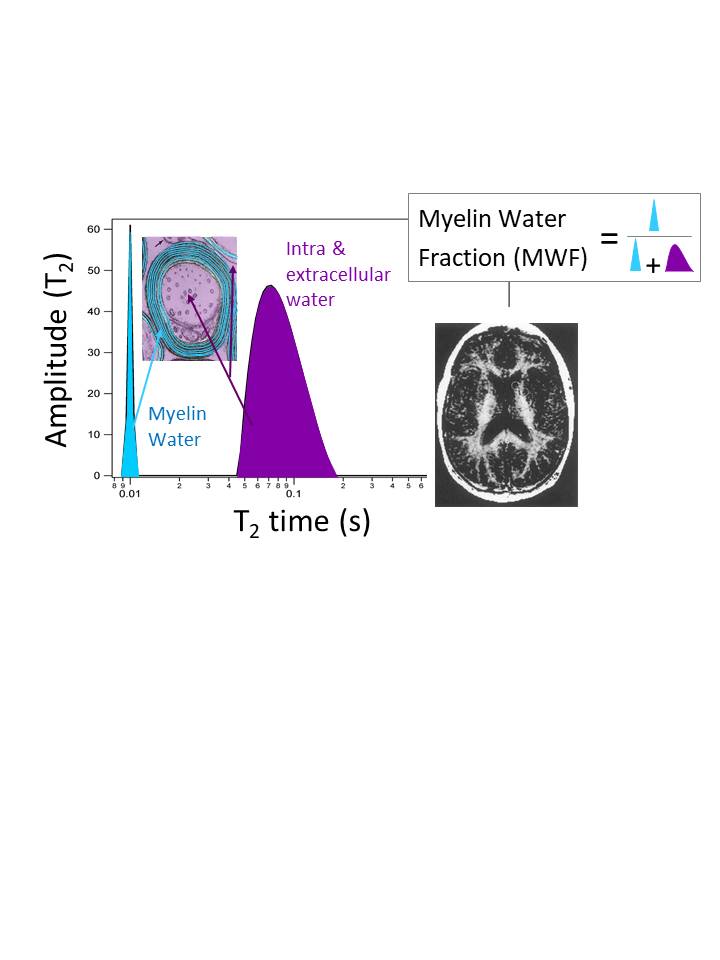
Excellent reviews of MWI techniques can be found in 6,7. Some of the most common approaches include:Multi spin-echo T2 relaxation2 - Multi spin-echo T2 is often considered the “gold standard” MWI technique. It consists of a modified Carr-Purcell-Meiboom-Gill (CPMG) sequence, typically including 32 echoes with 10ms echo spacing. At each voxel, the T2 decay curve is fit by multiple exponential components using non-negative least squares (NNLS) with stimulated echo correction. For in-vivo measurements at 3T, the myelin water fraction (MWF) is defined as the area under the T2 distribution between 0-40ms divided by the total area (Figure 3).
Combined GRAdient and Spin Echo (GRASE)8 - By collecting higher order k-space lines with gradient echoes, the CPMG sequence is accelerated.
T2 Preparation methods9,10- The signal is “prepared” with a particular T2-weighting before full-volume sampling, allowing for efficient data acquisition at selected TE times.
Multi-gradient echo (MGRE)11,12 - Decay curves are generated from T2* instead of T2 decays. T2* can be collected with shorter echo spacing allowing for more data points at early times when fast relaxing myelin water still has signal.
mcDESPOT13 - Steady state imaging is used with a variety of flip angles to characterise T1 and T2 for different water pools using a complex model.
Multi-component T114,15 / ViSTa16 - By careful sequence preparation, it is possible to extract multiple T1 components in white matter. A short T1 component has been attributed to myelin water; this component may be probed by supressing the IE water using a double inversion recovery such as the direct visualization of short transverse relaxation time component (ViSTa) approach.
Some limitations of MWI techniques
Stimulated echoes – if refocusing pulses are not 180°, some magnetisation becomes trapped along the longitudinal axis until a later pulse transfers it back into the transverse plane; this effect leads to stimulated echoes which corrupt the exponential signal decay. Stimulated echo artifacts can be corrected17.
T1 weighting – insufficient delay between excitation pulses results in T1 weighting. If TR is too short, then the measured MWF may be artificially increased18.
Magnetisation transfer effects – multi-slice acquisition techniques may result in magnetisation transfer effects due to off-resonance pulses from other slices, complicating signal decay.
Iron – the removal of iron from post-mortem samples leads to a decrease in the MWF. If iron removal beyond that contained within myelin decreases MWF, it may be possible that MWF is related to more than just myelin19.
Model limitations – assumptions about the number of water pools, expected relaxation time ranges, exchange between water pools, and Rician/Gaussian noise, all have an effect on estimated MWFs.
Further exploring white matter models with NMR experiments
The non-aqueous proton signal is MRI invisible since it decays within 100µs. However, using an NMR spectrometer, it is possible to measure the signal from both aqueous and non-aqueous protons. Two studies fitted the 4 pool model to T1 and T2 results from ex-vivo bovine brain15,20. The water signal exhibited 4 components corresponding to the 4 pools but with different weightings due to exchange15. The two shortest T1 times were close to the T2 times for myelin water and intra/extracellular water, suggesting that the T2 relaxation of myelin water and IE water is largely driven by magnetisation exchange with the corresponding non-aqueous pools.Probing proton pool exchange in vivo
To explore exchange between the proton pools in human white matter in vivo, multi-echo T2 has been combined with an MT prepulse. Since myelin water is in close contact with the non-aqueous myelin pool, the MT effect was larger for myelin water21. By varying the time between the prepulse and the multi-echo sequence, the exchange rate between the water pools can be estimated22. Exchange modelling can also be achieved by modulating the amplitude of the MT pulse as well as changing the saturation pulse duration1. Evidence that exchange rates between the water pools is influenced by myelin thickness was found by comparing rat optic nerve and sciatic nerve23,24. If the exchange rate is fast, then the MWF will be reduced. For in-vivo MWI on white matter, the effect of exchange on the MWF is still being debated.Conclusions
White matter can be modeled as 4 pools, each with unique relaxation times and exchange rates. The myelin water pool is assigned to water trapped between myelin bilayers and can be measured using many different MR techniques. By measuring the myelin water, we are able to gain insight into tissue microstructure which is invaluable in the study of development and many neurological diseases. For further discussion on the use of relaxation in characterising brain tissue microstructure refer to this review paper25.Acknowledgements
I would like to thank the UBC MRI Research Centre.References
1. Stanisz GJ, Kecojevic A, Bronskill MJ, Henkelman RM. Characterizing white matter with magnetization transfer and T(2). Magn Reson Med 1999;42:1128–1136.
2. MacKay AL, Whittall KP, J. Adler J, Li DKB, Paty DW, Graeb D. In vivo visualization of myelin water in brain by magnetic resonance. Magn Reson Med 1994;31:673–677.
3. Stewart WA, MacKay AL, Whittall KP, Moore GRW, Paty DW. Spin–spin relaxation in experimental allergic encephalomyelitis. Analysis of CPMG data using a non-linear least squares method and linear inverse theory. Magn Reson Med 1993;29:767–775.
4. Gareau PJ, Rutt BK, Karlik SJ, Mitchell JR. Magnetization transfer and multicomponent T2 relaxation measurements with histopathologic correlation in an experimental model of MS. J Magn Reson Imaging 2000;11:586–595.
5. Webb S, Munro CA, Midha R, Stanisz GJ. Is multicomponent T2 a good measure of myelin content in peripheral nerve? Magn Reson Med 2003;49:638–645.
6. Alonso-Ortiz E, Levesque IR, Pike GB. MRI-based myelin water imaging: A technical review. Magn Reson Med 2015;73:70-81.
7. Lee J, Hyun J-W, Lee J, Choi E-J, Shin H-G, Min K, Nam Y, Kim HJ, Oh S-H. So You Want to Image Myelin Using MRI: An Overview and Practical Guide for Myelin Water Imaging. J Magn Reson Imaging 2020. In press. DOI: 10.1002/jmri.27059.
8. Prasloski T, Rauscher A, MacKay AL, et al. Rapid whole cerebrum myelin water imaging using a 3D GRASE sequence. Neuroimage 2012;63:533-539.
9. Nguyen TD, Wisnieff C, Cooper MA, Kumar D, Raj A, Spincemaille P, Wang Y, Vartanian T, Gauthier SA. T2 prep three-dimensional spiral imaging with efficient whole brain coverage for myelin water quantification at 1.5 tesla. Magn Reson Med 2012;67:614–621.
10. Oh J, Han ET, Pelletier D, Nelson SJ. Measurement of in vivo multi-component T2 relaxation times for brain tissue using multi-slice T2 prep at 1.5 and 3 T. Magn Reson Imaging 2006;24:33–43.
11. Du YP, Chu R, Hwang D, Brown MS, Kleinschmidt-DeMasters BK, Singel D, Simon JH. Fast multislice mapping of the myelin water fraction using multicompartment analysis of T2* decay at 3T: a preliminary postmortem study. Magn Reson Med 2007;58:865–870.
12. Hwang D, Kim DH, Du YP. In vivo multi-slice mapping of myelin water content using T2* decay. Neuroimage 2010;52:198–204.
13. Deoni SCL, Rutt BK, Arun T, Pierpaoli C, Jones DK. Gleaning multi- component T1 and T2 information from steady-state imaging data. Magn Reson Med 2008;60:1372–1387.
14. Labadie C, Lee JH, Rooney WD, et al. Myelin water mapping by spatially regularized longitudinal relaxographic imaging at high magnetic fields. Magn Reson Med 2014;71(1):375-387.
15. Barta R, Kalantari S, Laule C, Vavasour IM, MacKay AL, Michal CA. Modeling T1 and T2 relaxation in bovine white matter. J Magn Reson 2015;259:56–67.
16. Oh SH, Bilello M, Schindler M, Markowitz CE, Detre JA, Lee J. Direct visualization of short transverse relaxation time component (ViSTa). Neuroimage 2013;83C:485-492.
17. Prasloski T, Madler B, Xiang QS, MacKay A, Jones C. Applications of stimulated echo correction to multicomponent T2 analysis. Magn Reson Med 2011;67(6):1803-14.
18. Kalantari S, Komeilizadeh N, Vavasour IM, Sahebjavaher RS, MacKay AL. “Variation of Myelin Water Fraction as a Function of TR.” 21st Annual Meeting of the International Society of Magnetic Resonance in Medicine. Salt Lake City, USA, Apr 20-26, 2013, p. 1226
19. Birkl C, Birkl-Toeglhofer AM, Endmayr V, Höftberger R, Kasprian G, Krebs C, Haybaeck J, Rauscher A. The influence of brain iron on myelin water imaging. Neuroimage. 2019;199:545-552.
20. Bjarnason TA, Vavasour IM, Chia CLL, MacKay AL. Characterization of the NMR behavior of white matter in bovine brain. Magn Reson Med 2005;54:1072–1081.
21. Vavasour IM, Whittall KP, Li DK, MacKay AL. Different magnetization transfer effects exhibited by the short and long T2 components in human brain. Magn Reson Med 2000;44:860-866.
22. Kalantari S, Laule C, Bjarnason TA, Vavasour IM, MacKay AL. Insight into in vivo magnetization exchange in human white matter regions. Magn Reson Med 2011;66:1142-1151.
23. Dula AN, Gochberg DF, Valentine HL, Valentine WM, Does MD. Multiexponential T2, magnetization transfer, and quantitative histology in white matter tracts of rat spinal cord. Magn Reson Med 2010;63:902–909.
24. Dortch RD, Harkins KD, Juttukonda MR, Gore JC, Does MD. Characterizing inter-compartmental water exchange in myelinated tissue using relaxation exchange spectroscopy. Magn Reson Med 2013;70:1450–1459.
25. Does MD. Inferring brain tissue composition and microstructure via MR relaxometry. Neuroimage 2018;182:136-148.
Figures