4886
q-Space imaging is more sensitive to breast tumour cellularity than conventional diffusion-weighted imaging methods at 3T1Aberdeen Biomedical Imaging Centre, University of Aberdeen, Aberdeen, United Kingdom, 2Breast Unit, Aberdeen Royal infirmary, Aberdeen, United Kingdom, 3Pathology department, Aberdeen Royal Infirmary, Aberdeen, United Kingdom, 4Francis Crick Institute, London, United Kingdom, 5School of Medicine, University of Aberdeen, Aberdeen, United Kingdom
Synopsis
q-Space imaging (QSI) was compared against conventional DWI and non-Gaussian diffusion models of diffusion kurtosis imaging (DKI) and stretched-exponential model (SEM) to evaluate the skewness in histogram distribution of diffusion displacement and diffusivity for profiling breast tumour cellularity. We investigated whole breast tumours excised from surgery, with imaging performed same day overnight on a clinical 3T MRI system. We found QSI to yield a higher effect gradient to assess cellularity in breast cancer compared with conventional diffusion-weighted imaging methods. The skewness obtained from QSI further showed fidelity with the skewness of cellularity obtained from histology.
Introduction
Patients with breast cancer not responding to neoadjuvant chemotherapy are exposed to unnecessary drug toxicity and delays to surgical intervention. Although a reduction in tumour cellularity is a principle manifestation of early treatment response, existing radiological methods, examining changes to the proportion of cellularity across tumours from changes to histogram asymmetry (skewness), lack the adequate sensitivity required to differentiate non-responding patients 1,2. Q-space imaging (QSI), an advanced diffusion-weighted MRI method, provides unique profiling of tissue microstructure 3,4. We therefore hypothesised QSI to provide significantly greater sensitivity to tumour skewness than existing diffusion imaging methods, and to show a strong fidelity with the underlying cellularity skewness from histology.Methods
A prospective study was conducted in 20 patients (age range, 35–78 years) with breast cancer (10 grade II and 10 grade III) using a series of diffusion-weighted imaging acquisitions performed on whole tumours freshly excised from patients. NHS Research Ethics Committee approved the study and written informed consent was obtained prior to imaging. Whole excised specimens were submerged in formalin solution and imaged same day as surgery overnight to ensure no delay to pathological reporting.Images were acquired on a clinical 3T MRI unit (Achieva Tx; Philips Healthcare) using a body coil for uniform transmission and a 32-channel receiver head coil for high sensitivity signal detection. All imaging volumes were centred on the tumour with sections on the horizontal plane and circular saturation bands positioned around the tumour to suppress the signal from formalin. Sequential diffusion acquisitions were performed using multi-shot pulsed gradient spin echo (PGSE) sequence and SPIR fat suppression. Images were acquired with FOV of 141 x 141 mm2, slice thickness of 2.2 mm, matrix size of 64 x 64, in plane resolution of 2.2 x 2.2 mm2, 7–10 slices depending on tumour size, with diffusion weighting applied in three orthogonal gradient directions. Diffusion acquisition 1 (for assessment of monoexponential fitting (MONO), diffusion kurtosis imaging (DKI) 5, and stretched exponential model (SEM) 6 approaches), was performed over 17 linearly spaced b values from 0 to 2400 sec/mm2, as follows: spacing, 150 sec/mm2; δ/Δ, 18.7/31.5 msec; TR/TE, 3100/82 msec; two signal averages; and duration, 25:28 minutes. Diffusion acquisition 2 (for QSI assessment), was performed over 32 equidistant q values from 10.4 to 655 cm−1, equivalent to a maximum b value of 5000 sec/mm2, as follows: δ/Δ, 24.9/37.8 msec; TR/TE, 5900/94 msec; one NSA; and duration, 47:59 minutes 3,4.
To remove directionality, images of a specific diffusion weighting were computed as the voxel-wise average of images from 3 orthogonal diffusion directions of the corresponding diffusion weighting. Images from all diffusion acquisitions were convolved with a Gaussian kernel with full width at half maximum of 3 mm within the plane 7. The diffusivity maps of MONO, DKI and SEM were computed from diffusion acquisition 1 using a nonlinear fitting algorithm. QSI analysis was performed voxel wise to obtain displacement probability density function from diffusion acquisition 2 by Fourier transform analysis, to derive the full width at half maximum displacement (FWHM). Median and skewness were evaluated from the histogram distributions obtained from each of diffusion methods for delineated tumour volumes of interest. The magnitude of skewness obtained from QSI was compared against the skewness from other diffusion methods using within subjects analysis of variance and post hoc paired t-tests. The relative effect gradient of skewness obtained from QSI against other diffusion methods was compared using linear regression of skewness values. The correspondence between of the skewness and median values obtained from each diffusion method and the skewness and median values obtained from histologic cellularity were compared using Spearman correlation.
Results
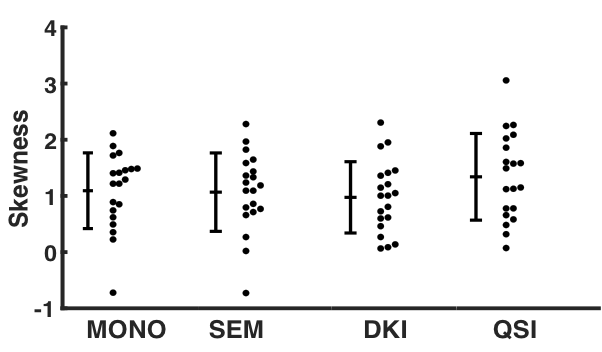
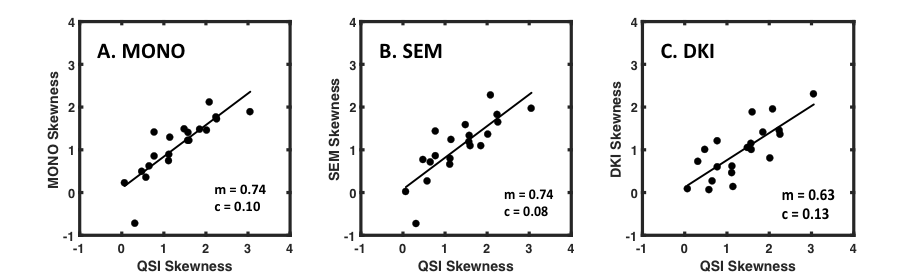
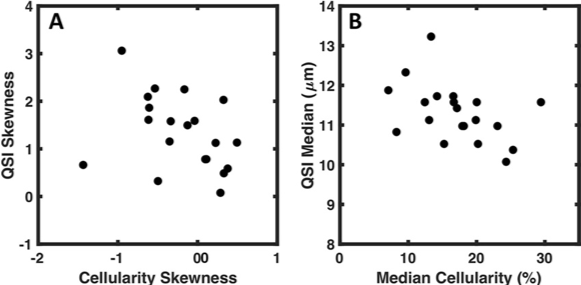
There was significant difference in skewness obtained from diffusion methods (F = 4.803, P = 0.015) (Fig. 1). The skewness from QSI (cohort mean ± standard deviation, 1.34 ± 0.77) was significantly higher (P < 0.017) compared to the skewness from MONO (1.09 ± 0.67, P = 0.015), SEM (1.07 ± 0.70, P = 0.014) and DKI (0.97 ± 0.63, P = 0.004). There was significant (P < 0.0005) linear correlation between the skewness from QSI and other diffusion methods, with QSI yielding a higher relative effect gradient (percentage increase) compared to MONO, 0.26/0.75 (35.1%), SEM, 0.26/0.75 (35.1%), and DKI, 0.37/0.63 (58.7%) (Fig. 2). There was significant correlation (P < 0.05) between the median obtained from each diffusion imaging method and the median from cellularity. There was significant correlation (P < 0.05) between the skewness from cellularity and the skewness from QSI (ρ = -0.468, P = 0.038) and DKI (ρ = -0.541, P = 0.014) (Fig. 3). There was non-significant correlation between the skewness from cellularity and skewness from MONO (ρ = -0.433, P = 0.056) and SEM (ρ = -0.389, P = 0.090).Discussion
We found that the tumour cellularity obtained from QSI had an increased effect gradient compared to the other diffusion-weighted imaging techniques, providing a measurement with amplified skewness in the tumour histogram distribution and significant correlation to the cellularity skewness from histology. QSI provides a promising non-invasive approach to elucidate cellularity in whole breast tumours at 3T.Acknowledgements
The authors would like to thank Dr Sai Man Cheung for conducting data auditing, Dr Matthew Clemence, Philips Healthcare Clinical Science, UK, for clinical scientist support, Ms Bolanle Brikinns for patient recruitment support, Mr Gordon Buchan for experiment material support, and Ms Mairi Fuller for providing access to the patients. NHS Grampian Endowment Research Grant funds this project and Nicholas Senn is supported by EASTBIO BBSRC PhD studentship.References
[1] Just N. Improving tumour heterogeneity MRI assessment with histograms. Br J Cancer. 2014;111(12):2205-2213.
[2] Jensen LR, Garzon B, Heldahl MG, et al. Diffusion-weighted and dynamic contrast-enhanced MRI in evaluation of early treatment effects during neoadjuvant chemotherapy in breast cancer patients. JMRI. 2011;34(5):1099-1109.
[3] Assaf Y, Mayk A, Cohen Y. Displacement imaging of spinal cord using q-space diffusion-weighted MRI. MRM. 2000;44(5):713-722.
[4] Yamada I, Hikishima K, Miyasaka N, et al. Esophageal carcinoma: Evaluation with q-space diffusion-weighted MR imaging ex vivo. Magn Reson Med. 2015;73(6):2262-2273.
[5] Jensen JH, Helpern JA, Ramani A, Lu H, et al. Diffusional kurtosis imaging: The quantification of non-gaussian water diffusion by means of magnetic resonance imaging. MRM. 2005;53(6):1432-1440.
[6] Bennett KM, Schmainda KM, Bennett RT, et al. Characterization of continuously distributed cortical water diffusion rates with a stretched-exponential model. MRM. 2003;50(4):727-734.
[7] Sun K, Chen X, Chai W, et al. Breast Cancer: Diffusion Kurtosis MR Imaging-Diagnostic Accuracy and Correlation with Clinical-Pathologic Factors. Radiology. 2015;277(1):46-55.
Figures