4885
MRI and PET for staging of axillary lymph nodes in breast cancer at diagnosis1Radiology, Renaissance School of Medicine, Stony Brook, NY, United States
Synopsis
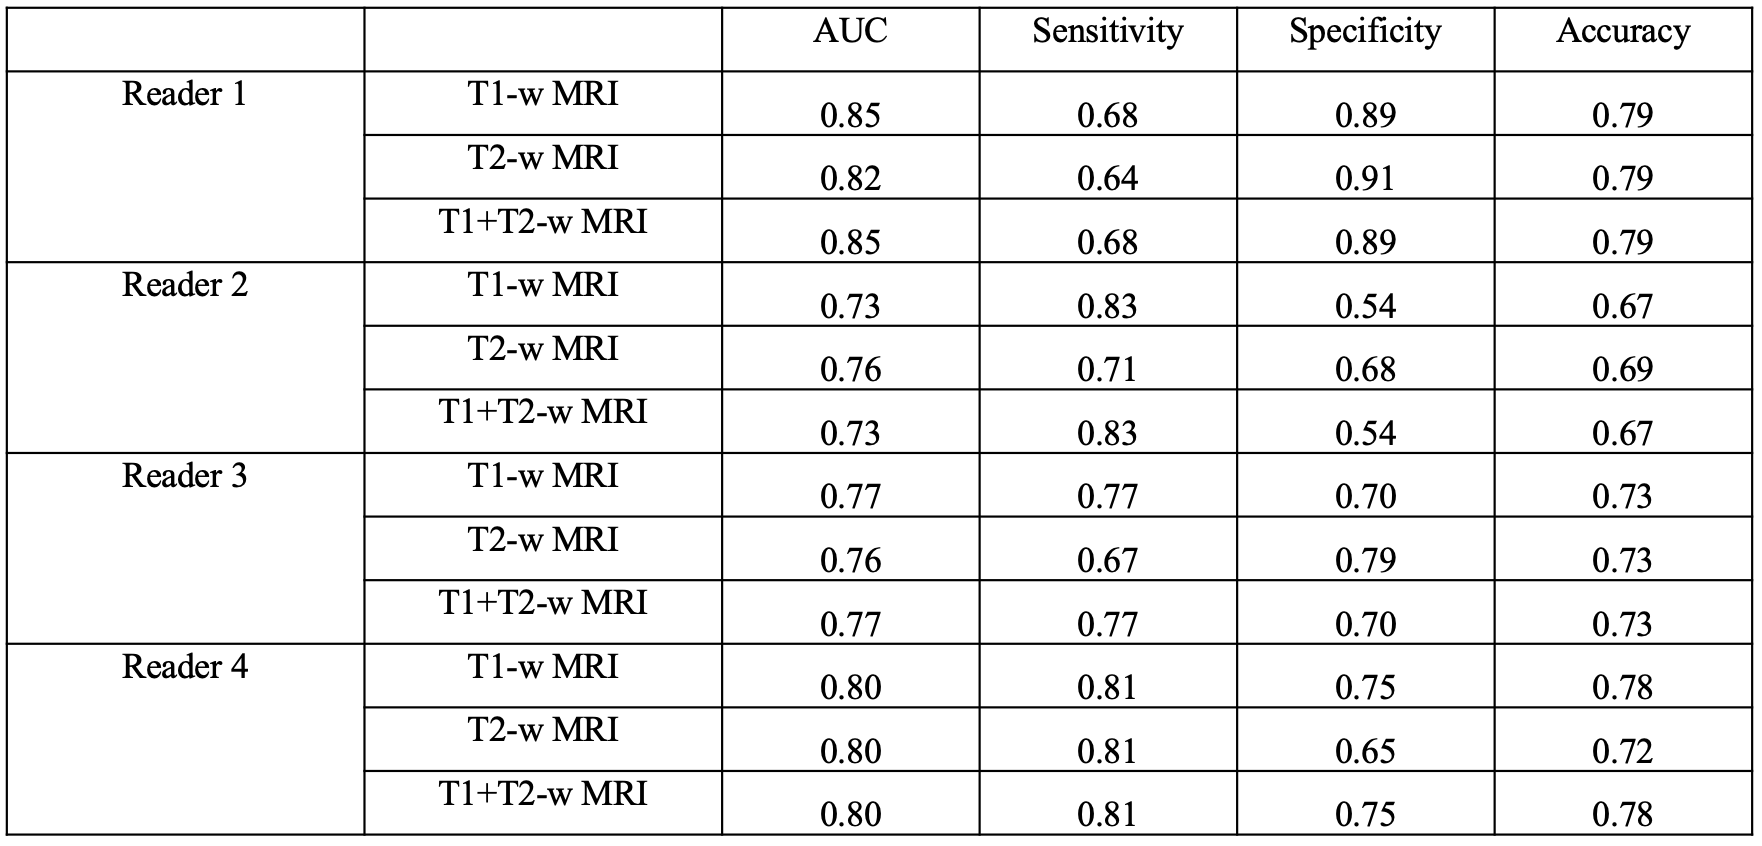
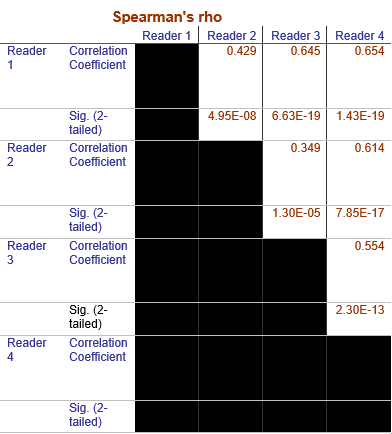
In breast cancer, lymph node status is highly related to prognosis. We evaluated the use of MRI of axillary lymph nodes (aLNs) to detect metastasis in pre-chemo breast cancer with PET as reference standard. For 4 readers scoring on T1-weighted DCE and T2-weighted MRI, the AUC, sensitivity, specificity and accuracy ranged from 0.73-0.85, 64%-83%, 54-91%, and 67-79%, respectively. Readers showed significant agreement (Spearman’s Rho 0.35-0.65). Though improvement is needed, this approach presents a less invasive method of assessing all aLNs and avoiding their unnecessary removal.
Introduction
The majority of the lymphatic fluid in breasts pass through the axillary lymph nodes (aLNs), making them critical in staging and treatment planning of breast cancer. Presence of nodal metastases decreases survival and increases likelihood of treatment failure [1, 2]. The current standard for nodal staging for breast cancer patients includes needle biopsy pre neoadjuvant chemotherapy (NAC) and sentinel lymph node biopsy (SLNB) or full dissection post NAC. Only a small amount of tissue can be sampled in the biopsy and the majority of nodes removed in SLNB are negative [3], suggesting that better screening methods are needed.MRI can 3D visualize all axillary lymph nodes in situ but aLNs are small and often clustered together, making cross-validation of MRI detection of nodal metastasis with pathology difficult. Two recent studies on FDG-PET have shown it can reliably detect and locate aLN metastasis in the whole breast with high accuracy (79 to 88%) [4, 5]. However, FDG-PET requires injection of a radiotracer and is generally not indicated for breast cancer patients at this stage, except where metastasis is suspected.
In this study we evaluate the use of MRI for radiological nodal staging of individual aLNs in breast cancer with PET as a reference standard.
Methods
120 unilateral breast cancer patients from 2011-2017 were found, of which 55 had pre NAC MRI and PET/CT. We identified 149 aLNs of which 69 (46%) showed FDG-PET hypermetabolism. FDG PET/CT and MRI data were acquired within 2 weeks of each other (average 6 days). Exclusion criteria were inadequate visibility in the axillary region on MRI or evidence of biopsy needle tracts and biopsy clips on MRI.Standard post-contrast MRI were obtained on a 1.5T GE clinical MRI scanner (Signa, GE Healthcare) using an eight-channel breast array coil (GE Liberty 9000). Standard 18FDG-PET/CT was obtained on a Biograph-40 PET-CT scanner (Siemens Medical System) with 40-detector row helical CT scanner.
Based on anatomical landmarks, the same nodes on the MRI and PET/CT were reliably identified for determination of disease in the aLNs. Each aLN on MRI and PET/CT images were independently scored in a blinded manner as 0, 1, 2, and 3 representing no, low, moderate, and high likelihood of cancer in the aLNs. aLNs on MRI were considered abnormal if there was absence of fatty hilum, cortical thickening or cortical enlargement. aLNs on PET were considered abnormal if they were hyperintense relative to background tissue as evaluated by a nuclear medicine radiologist. MRI staging (scoring) was performed by one experienced radiologist and three radiologist trainees. Sensitivity, specificity, accuracy and area under the ROC curve were calculated.
Results
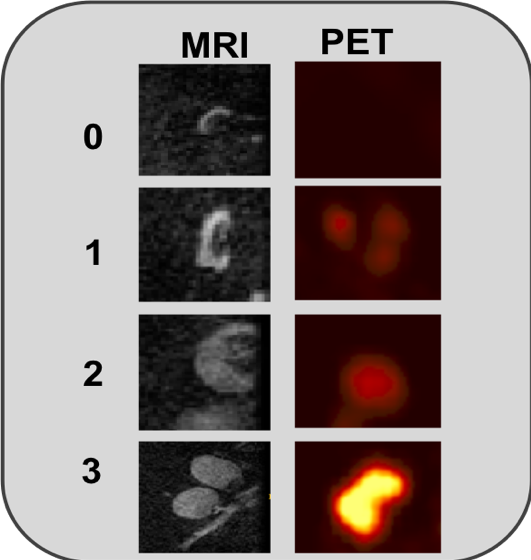
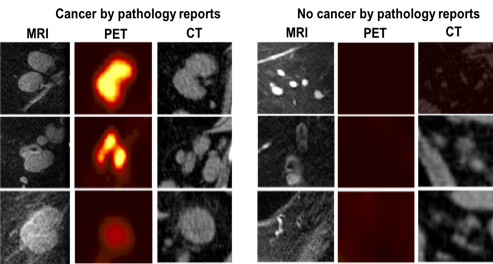
Figure 1 shows the typical MRI and PET scores as 0, 1, 2, and 3 as no, low, moderate, and high likelihood of cancer in the aLNs. Representative scoring of diseased and non-diseased nodes of are shown in Figure 2. The typical MRI characteristics of normal nodes were thin cortex, prominent fatty hilum, and small in size, whereas the typical MRI characteristics of abnormal nodes thickened and irregular cortex, absence of fatty hilum, rounded shape, and enlargement. The PET characteristics of normal nodes is no significant 18FDG-PET activity relative to background whereas abnormal nodes showed high 18FDG-PET activity.Figure 3 shows the performance of MRI staging for 4 readers. Reader 1 was an experienced radiologist with some additional training on aLN MRI. Reader 4 was an experienced trainee with specific training on aLN MRI. Reader 2 and 3 were less experienced trainees who received some training. Overall, AUC ranged from 0.85 to 0.73 depending on experience. Training was done by showing readers images of normal and abnormal nodes with known pathology results and testing on new images. Figure 4 Shows significant correlation between readers (Spearman’s Rho 0.35-0.65).
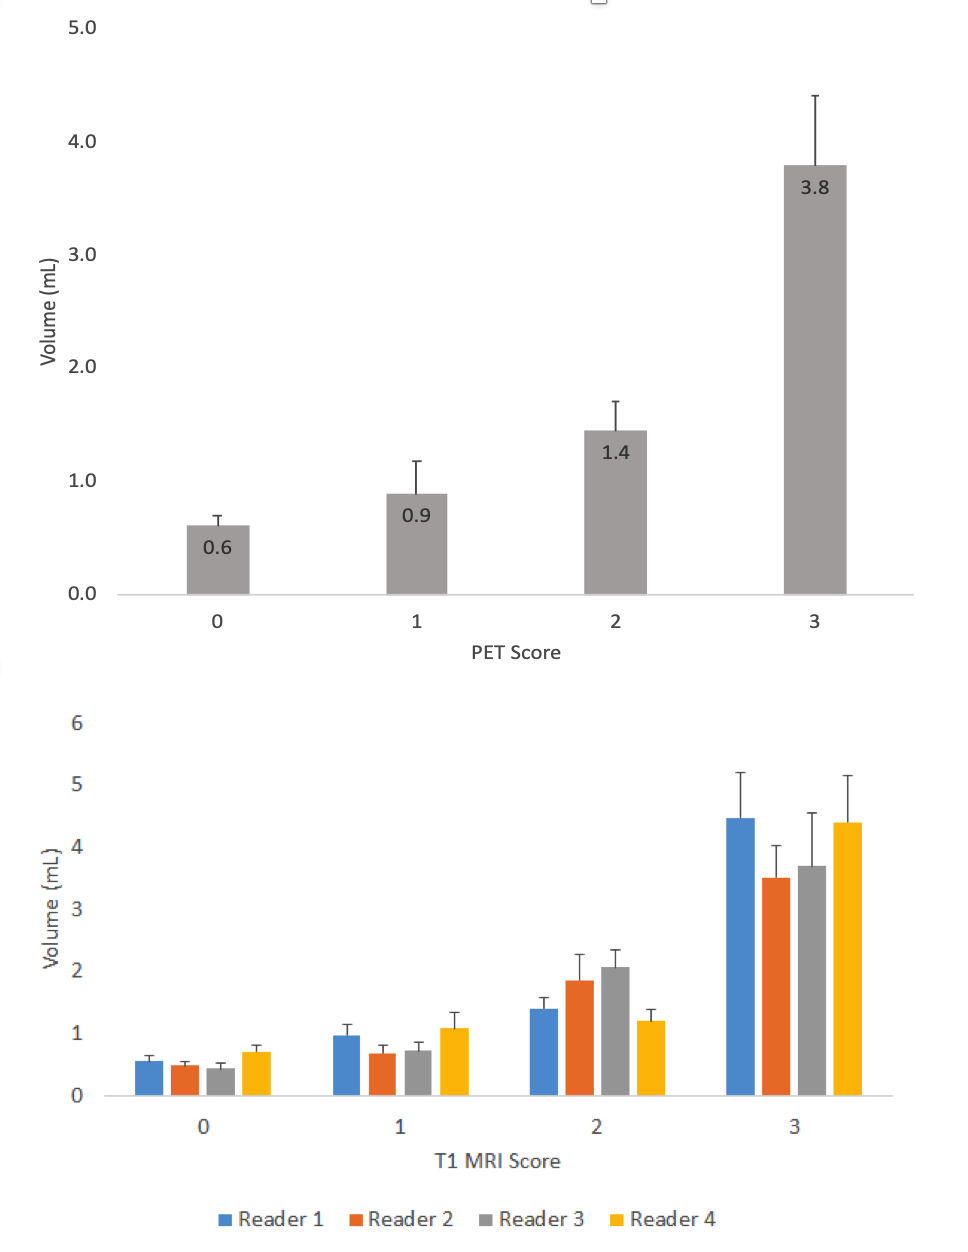
Figure 5 shows the aLN volume versus PET scoring and aLN volume versus MRI scoring. aLN volumes increased with increasing PET and MRI scores. However, volume was not the only factor used in scoring.
Discussion
There was good agreement between MRI and PET scores and the accuracy of the MRI scores are consistent with a few MRI studies assessing metastasis in the aLNs. Previously, He et al. assessed 1,242 aLN MRI and morphological features alone resulted in AUC, sensitivity and specificity ranging from 0.69 to 0.89, 51.5% to 83.6% and 68.4% to 86.3%, respectively [6]. Other studies showed an MRI sensitivity of 82.0% and negative predictive value (NPV) of 82.6%[7]. In particular, DCE-MRI had a lower median sensitivity (60.0%) and NPV (80.0%) compared to non-enhanced T1-weighted and T2-weighted MRI sequences (88.4-94.7%), and diffusion-weighted imaging (84.2-90.6%) [7], possibly due to enhancement obscuring lymph node architecture. Our study using T1-weighted DCE and T2-weighted images from a standardized breast protocol compares favorably with these studies.Conclusion
MRI radiological scoring of aLNs provides accurate staging of aLNs, although improvement is needed to visualize and evaluate aLNs more consistently. A benefit of using MRI is that it is less invasive and is capable of assessing lymph nodes located deep beneath the skin. aLN data is available from standard breast MRI and doesn't disrupt regular clinical workflow. Improvement of this technique can minimize unnecessary SLNB.Acknowledgements
No acknowledgement found.References
1. Carter, C.L., C. Allen, and D.E. Henson, Relation of tumor size, lymph node status, and survival in 24,740 breast cancer cases. Cancer, 1989. 63(1): p. 181-7.
2. Nemoto, T., et al., Management and survival of female breast cancer: results of a national survey by the American College of Surgeons. Cancer, 1980. 45(12): p. 2917-24.
3. Kim, T., A.E. Giuliano, and G.H. Lyman, Lymphatic mapping and sentinel lymph node biopsy in early-stage breast carcinoma: a metaanalysis. Cancer, 2006. 106(1): p. 4-16.
4. Mori, M., et al., Diagnostic performance of time-of-flight PET/CT for evaluating nodal metastasis of the axilla in breast cancer. Nucl Med Commun, 2019. 40(9): p. 958-964.
5. Orsaria, P., et al., Evaluation of the Usefulness of FDG-PET/CT for Nodal Staging of Breast Cancer. Anticancer Res, 2018. 38(12): p. 6639-6652.
6. He, N., et al., A new, preoperative, MRI-based scoring system for diagnosing malignant axillary lymph nodes in women evaluated for breast cancer. Eur J Radiol, 2012. 81(10): p. 2602-12.
7. Kuijs, V.J., et al., The role of MRI in axillary lymph node imaging in breast cancer patients: a systematic review. Insights Imaging, 2015. 6(2): p. 203-15.
Figures